Crystalline phases of polydisperse spheres
Abstract
We use specialized Monte Carlo simulation methods and moment free energy calculations to provide conclusive evidence that dense polydisperse spheres at equilibrium demix into coexisting fcc phases, with more phases appearing as the spread of diameters increases. We manage to track up to four coexisting phases. Each of these is fractionated: it contains a narrower distribution of particle sizes than is present in the system overall. We also demonstrate that, surprisingly, demixing transitions can be nearly continuous, accompanied by fluctuations in local particle size correlated over many lattice spacings.
Suspensions of spherical colloids have long served as an experimentally accessible testing ground for our understanding of the liquid, crystalline and glassy states of matter PUSEY ; PUSEY09 . Such work is complemented by theory and simulation, which attempt to reproduce, rationalize and predict experimental results. In so doing, it is common to treat the suspension as an assembly of identical spheres. But this neglects a key feature, namely that the chemical processes by which real colloids are synthesized invariably produce particles that have a spread of diameters, i.e. they are ‘polydisperse’. As is becoming increasingly clear, polydispersity gives rise to a rich variety of novel phenomena not observed in monodisperse systems Sollich2002 . However, despite sustained attention, basic questions remain concerning its effects on one of the most fundamental aspects of any thermal system, namely the equilibrium phase behaviour.
A case in point is the character of the thermodynamically stable structures of size-disperse spheres in the dense regime, above typical fluid densities. Polydispersity should act to destabilize a crystal because of the difficulty of accommodating a range of particle sizes within a single lattice structure; but there has been no definite answer as to what stable structures arise instead. Indeed, the nature and extent of the influence of polydispersity both on the crystalline phases and the location of the freezing line is controversial. On the theoretical front, there is a diverse range of predictions of novel phenomena including reentrant melting Bartlett1999 , an ‘equilibrium glass’ phase Chaudhuri2005 , and solid-solid coexistence Bartlett1998 ; Sear1998 ; Yang2009 . Additionally, recent simulation work has reported the occurrence of a partly crystalline ‘inhomogeneous phase’ within an approximate phase diagram based only on equality of single-phase free energies Fernandez2007a ; Fernandez2009 . Other simulations suggest that the fluid-solid coexistence region terminates in a critical point beyond which a disordered solid occurs NOGAWA2009 . On the experimental side, studies of colloidal systems observe that beyond a certain ‘terminal’ polydispersity no crystallization occurs on experimental timescales PUSEY , although it remains unclear whether this is a true equilibrium effect or a manifestation of dynamic arrest.
A crucial distinction between monodisperse and polydisperse systems at phase coexistence is the ability of the latter to fractionate so that the distribution of the particle diameters, , varies from phase to phase fredrickson1998 ; Sollich2001 ; Erne2005 . If for a certain phase (labeled ), one counts the number density of particles having diameters in the range , this serves to define a density distribution . Experimentally, however, for most complex fluids one has the constraint that the overall distribution of sizes (across all phases) has a form fixed by the synthesis of the fluid. This gives rise to a generalized lever rule: , with the fractional volume occupied by phase , the ‘parent’ density distribution and the ‘daughter’ distributions. Since the form of the parent is fixed, only its scale is free to vary, e.g. by dilution with solvent, and one writes , where is the total number density and is a prescribed normalized shape function. The polydispersity, , is then defined as the standard deviation of the parent distribution, in units of its mean.
The diversity of theoretical and simulation findings stems from the sensitivity of the results to the accuracy with which fractionation is treated. Previous work has either disregarded fractionation entirely, or used drastic (and differing) approximations to describe it. An exception are moment free energy (MFE) theory calculations, which do account fully for fractionation, and which have previously been reported by one of us for hard spheres Fasolo2004 . These predict that increasing polydispersity shifts the fluid-solid coexistence region to higher number densities, but that neither reentrant melting nor a terminal polydispersity occurs. Instead, the fluid can always split off a small volume of dense phase whose size distribution is sufficiently narrow for crystallization. Moreover, as one increases or within the solid region, a succession of phase transitions is predicted in which the system demixes into an ever greater number of differently-fractionated ‘daughter’ phases. However, the MFE calculation uses approximate free energy expressions, which for solids are derived from those of binary mixtures and implicitly already assume that all solids are fcc. Independent confirmation of its predictions is then highly desirable, but has hitherto been lacking. In this Letter we provide a definite answer to the question of the nature of the equilibrium phase behaviour via state-of-the-art Monte Carlo (MC) simulations, and compare with MFE calculations; both fully provide for fractionation and employ a fixed parent size distribution.
In simulations the appropriate framework for observing genuine equilibrium behaviour in dense polydisperse particles is the isobaric semi-grand canonical ensemble Kofke1999 ; FrenkelSmit2002 . This is the analog of a monodisperse ensemble where the prevalence of different particle sizes is controlled by imposing in addition chemical potential differences that are measured relative to the chemical potential of some reference particle size. Monte Carlo sampling of this ensemble can exploit particle resizing moves to allow local sampling of the size distribution without the need for particle diffusion (thus catering for fractionation effects), while volume updates facilitate density fluctuations so that the system can transform between phases. Our study is the first to deploy this ensemble in the crystalline regime together with a method for imposing a fixed overall parent distribution. This allows determination of physically realistic phase behaviour including the boundaries of the onset of coexistence (known as cloud curves) and daughter distributions. Additionally we can calculate – but do not show here – shadow curves which record the density and volume fraction of the new phase when coexistence first occurs. Cloud and shadow curves do not coincide, demonstrating further the presence of fractionation: new phases that appear generically have size distributions different from the parent Sollich2002 . We combine the above techniques with the specialized phase switch Monte Carlo (PSMC) method Wilding2000 ; Wilding2009a for obtaining fluid-solid coexistence properties. In both cases, the chemical potential differences are determined iteratively to match the ensemble-averaged density distribution to the prescribed parent . At coexistence, this is supplemented by an equal peak weight criterion for the order parameter distribution to ensure that finite-size effects are exponentially small in system size buzzacchi2006 ; Wilding2009 .
We stress that the choice of ensemble and use of sophisticated sampling and analysis techniques are crucial to observing qualitatively correct phase behaviour in polydisperse systems. Use of standard canonical Fernandez2007a or microcanonical ensembles Fernandez2009 ; NOGAWA2009 are unequal to the task and almost certainly yield major artifacts. The reasons for this are three fold: (i) the dynamics is too slow to allow fractionation on simulation timescales; (ii) the sizes of the particles are fixed, which for a finite system prevents daughter distributions assuming an arbitrary form as they can in the thermodynamic limit; (iii) these ensembles necessarily form interfaces between coexisting phases and for accessible particle numbers one cannot hope to see multiple coexisting crystalline phases when this occurs.
Our simulations consider a system of particles interacting via a strongly repulsive pair potential
| (1) |
with particle distances and interaction radii . The choice of this potential rather than infinitely repulsive (hard) spheres is made on pragmatic grounds: an MC contraction of the simulation box that leads to an infinitesimal overlap of two hard spheres will always be rejected, so (particularly at high densities) we can expect higher MC acceptance rates using this ‘softer’ potential. In common with hard spheres, the monodisperse version of our model freezes into an fcc crystalline structure Hoover1970 ; Wilding2009a , and temperature only plays the role of a scale: the thermodynamic state depends not on and separately but only on the combination . Phase diagrams for different then scale exactly onto one another, and we can fix .
We consider parent size distributions of the top-hat form:
| (2) |
The width parameter controls the polydispersity , and we have set the mean particle diameter to 1. With these choices, and the interaction potential (1), our results are directly comparable to the phase diagram of Ref. Fernandez2007a where neither fractionation nor, at a more basic level, the presence of coexistence regions of finite width was allowed for.
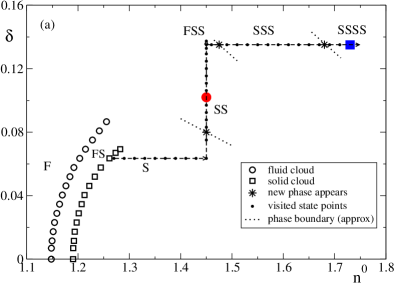
Using PSMC we have mapped the cloud curves of the fluid-solid transition, using as our control parameter, up to polydispersities of on the fluid side and for the solid, both of which are in the typical range for colloidal systems, but not so great that we expect to see exotic phases such as . As shown in Fig. 1a, both the fluid (circles) and the solid (squares) phase cloud densities shift to higher as is increased, but without the sharp narrowing that would be required for a reentrant melting scenario Bartlett1999 .
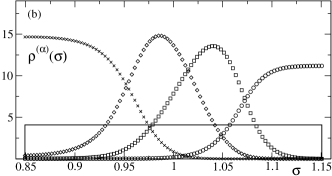
Turning now to the solid region, a comprehensive exploration of the (-) plane is impractical because of the relatively high computational cost of our specialized simulation technique. But we can understand important qualitative features by following the dashed trajectory included in Fig. 1a. Along this path, we monitored the state of the system via the probability distribution of the fluctuating total number density , which serves as an order parameter for phase changes. Starting from the fcc solid cloud point at , we initially increased in a stepwise fashion (filled circles) to , and then switched to increasing at constant as a potentially faster route to demixing. Indeed, at there was a smooth change in from single to double peaked; an example of the double peaked form is shown in Fig. 2. The two associated phases were identified as being fcc solids. As is physically reasonable, the higher density solid (HDS) daughter phase contains a surplus of the smaller particles while the lower density solid (LDS) phase has more of the larger particles.
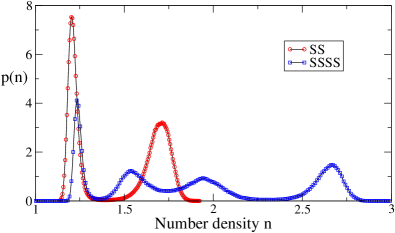
Continuing to higher eventually led to spontaneous melting of the system at , implying that the limit of metastability with respect to a fluid-solid-solid (FSS) coexistence had been overstepped, as is indeed predicted by our MFE calculations (see below). We therefore backtracked slightly into the solid-solid (SS) region, embarking on a new trajectory with increasing at constant . This produced a third peak in at . The corresponding intermediate density solid (IDS) was again found to be isostructural with the other two, with dominant particles sizes between those in the HDS and LDS. Finally, increasing the overall density to we observed that the central IDS peak in split rather smoothly into two peaks, yielding a four peaked structure (Fig. 2): four fcc solids now divide the range of particles sizes among themselves (Fig. 3).
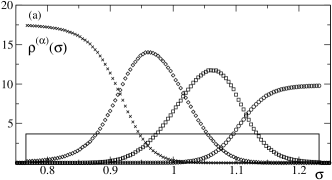
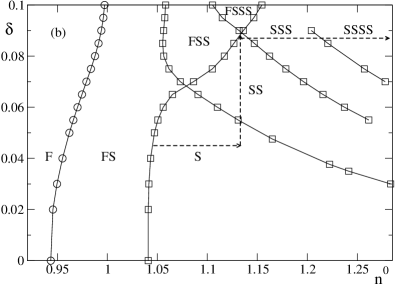
We next compare to our theoretical MFE calculations. These used the same parent size distribution (2) but, since no suitable polydisperse model free energies are available for the soft repulsive potential (1), the analysis was performed for hard spheres, using the methodology described elsewhere Fasolo2004 . The qualitative physics should be the same. Indeed, taking a comparable path path through the calculated phase diagram (Fig. 1b) shows the same features as in the simulations. (Quantitatively, the fluid-solid coexistence region is narrower, and transitions to multiple solids occur at lower and , presumably because with a hard repulsion, a crystal can accommodate above average-sized particles less easily.) Also the fractionation effects are well reproduced, as shown in Fig. 3b for an SSSS state point at a location comparable (relative to phase boundaries path ) to the one in Fig. 3a.
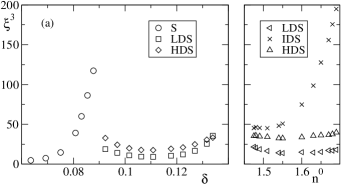
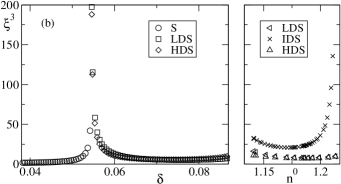
A surprising feature of our results is that, from the variation of , the transitions SSS and SSSSSSS appear to be near-continuous in character, while SSSSS is strongly first order as is usually expected for transitions in the solid state. A near-continuous transition should be accompanied by size fluctuations correlated over large distances, as precursors of the new phases, whereas the fluctuations will remain small on approaching a first order transition. To quantify these fluctuations we measure a correlation volume from the variance across configurations of the mean particle size . Suitably normalized, this variance, , is proportional to the spatial integral over the pair correlation , weighted by deviations of the particle sizes and from the mean, i.e. the correlation volume. In theoretical calculations, can be extracted from second derivatives of the MFE Sollich2001 . Measurements of along the trajectories through the phase diagrams are shown in Fig. 4. This grows large near the transitions to two and four solids, confirming their near-continuous character. In the latter case, the splitting of the middle peak seen earlier in suggests that the new solids arise out of the IDS phase, and this is consistent with large fluctuations occurring (see Fig. 4) only in this phase and not the HDS or LDS. The MFE predictions are, again, in good qualitative accord with the simulation data.
Our tailored simulations have provided a clear answer to long standing questions surrounding the effect of size polydispersity on the equilibrium phase behaviour of spherical particles: as density and/or polydispersity are increased within the crystalline region, the system demixes into an ever increasing number of fractionated fcc phases. Given the high level of qualitative accord with MFE calculations, we are confident that this scenario represents the true equilibrium situation. Since the MFE results are insensitive to whether the parent distribution is top hat (present work) or has a Schultz or triangular form Fasolo2004 , we believe the demixing scenario to be quite general. Understanding in detail when and why the demixing transitions are near-continuous is an exciting open challenge. Finally, we note that in spherical colloids demixing transitions may not always be directly observable because fractionation requires particle diffusion which is inhibited in solids. Nonetheless, one might expect to see evidence for solid demixing in regions where the solids coexist with a fluid (cf. Fig. 1b) that can transport particles to their preferred solid phase. Even in situations where equilibrium cannot be reached for kinetic reasons, knowledge of the true equilibrium state provides an important baseline for interpreting dynamical effects Evans2001 ; PUSEY09 .
References
- (1) P.N. Pusey, Les Houches: Liquids, freezing and glass transitions (North Holland, Amsterdam, 1991).
- (2) E. Zaccarelli et al., Phys. Rev. Lett. 103, 135704, (2009).
- (3) P. Sollich, J. Phys.: Condens. Matter 14, R79 (2002).
- (4) P. Bartlett and P. B. Warren, Phys. Rev. Lett. 82, 1979 (1999).
- (5) P. Chaudhuri et al., Phys. Rev. Lett. 95, 248301 (2005).
- (6) Paul Bartlett, J. Chem. Phys. 109, 10970 (1998).
- (7) R. P. Sear, Europhys. Lett. 44, 531 (1998).
- (8) M. Yang and H. Ma, J. Chem. Phys. 130, 031103 (2009).
- (9) L. A. Fernandez, V. Martin-Mayor, and P. Verrocchio, Phys. Rev. Lett. 98, 085702 (2007).
- (10) L. A. Fernandez, V. Martin-Mayor, B. Seoane and P. Verrocchio, arXiv:0910.4924.
- (11) T. Nogawa, N. Ito and H. Watanaba, arXiv:0910.5582.
- (12) G. H. Fredrickson, Nature 395, 323 (1998).
- (13) P. Sollich, P. B. Warren, and M. E. Cates, Adv. Chem. Phys. 116, 265 (2001).
- (14) B. H. Erne et al., Langmuir 21, 1802 (2005).
- (15) M. Fasolo and P. Sollich, Phys. Rev. E 70, 041410 (2004).
- (16) D. A. Kofke and P. G. Bolhuis, Phys. Rev. E 59, 618 (1999).
- (17) D. Frenkel and B. Smit, Understanding Molecular Simulation, Academic, (2002).
- (18) N. B. Wilding and A. D. Bruce, Phys. Rev. Lett. 85, 5138 (2000).
- (19) N. B. Wilding, Mol. Phys. 107, 295 (2009).
- (20) M. Buzzacchi, P. Sollich, N. B. Wilding, and M. Müller, Phys. Rev. E 73, 046110 (2006).
- (21) N. B. Wilding, J. Chem. Phys. 130, 104103 (2009).
- (22) W. G. Hoover et al., J. Chem. Phys. 52, 4931 (1970).
- (23) As standard mappings from soft to hard spheres fail at our densities, we use phase diagram topology to identify comparable points. E.g. the simulations at show an instability towards FSS very close to the SSSSS transition. From the density difference between these two points, relative to the separation between SSSSS and SSSSSSS, we estimate the corresponding polydispersity for hard spheres as , just below the meeting point of the SSFSS and SSSSS lines.
- (24) R.M.L. Evans and C.B. Holmes, Phys. Rev. E64, 011404 (2001).