Low density symmetry energy effects in the neutron star crust properties
Abstract
The form of the nuclear symmetry energy around saturation point density leads to a different crust-core transition point in the neutron star and affect the crust properties. We show that the knowledge about close to the saturation point is not sufficient, because the very low density behaviour is relevant. We also claim that crust properties are strongly influenced by the very high density behaviour of , so in order to conclude about the form of low density part of the symmetry energy one must isolate properly the high density part.
keywords:
PACS:
26.60.+c , 21.30.Fe , 21.65.+f , 97.60.Jd1 Introduction
One of the most intriguing quantity in the description of nuclear matter in neutron stars is the symmetry energy , which is defined as follows
| (1) |
where represents the energy of nucleonic matter per baryon as a function of baryon number density and the isospin asymmetry , where and are the neutron and proton densities. At the saturation point density the value of symmetry energy corresponds to the parameter in the Bethe-Weizsäcker mass formula, and takes the value . Isoscalar part of interactions is represented by the isoscalar potential which is mainly responsible for the stiffness of the Equation of State (EoS).
Density dependence of is however highly uncertain both below and above saturation point . This dependence is one of the goals of the experimental investigations carried on the radioactive beam colliders [1, 2]. This kind of facilities allow for research of nuclear matter with large isospin asymmetry. The analysis shown in [4, 3, 5] put some constraints on the slope and curvature of around however we are still far from the final conclusion about the global shape of the symmetry energy.
The role played by the in the context of various neutron star observables was emphasized in [6] and more detailed analysis was made in [7]. One of the first approach to the crust-core transition was presented in [8] where the stability considerations were performed. This kind of analysis with an improved nuclear model was later used in [9]. In this work authors suggested the different critical density in different nuclear models comes from their discrepancy in the neutron matter description, e.g. in the symmetry energy form. The direct connection of to the crust-core transition point was shown in [10] and possible phase separation in the inner core was analysed in [11]. In this work we would like to go along this line to emphasize that the very low density behaviour of the symmetry energy is essential for the crust-core transition point. It is especially interesting taking into account the recent experimental results [12, 13] which show the symmetry energy still takes large values at densities very much below . This result is in contrast to common conviction coming from various theoretical approaches that states the goes almost linearly to zero for low densities. So, the consequences of the symmetry energy with such unusual feature seems to be worth to be seen.
2 The crust-core transition point
In order to estimate the crust-core transition point the bulk instability conditions were applied. It is based on the vanishing compressibility which signals the one-phase system is unstable against the density fluctuations and must split into two phases. It was shown in [10] that the compressibility under constant charge chemical potential - is the proper quantity in case of matter under beta equilibrium. It is defined as follows
| (2) |
where is the total pressure (nucleons + leptons). When nuclear matter contribution to the total energy is described by Eq. (1) then the stability condition takes the form
| (3) | |||||
where the role played by the symmetry energy is apparent. For densities typical for the neutron star core the compressibility is positive but decreases as density decreases. For some density , located below , the compressibility vanishes. It means the charge fluctuations are not stable - below the matter cannot exist in one phase and must separate into two phases which may form a crystal lattice. However, the answer, where is situated the inner edge of the crust, is much more complicated.
There is no unique method to determine at what density the solid crust starts to form. Here we want to discuss this issue. The critical density for vanishing compressibility represents the absolute limit for the homogeneous and neutral system. It means the phase splitting must occur before reaching the . Indeed, the energy for the two-phase system becomes smaller than for the one-phase system before the density approaches the critical value [18, 9]. The boundary for two phase coexistence, is then located slightly above as it is shown in Fig.1.
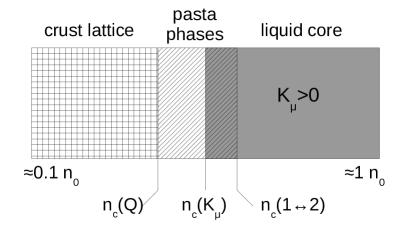
Both and are quantities derived in the bulk approximation, i.e. without the finite size effects included. The finite size structures require inclusion of the additional forms of energy like the Coulomb and surface energy. Competition between them, leads to structures with various dimensionality (rods, plates) usually called pasta phases [22]. The presence of these exotic structures is however model dependent, moreover mechanical properties of rods and plates resemble rather liquid crystals than solid state [23]. The shear tensions in all spatial directions can be supported only by a 3-dimensional lattice of 0-dimensional structures, e.g. the lattice of almost point-like nuclei immersed in the less dense medium, e.i. the gas of electrons and dripped neutrons. So, for the most reliable position of the crust edge one should take the point where the nuclei start to deform into very long structures or, keeping their spherical form, dissolve in the surrounding medium.
The finite size effects may also be included in the stability consideration of one-phase system as was done in [9]. The most important ingredient in this analysis appeared to be the Coulomb energy. Being repulsive, the Coulomb force stabilizes fluctuations of charge and makes matter more resistive to formation of charged clusters. The corresponding critical density is then moved to lower densities, always below (see Fig.1). For some kind of interactions (e.g. Skyrme-like in [18]) the almost coincides with the point where nuclei disappear, so it may be treated as the very likely estimation of the crust-core transition.
In this work we stay with the simplest condition, what means we get upper bound on the crust mass and thickness. The difference between and is not so large, usually smaller than 10%. The comparison between these quantities was already done in [9] and for modern nuclear models in [19, 21]. The condition (3) corresponds to the cross-point of the border of spinodal region at zero temperature with beta equilibrium condition in stellar matter as it was considered in [20].
3 Nuclear models
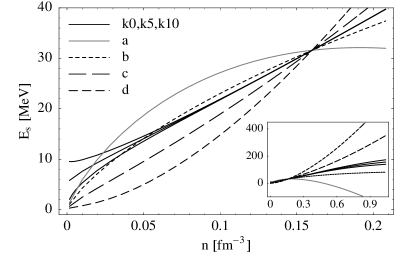
Different models of nuclear interactions, while being consistent at saturation point , leads to large discrepancies for EoS at higher densities. In order to estimate the role played by we used a model which have the same isoscalar part of interactions and different form of the isovector part The taken from Prakash et.al. [15] correspond the compressibility at saturation point .
Various shapes of symmetry energy, where taken from MDI model [4] and named as in [10]. The symmetry energy in MDI family presents large discrepancies both in the low and in the high density region. Also the slope and curvature at the saturation point take different values. The only common property is the value of the symmetry energy at . Especially, the large differences at high densities lead to a differences in the global stellar parameters like its radius and compactness. Those global parameters indirectly affect the crust thickness and its contribution to the total star mass what obscure the picture. In order to isolate the low density properties of from the rest we use a specific parametrization which presents the same shape of at saturation point and very tiny differences at high density. It has the following form
| (4) |
where . The control the behavior at very high density and was taken here to get intermediate values of between extremal cases ( and ) in the MDI family. The remaining parameters were derived to ensure the same slope MeV and the stiffness MeV at while at approaches three different values 0, 5 and 10 MeV. The shape of symmetry energy for all models are shown in Fig.2.
Above models of nuclear interaction cannot be use to obtain EoS for very low densities, in the crust region. In order to obtain the EoS int the full range, up to the edge of the star, they have to be completed with the EoS for the crust itself. Here we used well established results from [16] and [17].
| [MeV] | ||||
|---|---|---|---|---|
| 247.08 | 40.93 | 48.836 | 0 | 0.080 |
| 181.98 | 103.43 | 15.502 | 5 | 0.073 |
| 116.87 | 165.93 | -17.831 | 10 | 0.065 |
4 Results
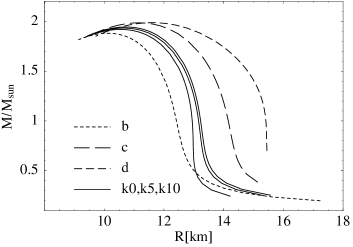
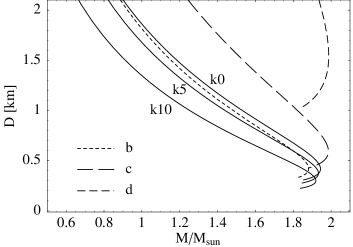
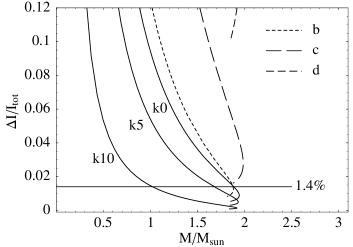
In this section the results are presented. In the Fig.3 the mass-radius relation is shown. One may observe huge differences in the MDI family. These differences are caused only by the symmetry energy shape because the isoscalar part is the same for all EoSs. The symmetry energies in the MDI family diverge enormously at higher densities. There are no results for the model because its takes so large negative values at high density that makes the pressure bounded from above and leads to unstable EoS. The rest, - models, present large differences in the compactness of neutron star giving difference in the surface gravitation. Hence any crustal parameters like thickness, mass etc. are changed not only by the form of at the crust region but also by its values in deep core region. For the family is almost the same at high density and the M-R relations for - models are similar to each other. The differences between them slightly increase with the dropping mass what is natural as the crust occupies more an more volume of the star and differences in the EoS at low density are more pronounced. The effect of the high density form is apparent when one compare critical densities for different models. In the MDI family, for one get (see [10]) whereas for : (see Tab.1). The difference in critical density for and is less then in the family but the difference in the crust thickness (see Fig.4) is much larger than one could expect from the position. Surely it comes from the different compactness of the star as a whole. In the case the star is more compact and its crust is more squeezed by the gravity. The effect is even better seen for the crustal fraction of the moment of inertia, Fig.5. As one can note for the typical star the relative differences among models reach hundreds of percents whereas for the family are not so large.
At the end of the discussion we focus on the models themselves. The symmetry energy for this family was constructed to ensure the same behaviour at high density and keep the same slope and curvature at the saturation point in agreement with recent results from experimental results. The only difference was the asymptotic value of the at vanishing density . We have probed values 0, 5 and 10 MeV. Considering the shapes of in the Fig.2 one may conclude that the is very essential quantity for the crust properties. The symmetry energies for the family are almost overlapping in the region and below and their discrepancies seems to be negligible in comparison to - lines, however they effect in quite large differences for the crust thickness and moment of inertia. We also observe that higher systematically makes the crust thinner and its contribution to total moment of inertia takes very low values.
In order to refer our results to observations we indicated the upper bound on the crustal moment of inertia for the Vela pulsar coming from analysis performed by Link in [24]. The line for model goes below in very wide range of stellar masses. We do not know the Vela pulsar mass, so in that sense the model cannot be verified, but if we trust experimental results that MeV it would mean the Vela pulsar mass should have its mass not greater than .
5 Summary
We perform the analysis on how the very low symmetry energy behavior effects the basic neutron star crust parameters. Although the crust encompasses the densities below , also the high density behavior of the symmetry energy influences its properties. In order to be able to conclude about the low density part we constructed a special family of symmetry energies. They presented the same shape at saturation point and above but differ when density goes to zero. It was shown that unusual property like the non-vanishing symmetry energy at zero density leads to a very thin crust with very small contribution to the total moment of inertia.
References
- [1] V. Baran, M. Colonna, V. Greco and M. Di Toro, Phys. Rept. 410 (2005) 335
- [2] B. A. Li, L. W. Chen and C. M. Ko, Phys. Rept. 464 (2008) 113
- [3] L. W. Chen, C. M. Ko and B. A. Li, Phys. Rev. C 72 (2005) 064309
- [4] L. W. Chen, C. M. Ko and B. A. Li, Phys. Rev. Lett. 94 (2005) 032701
- [5] L. W. Chen, C. M. Ko, B. A. Li and G. C. Yong, Int. J. Mod. Phys. E 17 (2008) 1825
- [6] J. M. Lattimer and M. Prakash, Astrophys. J. 550, 426 (2001)
- [7] A. W. Steiner, M. Prakash, J. M. Lattimer and P. J. Ellis, Phys. Rept. 411 (2005) 325
- [8] G. Baym, H. A. Bethe and C. Pethick, Nucl. Phys. A 175 (1971) 225.
- [9] C. J. Pethick, D. G. Ravenhall and C. P. Lorenz, Nucl. Phys. A 584 (1995) 675.
- [10] S. Kubis, Phys. Rev. C 76 (2007) 025801
- [11] S. Kubis, Acta Phys. Polon. B 38 (2007) 3879.
- [12] S. Kowalski et al., Phys. Rev. C 75 (2007) 014601
- [13] J. B. Natowitz et al., Phys. Rev. Lett. 104 (2010) 202501
- [14] A. Akmal, V. R. Pandharipande and D. G. Ravenhall, Phys. Rev. C 58 (1998) 1804
- [15] Prakash et.al. Phys.Rev.Lett. 61 (1998) 2518
- [16] P. Haensel, B. Pichon, Astron. Astrophys. 283 (1994) 313
- [17] F. Douchin, P. Haensel, Astron. Astrophys. 380 (2001) 151
- [18] F. Douchin and P. Haensel, Phys. Lett. B 485 (2000) 107
- [19] K. Oyamatsu and K. Iida, Phys. Rev. C 75 (2007) 015801
- [20] C. Ducoin, C. Providencia, A. M. Santos, L. Brito and P. Chomaz, Phys. Rev. C 78, 055801 (2008)
- [21] J. Xu, L. W. Chen, B. A. Li and H. R. Ma, Phys. Rev. C 79 (2009) 035802
- [22] C. P. Lorenz, D. G. Ravenhall and C. J. Pethick, Phys. Rev. Lett. 70 (1993) 379.
- [23] C. J. Pethick and A. Y. Potekhin, Phys. Lett. B 427 (1998) 7
- [24] B. Link, R. I. Epstein and J. M. Lattimer, Phys. Rev. Lett. 83 (1999) 3362