Chapter 1 Review on - mixing
To appear in the proceedings for XXIX Physics in Collision, International Symposium,
Kobe, Japan, August 30 - September 2, 2009
Fernando Martínez-Vidal, on behalf of the BaBar Collaboration
Instituto de Física Corpuscular (IFIC), Universitat de València-CSIC,
Apartado de Correos 22085, E-46071 Valencia, Spain
Abstract
We review the current status of - mixing, with special emphasis in the most recent results. We begin with a discussion of charm mixing and CP violation phenomenology, the evolution with the decay proper time, and physics processes contributing to these. Then we follow with the summary of the main experimental techniques and the results in the various final states. We make use of the analysis reporting the first evidence of - mixing by BaBar in decays as a textbook example, and then we discuss the results from other two-body and three-body final states. We conclude with the combination of all experimental results. Time-integrated CP violation measurements are not discussed here.
1. Introduction
Particle-antiparticle oscillation (also referred as mixing) is a well known phenomenon observed in the kaon system in 1956 [1], in the system in 1987 [2], and more recently in 2006 in the system [3]. Mixing and CP violation (CPV) in the charm sector were first discussed over three decades ago [4], but experimental evidence for oscillation has been presented only in the last two years [5, 6, 7, 8, 9, 10], and no evidence for CPV has yet been reported, with upper limits currently at about 1% level.
Charm mixing is the only involving down-type quarks in the mixing loop, since neutral pions do not oscillate and the top quark does not have bound states. Thus - mixing offers an unique probe for New Physics (NP) via flavor changing neutral currents (FCNC) in the down-quark sector, providing interesting constraints on NP models. The caveat is how to distinguish NP from Standard Model (SM) long-distance (non-perturbative) uncertainties. A possible avenue is correlating charm mixing studies (and possibly also rare charm decays) with a comprehensive account of CP violation in - mixing (both within the SM and beyond). The two effects are heavily suppressed in the SM (charm mixing is about two orders of magnitude slower than in the neutral-kaon system and CPV is well below the per mille level), which makes these experimentally difficult to observe, although NP can produce significant enhancements.
2. Charm mixing phenomenology
Neutral- mesons are created as flavor eigenstates of strong interactions, but they mix through weak interactions. The time evolution is obtained by solving the time-dependent Schrdinger equation,
| (1) |
with the effective Hamiltonian, where and are matrices that represent transitions via off-shell (dispersive) and on-shell (absorptive) intermediate states, respectively. Assuming CPT invariance, we have and . Since these matrices are Hermitian, and . If CP in mixing is conserved, and .
The physical (mass) eigenstates are linear combinations of the interaction eigenstates, [11], with time evolution , where are the eigenvalues. Here, () represent the mass (decay width) of the physical states. The complex mixing parameters and obey the normalization condition , and their ratio is
| (2) |
where is the CP-violating phase in - mixing.
The time-dependent amplitude for a or decaying into a final state after a time is
| (3) |
where and are the decay amplitudes at , and . The corresponding time evolution probability is [12, 13]
| (4) |
where
| , | |||||
| , | |||||
| (5) |
with the definitions
| (6) |
Here is the relative phase between and , and is the magnitude of the ratio between the two amplitudes. Mixing will occur either if or is non zero, while CP violation in mixing is signaled by , which can occur either if (CP violation in mixing) or (CP violation in the interference between mixing and decay). Direct CP violation is signaled by .
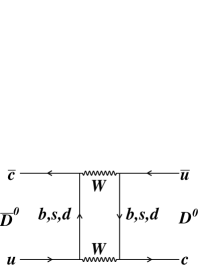
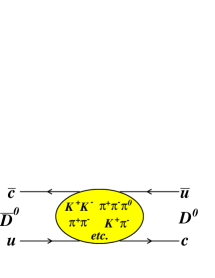
In the SM, - mixing arises from ( is the charm quantum number) short-range box diagrams (see Fig. 1.Left) containing down-type quarks, strongly suppressed either by small -quark couplings (CKM suppressed) or by the GIM cancellation mechanism [14] for the light - and -quarks. As a consequence, non-zero values for and are generated in the SM only at second order in breaking, , where is the Cabibbo angle and , , and are quark masses [15]. Lowest order calculations yield and , although enhancements due to higher orders in operator product expansion (OPE) up to have been calculated [16]. Models involving NP can greatly increase estimates for both and [17], but so can long-range SM processes with intermediate states accessible to and [18] (see Fig. 1.Right). While most studies find , some estimates for and allow for values as large as and suggest they are of opposite sign [19]. Overall, theoretical predictions for and within the SM span several orders of magnitude, reflecting the fact that these processes are difficult to calculate [13, 20].
However, it would be a sign of NP if were to be significantly larger than or if CPV either in mixing () or decay were observed [17] with current data samples. The observation of (large) CP violation as an unambiguous sign for NP is due to the fact that all quarks building up the hadronic states in weak decays of charm mesons belong to the first two generations. Since the Cabibbo quark-mixing matrix is real, no CP violation is possible at tree level, and only penguin or box diagrams induced by virtual -quarks can generate CP-violating amplitudes. However, as stated above, their contributions are strongly CKM suppressed.
 |
 |
3. Experimental methods
A generic - mixing analysis is performed in three steps. First, the (or ) flavor at production time () is identified (“tagged”) using decays [21]. These events are usually selected and characterized using the invariant mass of the exclusively reconstructed meson, , and the mass difference between the reconstructed and mesons, . The distribution of shows a narrow peak, due to the small -value of the decay. Other tools used to improve the event selection and reduce backgrounds are particle identification (for leptons, kaons or pions, depending on the final state) and cuts on (high) and soft pion (low) momentum. The charge of the soft pion from the decay unambiguously identifies the flavor at production. Then, the flavor at decay time is identified using the charge of the final state particles. For example, if the reconstructed final state is a positive kaon and a negative pion, and the soft pion from the decay has a negative charge, then we have a “Right sign (RS)” combination, . On the contrary, if the meson has been tagged as , then we have a “Wrong sign (WS)” combination, . When we have a tagged meson at production, a WS combination can occur either if the meson decays via a double-Cabibbo-suppressed (DCS) transition or if it oscillates into a meson followed by decay through a Cabibbo favored (CF) transition. Only a time-dependent analysis of the WS rate allows to distinguish between these two effects. Finally, the production and decay vertices of the meson are reconstructed in order to calculate the decay flight length and hence the decay proper time and its uncertainty . At B factories, restricting the production point to the luminous region of the collider (beam spot) greatly improves the precision on the decay time reconstruction, as well as on . At these facilities the average decay length is about 240 m, with typical resolution about 100 m (the latter depends on the specific reconstructed final state). Analyses usually apply quality cuts on the proper-time error, in order to reduce effects from wrongly reconstructed vertices.
The tagging can also be performed using coherent - production at charm factories running slightly above the - threshold, although in this case only time-integrated mixing related measurements are possible at present facilities [22]. On the other hand, some analyses can be performed using tagged or untagged samples, as it is the case of the lifetime differences between decays to CP eigenstates (like ) and to the CP-mixed state , as discussed later.
Four experimental techniques have been used to measure - mixing, depending on the specific final state: WS semileptonic decays, WS hadronic decays, decays to CP eigenstates, and self-conjugate three-body final states containing a combination of quasi-two body flavor and CP eigenstates, particularly . Quantum-correlated final states at charm factories are also sensitive to - mixing (mostly ) via time-integrated observables [22], although their sensitivity is not competitive with time-dependent measurements. These are however fundamental to provide information on magnitudes and phases of relevant amplitude ratios, as described later.
4. Wrong sign hadronic decays
Sensitivity to mixing using WS hadronic decays, for example , is obtained by analyzing their proper-time evolution. Time-dependent studies allow separation of the direct DCS amplitude from the mixing contribution followed by the CF decay, [12, 13]. Taking and assuming small mixing,
| (7) |
where represents the WS final state, is the ratio of DCS to CF decay rates, is the mixing rate, and , where is the relative strong phase between the DCS and CF decay amplitudes. The minus sign originates from the sign of relative to , where denotes the quark-mixing CKM matrix. In Eq. (7), the first term corresponds to the DCS contribution to the WS rate (time independent), the second term is the contribution from mixing, and the third term is the interference between mixing and CF decays. Since and are small, , it is precisely the interference term (linear in decay time, and ) which gives the best sensitivity to mixing through . Let us note that , with . However, a direct extraction of and from Eq. (7) is not possible due to the unknown relative phase .
Searches for charm mixing in WS decays have been performed by the experiments E971 (using events from interactions at 500 GeV) and FOCUS (from events from interactions), and by CLEO from 9 fb-1 of data [23]. However, the available statistics from these experiments was not enough to obtain evidence of mixing.
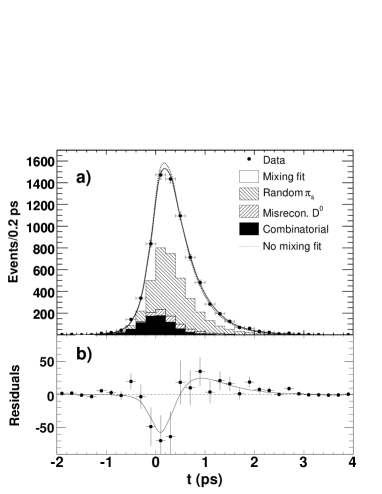
The first evidence for - mixing in WS decays has been reported by BaBar using 384 fb-1 of data [5]. The simultaneous fit to the RS and WS data samples to describe the signal and the random soft pion and misreconstructed background components yields and signal events, respectively. Thus the fraction of WS decays is measured to be . In the presence of mixing, , as can easily be obtained integrating Eq. (7).
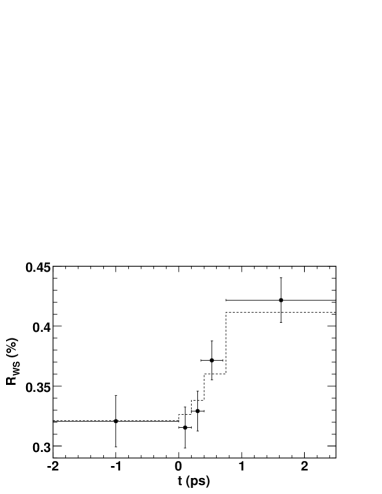
The measured proper-time distribution for the WS signal is modeled by Eq. (7) convolved with a resolution function determined using the RS proper-time fit. The proper-time distribution for WS data in the signal box is shown in Fig. 2., together with the fit results with and without mixing, shown as the overlaid curves. The mixing parameters are and , and a correlation between them of . The ratio of DCS to CF decay rates is measured to be . The systematic uncertainties are dominated by the signal resolution function as extracted from the RS sample. As expected, , revealing the presence of mixing. As another cross-check of the mixing signal, can also be measured in slices of proper time, repeating the fit to the RS and WS data samples in each of these slices. The fitted and expected WS fractions are shown in Fig. 3. and are seen to increase quadratically with time, as expected according to Eq. (7). The significance of the mixing signal is equivalent to or confidence level (CL), where denotes one standard deviation. Separate proper-time fits to and events allow to determine a CP-violating asymmetry , where is the ratio of DCS and CF decay rates for , thus no evidence for CP violation is observed.
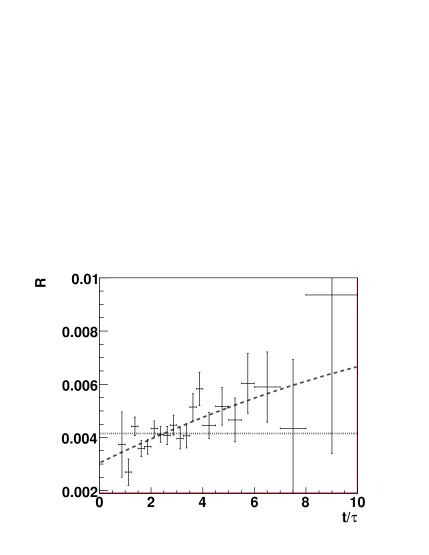
These results have been confirmed by the CDF experiment using a data sample of 1.5 fb-1 of interactions at TeV [7]. The analysis is similar to that from BaBar, although the different production environment makes the details to differ significantly. The time-integrated fit to the RS and WS data samples yield and signal events, respectively. The ratio of WS to RS decays as a function of the decay proper time in the range between and lifetimes shows again an approximately linear dependence, as observed in Fig. 4. The parabolic fit of the data in this figure returns , , and , where the errors include statistical and systematic uncertainties. The significance of the mixing signal is equivalent to ( CL). These results are essentially identical to those obtained by BaBar, in spite of the very different production environment and sources of systematic uncertainties.
An earlier search by Belle for mixing in this decay mode using 400 fb-1 of data did not yield clear evidence for mixing [24]. The time-integrated fit to the RS and WS data samples returns very similar yields as those obtained by BaBar, and signal events, respectively, from which . The time-dependent mixing fit yields , , and , where the errors include statistical and systematic uncertainties. The correlation between and is . The no-mixing hypothesis is excluded at ( CL). This result agrees with those obtained by BaBar and CDF at level. Separate proper-time fits to and events show no evidence for CP violation.
Quantum-correlated - pairs produced in decays at charm factories, with definite charge-conjugation eigenvalue , can be exploited to make a determination of the relative strong phase to translate the measurement of into [25]. At slightly higher energies (above threshold) one can also produce such pairs with (additional photons in the final state). One can use the fact that heavy-meson pairs produced in the decays of heavy-quarkonium states have the property that the two mesons are in CP- or flavor-correlated states [22]. For instance, one may tag one of the neutral- mesons as a CP eigenstate through its decay into CP eigenstates, such , , and . The other neutral- meson must then have opposite CP if and the same CP if . Then one measures its decay rate into , which includes, as discussed, an interference between CF and DCS amplitudes. The measured rate thus depends on the CF and DCS rates and the relative strong phase . More generally, one can measure time-integrated yields of correlated (“double tags”) and uncorrelated (“single tags”) neutral- meson decays to CP eigenstates (CP-even and CP-odd) and flavor eigenstates (semileptonic and hadronic decays, with leptons and/or kaons as final state particles). The ratio of correlated and uncorrelated decay rates depends on mixing parameters , , , , and . From 818 pb-1 of data recorded at (and at slightly higher energies) and using branching ratios from other experiments, CLEOc obtains [25]. The extraction of other mixing parameters is not competitive with time-dependent methods.
Further evidence for - mixing has been reported by BaBar using a time-dependent Dalitz plot analysis of the multi-body WS decay [10]. The analysis in such decays is formally similar to the WS , but now the decay rate is a function of both the decay proper time and the Dalitz plot variables and ,
| (8) |
where is the DCS amplitude, is the CF amplitude, and , with the relative strong phase between the DCS and CF amplitudes, now varying with the Dalitz plot position. As it can be seen in Eq. (4.), the sensitivity to mixing comes from the variation of the Dalitz plot distribution with time produced by the CF-mixing interference term, which in turn mainly depends on the interference between the CF and DCS amplitudes, since these decays dominate the RS and WS Dalitz plots, respectively.
BaBar determined the CF amplitude in a time-integrated Dalitz plot analysis of the RS decay sample, consisting of 658,986 events with a purity of 99%. This amplitude is then used in the analysis of the WS sample, containing 3009 events with a purity of 50%, where the DCS amplitude is extracted along with the mixing parameters. Each of the amplitudes and are in turn described as a coherent sum of amplitudes, each describing a separate resonance (the usual isobar approach). Figure 5. shows the RS and WS proper-time distributions as well as the projections on and . Since for both and one complex amplitude must be fixed arbitrarily and the CF and DCS Dalitz plots are different, the sensitivity to and is in the form and , where is the strong phase difference between the DCS and the CF amplitudes. This phase is unknown and different from . The measured mixing parameters are and , and a correlation between them of . The significance of the mixing signal is equivalent to ( CL). No evidence for CP violation is seen.
 |
 |
 |
 |
5. Hadronic decays to CP eigenstates
The lifetime difference between states of different CP content, for example (CP even) compared to (CP mixed), can also be used to measure - mixing. For small mixing and taking (for CP-even decays, since for CP) [12, 13],
| (9) |
where is the or effective lifetime, with . For untagged neutral- mesons,
| (10) |
where is the average and effective lifetime. We clearly observe that for , the lifetimes to CP eigenstates (, ) and CP mixed states () differ. The experimentally defined observables are
| (11) |
where and with is the mean lifetime for neutral- mesons decaying into CP eigenstates. The observable is the asymmetry in their lifetimes, sometimes replaced by . In the limit of vanishing CP violation , and (or ) is zero. Both and (or ) vanish if there is no - mixing. The measurement of requires precise determinations of lifetimes using either tagged or untagged neutral- mesons, but can only be measured using tagged and mesons. The advantage of these observables is that most of the systematic uncertainties related to the signal cancel in the ratios, although background related systematic uncertainties do not.
Searches for - mixing in hadronic decays to CP eigenstates have been done by the E971, FOCUS, and CLEO experiments [26]. However, the first evidence for charm mixing in these decays has been presented by Belle [6] simultaneously with the BaBar WS [5] evidence, and both constitute the chief analyses reporting the first evidences for - mixing (quickly confirmed by CDF [7]).
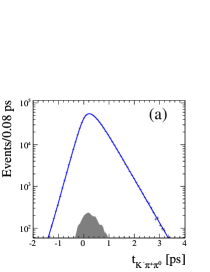
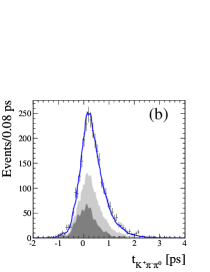
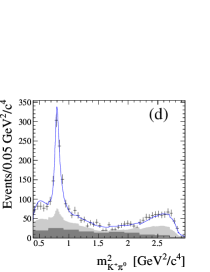
Using 540 fb-1 of data, Belle has measured employing the and final states (both CP-even), and found no evidence for CP violation in these decays since they obtained for the lifetime asymmetry [6]. The proper-time distribution for the samples, consisting of , , signal events with purities of 98%, 99%, 92%, are shown in Fig. 6.(a,b,c), respectively, together with the projection of the fit. The CL of the no-mixing hypothesis () is , which corresponds to a significance of . The mixing effect can be seen in Fig. 6.(d), which shows the ratio of decay-time distributions for and decays, increasing linearly with time, as expected according to Eq. (10) to first order in , .

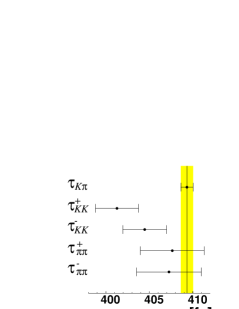
A very similar study has also been performed by BaBar using 384 fb-1 of data, yielding and [8]. These results are obtained fitting simultaneously the proper-time distributions for the tagged , , and samples, consisting of , and signal events with purities of 99.6%, 98.0%, 99.9%. The significance of the no-mixing hypothesis is of , reflecting the significance of the difference of lifetimes between , and , as summarized in Fig. 7.
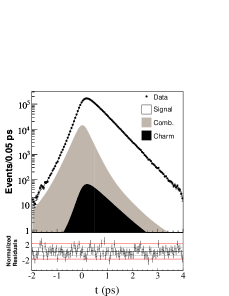
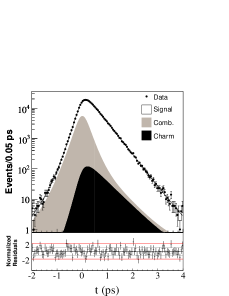
Recently, BaBar has presented an untagged analysis using the same data sample of 384 fb-1 [9]. The proper-time distributions for the untagged and samples are shown in Fig. 8., together with the projection of the simultaneous fit to these samples. In this case, the samples contain and signal events with purities of 94.2% and 80.9%, for and respectively. The measured lifetimes are fs and fs, yielding , which excludes no-mixing with . In this analysis, since the initial flavor of the decaying does not need to be identified, no reconstruction is required, increasing significantly the reconstruction efficiency but increasing the amount of background. To minimize it, the lifetime fit is performed in a narrow mass region around the nominal mass. The proper-time distribution for the main background component (combinatorial) is estimated from sideband mass regions, while for the small admixture of misreconstructed charm decays it is obtained from the simulation. Combining the tagged and untagged results taking into account both statistical and systematic uncertainties, BaBar finds . Summing statistical and systematic uncertainties in quadrature, the significance of this measurement is .
 |
 |
Yet another lifetime-difference analysis uses the final state, where the region and its sidebands are examined to extract CP-odd and CP-even amplitudes. This is in effect a measurement of the lifetime in the CP-even and CP-odd parts of the Dalitz plot. Using 673 fb-1, Belle has measured [27]. This is done by measuring the mean lifetime in the region (mainly CP-odd) and the mean lifetime in the sidebands (mainly CP-even), along with the corresponding fractions and of CP-even events in these regions. The lifetime asymmetry in these regions can then be related to ,
| (12) |
from which relation the latter is then determined. The main systematic uncertainties in this analysis come from ON-OFF differences in the proper-time resolution function and the selection criteria, while the uncertainty from the Dalitz model assumptions needed to evaluate the CP-even content is negligible ().
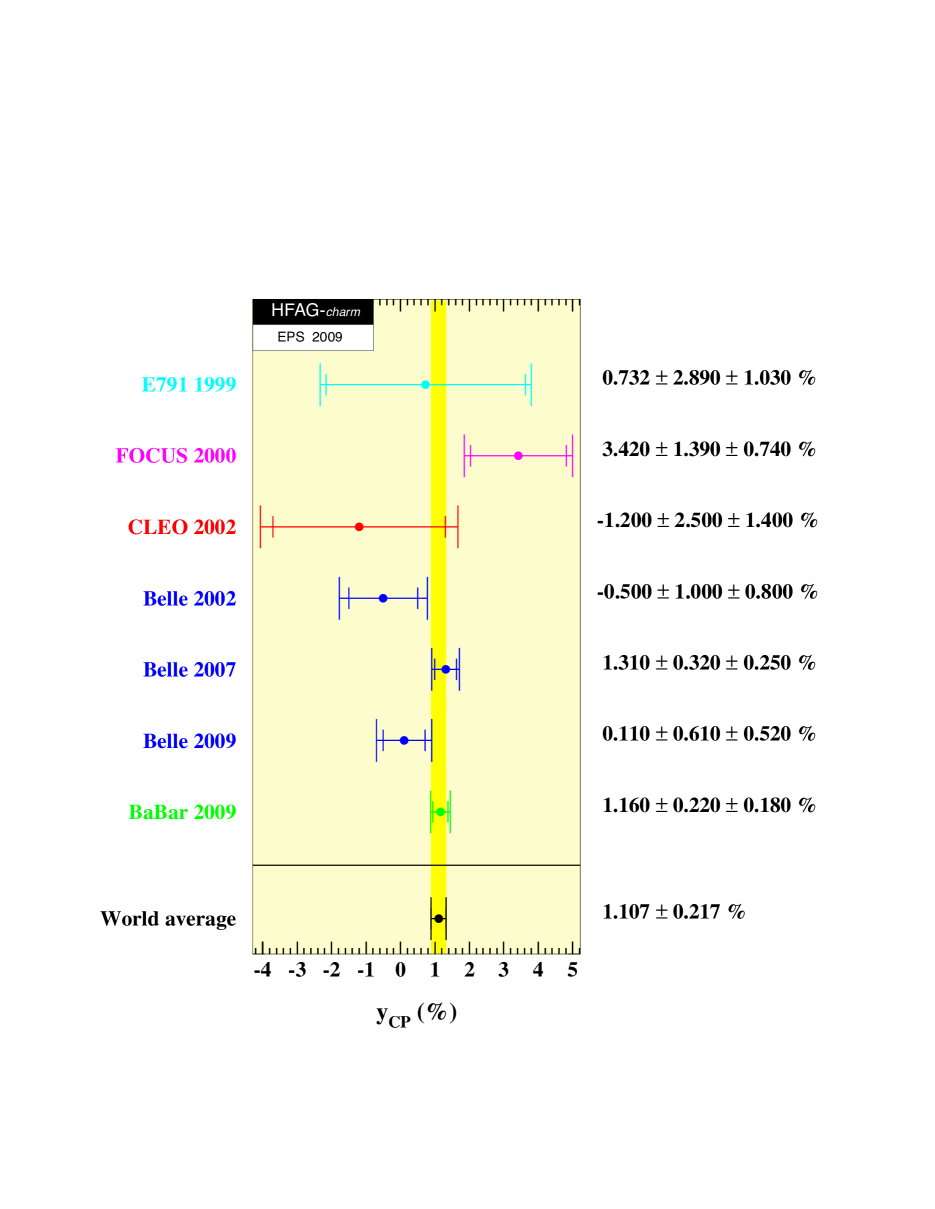
Figure 9. summarizes all the available results. The combination of all these measurements is performed by the Heavy Flavor Averaging Group (HFAG) [28], and yields , which differs significantly (about ) from zero. The combined lifetime asymmetry is , thus there is no evidence for CPV.
6. decays
The last employed technique to study - mixing involves the multi-body final state . As in the case of the WS analysis, the decay rate is a function of both the Dalitz plot variables and , and the decay proper time. With the usual approximations,
| (13) | |||
with , where is the relative strong phase between the and decay amplitudes to the same final state . Here, and contrary to the WS case, the strong phase is fixed by the fact that the and Dalitz plots are identical (the and axes are just interchanged), assuming CP is not violated in the decay. Thus the analysis is free of unknown phases, providing an unique method to simultaneously measure the interfering and amplitudes, the mixing parameters and (without rotations, and also their signs), and even the CP-violating parameters and .
The CLEO experiment pioneered this analysis using only 9 fb-1 of data [29], obtaining the constraints and at 95% CL. Using 60 times more data, Belle has also performed this analysis [30], first assuming CP conservation and subsequently allowing for CP violation. The amplitudes and are described using a coherent sum of 18 amplitudes, dominated by CF , DCS and CP decays. Assuming negligible CP violation, and . This corresponds to a significance of from the no-mixing hypothesis. Figure 10. shows both the statistical-only and overall contours for both the CPV-allowed and the CP-conservation cases. No evidence for CP violation is found.

7. Wrong sign semileptonic decays
The most straightforward although not the most sensitive way to search for charm mixing is to use WS semileptonic decays, for instance [31, 32, 33]. In this case WS combinations can only occur through mixing,
| (14) |
Therefore, these final states are only sensitive to . Using semileptonic decays for mixing searches involves the measurement of the time-dependent or time-integrated rate for the WS decays. The main experimental challenge in these analyses is the limited mass resolution on due to the presence of neutrinos. Significant improvements on resolution are obtained applying kinematic constraints on the invariant mass of the neutrino and the kaon-lepton-neutrino system. The best current limits are from BaBar, [32], and Belle, [33], both at 90% CL, using 344 fb-1 and 492 fb-1 of data, respectively.
8. Combined results
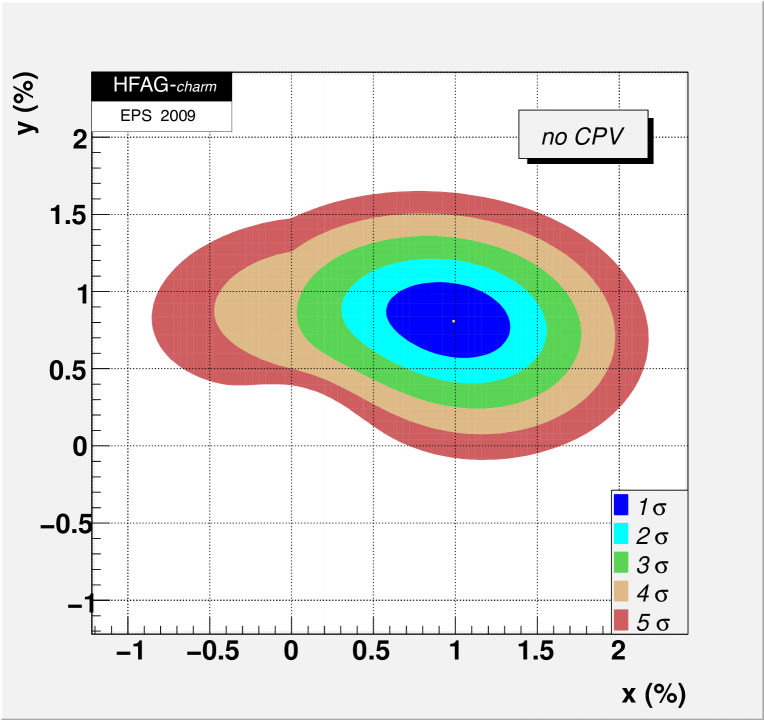
The task of combining the wide variety of charm mixing results is done by the HFAG [28]. Figure 11. shows the contours of the collective experimental data, for the case of CP conservation. The central values and exclude the no-mixing point with . Other relevant combined parameters are , rad, and rad. When CP violation is allowed, the mixing parameters remain basically unchanged, , , , rad, and rad, and the following values for the CP-violating parameters are obtained: , rad, and .
9. Summary and conclusions
More than thirty years after the discovery of the meson [34] and the first theoretical discussion on mixing and CPV in the charm sector [4], BaBar, Belle and CDF Collaborations have provided compelling experimental evidence for - mixing. Collective experimental data favor the mixing hypothesis at level (including systematic uncertainties). The mixing measurement from lifetime differences is significantly positive (about ), indicating that the eigenstate ( CP-even) has a shorter lifetime than the eigenstate ( CP-odd).
However, no observation (more than ) in a single measurement has yet been presented. In addition, to date there is only one direct measurement (from decays) of and free of rotations (thus the only indication of the and relative sign), which do not differ significantly from zero but do affect the combination of all mixing measurements due to the large uncertainties that arise from the unknown phases that are inherent in other determinations. This is especially true for . Clearly, more such measurements are a high priority and are foreseen in the future.
The measured values of the mixing parameters are about compatible with SM expectations, although with large theoretical uncertainties. There is no evidence for CP violation in mesons, either in mixing, in decay or in interference.
Significant improvements in precision are foreseen in the short term with the analysis of complete data sets from current facilities (B factories and Tevatron). In the long term, facilities about to start or just starting (LHCb and BESIII) have the potential to improve the precision on the mixing parameters in about a factor 5 and look deeper into CP violation searches. In the longer term, SuperB factories could be the last opportunity to observe CP violation in - mixing [35] and search for NP in FCNC in the down-quark sector.
10. Acknowledgements
I would like to thank the organizers of PIC2009 for the invitation to give this review and for having set the atmosphere for such interesting meeting.
I am grateful to my colleagues of the BaBar Collaborartion who helped preparing this talk and proceedings, with special thanks to Nicola Neri.
Bibliography
- [1] K. Lande et al., Phys. Rev. 103, 1901 (1956).
- [2] C. Albajar et al. (UA1 Collaboration), Phys. Lett. B 186, 247 (1987); H. Albrecht et al. (ARGUS Collaboration), Phys. Lett. B 192, 245 (1987).
- [3] A. Abulencia et al. (CDF Collaboration), Phys. Rev. Lett. 97, 242003 (2006).
- [4] A. Pais and S.B. Treiman, Phys. Rev. D 12, 2744 (1975).
- [5] B. Aubert et al. (BaBar Collaboration), Phys. Rev. Lett. 98, 211802 (2007).
- [6] M. Staric et al. (Belle Collaboration), Phys. Rev. Lett. 98, 211803 (2007).
- [7] T. Aaltonen et al. (CDF Collaboration), Phys. Rev. Lett. 100, 121802 (2008).
- [8] B. Aubert et al. (BaBar Collaboration), Phys. Rev. D 78, 011105(R) (2008).
- [9] B. Aubert et al. (BaBar Collaboration), preprint arXiv:0908.0761 [hep-ex]. Submitted to Phys. Rev. D(RC).
- [10] B. Aubert et al. (BaBar Collaboration), preprint arXiv:0807.4544 [hep-ex]. Submitted to Phys. Rev. Lett.
- [11] The phase convention is chosen so that and .
- [12] Z.-Z. Xing, Phys. Rev. D 55, 1 (1997); S. Bergmann, Y. Grossman, Z. Ligeti, Y. Nir and A.A. Petrov, Phys. Lett. B 486, 418 (2000); Y. Nir, JHEP 0705, 102 (2007).
- [13] S. Bianco, F.L. Fabbri, D. Benson and I. Bigi, Rivs. Nuovo Cim. 26N7, 1 (2003).
- [14] S.L. Glashow, J. Iliopoulos and L. Maiani, Phys. Rev. D 2, 1285 (1970).
- [15] A.F. Falk, Y. Grossman, Z. Ligeti and A.A. Petrov, Phys. Rev. D 65, 054034 (2002).
- [16] H. Georgi, Phys. Lett. B 297, 353 (1992); I. Bigi and N.G. Ultrasev, Nucl. Phys. B 592, 92 (2001).
- [17] A.A. Petrov, Phys. Rev. D 69, 111901 (2004); Int. J.. Mod. A 21, 5686 (2006); E. Golowich, J. Hewett, S. Pakvasa and A.A. Petrov, Phys. Rev. D 76, 095009 (2007); E. Golowich, S. Pakvasa and A.A. Petrov, Phys. Rev. Lett. 98, 181801 (2007); Y. Grossman, A.L. Kagan, Y. Nir, Phys. Rev. D 75, 036008 (2007); A.A. Petrov, G.K. Yeghiyan, Phys. Rev. D 77, 034018 (2008); I. Bigi, M. Blanke, A. Buras and S. Recksiegel, preprint arXiv:0904.1545 [hep-ph] (2009).
- [18] L. Wolfenstein, Phys. Lett. B 164, 170 (1985); J.F. Donoghue, E. Golowich, B.R. Holstein and J. Trampetic, Phys. Rev. D 33, 179 (1986); P.Colangelo, G. Nardulli and N. Paver, Phys. Lett. B 242, 71 (1990); T.A. Kaeding, Phys. Lett. B 357, 151 (1995).
- [19] A.F. Falk, Y. Grossman, Z. Ligeti, Y. Nir and A.A. Petrov, Phys. Rev. D 69, 114021 (2004).
- [20] G. Burdman and I. Shipsey, Ann. Rev. Nucl. Part. Sci. 53, 431 (2003).
- [21] Reference to the charge-conjugate state is implied here and throughout the text unless otherwise stated.
- [22] M. Gronau, Y. Grossman, J.L. Rosner, Phys. Lett. B 508, 37 (2001); D.M. Asner and W.M. Sun, Phys. Rev. D 73, 034024 (2006).
- [23] E.M. Aitala et al. (E791 Collaboration), Phys. Rev. D 57, 13 (1998); J.M. Link et al. (FOCUS Collaboration), Phys. Lett. B 618, 23 (2005); R. Godang et al. (CLEO Collaboration), Phys. Rev. Lett. 84, 5038 (2000).
- [24] L.M. Zhang et al. (Belle Collaboration), Phys. Rev. Lett. 96, 151801 (2006).
- [25] D.M. Asner et al. (CLEOc Collaboration), Phys. Rev. D 78, 012001 (2008); J.L. Rosner et al. (CLEOc Collaboration), Phys. Rev. Lett. 100, 221801 (2008).
- [26] E.M. Aitala et al. (E791 Collaboration), Phys. Rev. Lett. 83, 32 (1999); J.M. Link et al. (FOCUS Collaboration), Phys. Lett. B 485, 62 (2000); S.E. Csorna et al. (CLEO Collaboration), Phys. Rev. D 65, 092001 (2002).
- [27] A. Zupanc et al. (Belle Collaboration), Phys. Rev. D 80, 052006 (2009).
- [28] E. Barbeiro et al. (Heavy Flavor Averaging Group), Averages of b-hadron and c-hadron Properties at the End of 2007, preprint arXiv:0808.1297 [hep-ex] (2008). Updated results are available at http://www.slac.stanford.edu/xorg/hfag/charm/EPS09/.
- [29] D.M. Asner et al. (CLEO Collaboration), Phys. Rev. D 72, 012001 (2005).
- [30] L.M. Zhang et al. (Belle Collaboration), Phys. Rev. Lett. 99, 131803 (2007).
- [31] E.M. Aitala et al. (E791 Collaboration), Phys. Rev. Lett. 77, 2384 (1996); C. Cawlfield et al. (CLEO Collaboration), Phys. Rev. D 71, 077101 (2005).
- [32] B. Aubert et al. (BaBar Collaboration), Phys. Rev. D 76, 014018 (2007).
- [33] U. Bitenc et al. (Belle Collaboration), Phys. Rev. D 77, 112003 (2008).
- [34] G. Goldhaber et al., Phys. Rev. Lett. 37, 255 (1976).
- [35] D.G. Hitlin et al., Proceedings of SuperB Workshop 6: New Physics at the Super Flavor Factory, preprint arXiv:0810.1312 [hep-ph] (2008).