How Universal are the Young Cluster Sequences?
- the Cases of LMC,
SMC, M83 and the Antennae
Abstract
Aims. Recently a new analysis of cluster observations in the Milky Way found evidence that clustered star formation may work under tight constraints with respect to cluster size and density, implying the presence of just two sequences of young massive cluster. These two types of clusters each expand at different rates with cluster age.
Methods. Here we investigate whether similar sequences exist in other nearby galaxies.
Results. We find that while for the extragalactic young stellar clusters the overall trend in the cluster-density scaling is quite comparable to the relation obtained for Galactic clusters, there are also possible difference. For the LMC and SMC clusters the densities are below the Galactic data points and/or the core radii are smaller than those of data points with comparable density. For M83 and the Antenna clusters the core radii are possibly comparable to the Galactic clusters but it is not clear whether they exhibit similar expansion speeds. These findings should serve as an incentive to perform more systematic observations and analysis to answer the question of a possible similarity between young galactic and extragalactic star clusters sequences.
Key Words.:
Local Group, Magellanic Clouds, open clusters and associations, Galaxy: structure1 Introduction
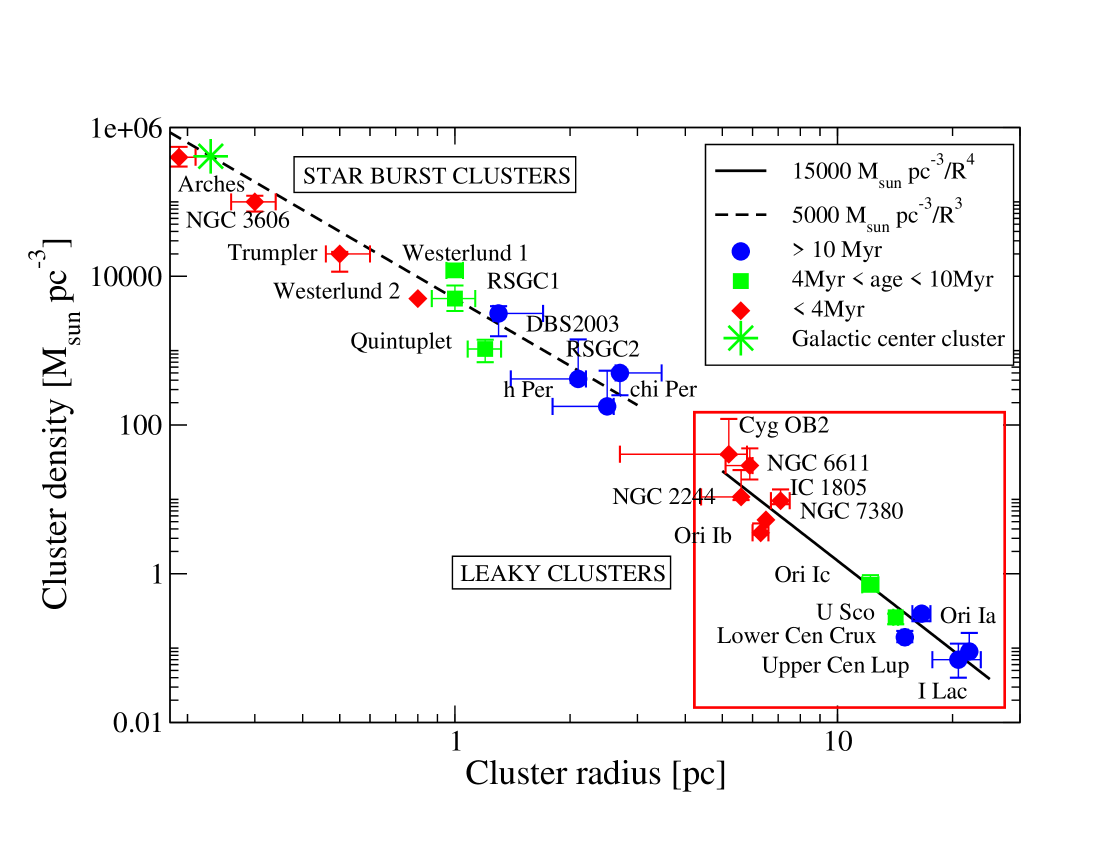
Lada & Lada (2003) showed that in our Galaxy most stars do not form in isolation but in cluster environments. These young clusters typically consist of thousand stars or more with densities ranging from 0.01 to several 105 M⊙pc-3 The wide variety of observed cluster densities lead to the assumption that clusters are formed over this entire density range. Albeit Maiz-Apellaniz (2001) noticed the existance of two types of clusters in the Galaxy, only recently Pfalzner (2009) found that massive clusters develop in a bimodal way as in Fig.1, where the red, green and blue symbols represent clusters with ages 4 Myr, 4 Myr 10 Myr, 10 Myr 20 Myr, respectively. Two well-defined sequences in the density-radius plane emerge showing the bi-modal nature of the cluster evolution.
Pfalzner (2009) classified the two modes as starburst and leaky cluster sequences. The starburst cluster sequence implies a population of compact clusters (0.1 pc) with high initial densities (105 - 106 M⊙pc-3) which then expand with the mass-density decreasing as (an actual -fit gives a -dependence with =-2.71 0.32) and evolve to have sizes of a few pc over a period of 10 Myr or longer. Prominent members of this type of cluster are for example Arches, NGC 3603 and Westerlund 1. The leaky cluster sequence implies the creation of a second population of diffuse clusters ( 5pc) which expand loosing mass during the process, until they have sizes of a few tens of pc. The expansion also follows a predefined track, but here the density decreases as (actual fit value 4.07). Here NGC 6611, Ori 1a-c or U Sco are typical examples. Note, the cluster radii were not determined exactly the same way for all clusters shown in Fig. 1. However, star burst cluster values all represent the core radii apart from Per and h Per (for a discussion on the determination of these two radii see Pfalzner 2009).
It follows that star formation occurs only under an extremely limited set of conditions, and may require a fundamental revision of star formation hypotheses in our Galaxy. This immediately raises the questions of the origin of these two distinct cluster sequences and whether similar density-radius correlations could be found in other galaxies. This Letter addresses the latter question.
Most extragalactic clusters one observes are likely to belong to the starburst cluster sequence because although their extension is on average smaller the luminosity of their high number of O-stars is much easier to detect than the smaller number of O stars spreading over a larger area in leaky clusters. So in all figures subsequent to Fig. 1 only the starburst clusters of the Galaxy are shown for comparison and the radial extent is the core radius.
| Galaxy | radius determination | mass determination | background | age determination |
|---|---|---|---|---|
| LMC1 | King profile fit | from mass/light ratio from | mean surface brightness | combination of IMF 8 |
| half-surface brightness | evolutionary code5 | in annulus at r | and evolutionary code5 | |
| SMC2 | King profile fit | from mass/light ratio from | mean surface brightness | Based on color-magnitude |
| half-surface brightness | evolutionary code5 | in annulus at r | diagram12 | |
| Antennae3 | Fit with ISHAPE code6 | UBVI-colors and mass/light | Fit with ISHAPE code | LICK line strength indices |
| ratio7 with extinction- | and 11 | |||
| corrected SSP | ||||
| M 834 | Fit with ISHAPE code6 | Isochromes9 | Fit with ISHAPE code | UVBI-colors, 2-color and |
| S-sequnce diagram 10 |
Currently the Milky Way is not in a intense star formation phase accounting for the scarcity of starburst clusters in the Galaxy. Another reason is that extinction at low latitudes hampers the detection of distant Galactic clusters. By contrast, there are starburst and interacting galaxies such as the ”Antennae”, where many clusters with masses 104 M⊙ are observed with ages 1Gyr (Zhang & Fall 1999). In between, there exist the dwarf starburst galaxies such as NGC 4214, where several massive clusters with ages 100 Myr are visible in the central regions.
This Letter shows a first investigation of whether similar development tracks can be found for clusters in such different galaxies. Observationally one is restricted to nearby galaxies, and even there radii are only resolved for a very limited sample. Here we scanned the literature for clusters younger than 30 Myr in the Large Magellanic Cloud (LMC), Small Magellanic Cloud (SMC), Messier 83 (M83) and the Antennae.
2 Limitations
Comparing clusters in the Milky Way with extragalactic clusters intrinsically has its limitations. Especially age dating differs in both cases - whereas for Milky Way clusters ages can be based on individual stars, in distant clusters they are determined from integrated colors. Even more complex is the comparison of radii as there exist different definitions resulting in various measurement methds. In addition, effects of the different spatial resolutions, background and used photometric bandpasses can strongly influence the results. In general we compare here the core radii of the different clusters (Note Fig.1 contains partly different definitions of radii, for a discussion see Pfalzner 2009). Ideally one would use the same age, mass and radii determination techniques for all investigated clusters. However, unfortunately for most of the clusters no public data are available, so that in the following literature data were used. Table 1 lists for each of the investigated galaxies the methods used for age, mass, radius and background determination.
3 Magellanic Clouds
Since the LMC and SMC are at distances of ≃ 50 kpc and 60 kpc Schaefer (2008), respectively, their system of star clusters can be studied in much more detail than those of more distant hosts. Compared to the Galaxy, the Magellanic Clouds are gas rich and metal poor, thus providing a different environment where stars form and evolve.
3.1 LMC
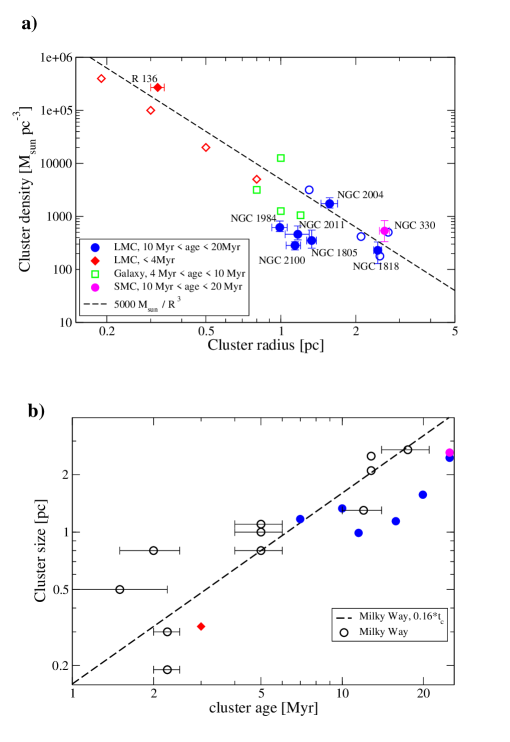
Rich clusters in the LMC span a wide range in ages, 6 . Most clusters younger than 3 Gyr have metalicities between 1/2 and 1/3 of the solar values Santiago (2008). Although thousands of clusters are known in the LMC, only a few fulfill the specific conditions of our study, i.e. cluster age 20 Myr with known mass and radial extent. Fig. 2a) shows the density as function of cluster radius for LMC clusters. The data are taken from Maykey & Gilmore (2003) and compared to the starburst cluster sequence of the Galaxy. Most of the LMC cluster data points lay below those of the Galaxy. The same applies comparing the cluster age to cluster radius (see Fig. 2b).
3.2 SMC
The Small Magellanic Cloud (SMC) is the closest star forming dwarf galaxy ( 60 kpc). Its present day metalicity (Z=0.004) and low dust content (30 times smaller than in the Milky Way) make the SMC an prototype late type dwarf. At such low metalicity one expects that the resulting reduced stellar wind can modify the early evolution of clusters as the powerful winds characteristic of systems of solar metalicities do not exist and therefore might not be able to remove the gas left from star formation. Unfortunately we found only one cluster younger than 30 Myr with known density and radius. It lies a bit above the Galactic star cluster track (see Fig. 2)a.
3.3 Discussion
The very limited data available for the LMC and SMC give a first indication of a similar sequential track for the LMC and SMC as in the Galaxy possibly at lower density values for the LMC. One possible reason for such a lower track could be the lower metalicities in the LMC system (Cepheid metalicities of Z=0.0091+/-0.0007 and 0.0050+/-0.0005 for the LMC and SMC, respectively, compared to Z=Z⊙ 0.02; Keller & Wood, 2006). The lower metalicities may result in a larger Jeans mass and therefore larger initial mass limit in general (Clark & Bromm 2002). At the same mass lower metalicity stars are more luminous (e.g. Bertelli et al. 2008). Hence, including the effect of mass segregation, the centers of low metalicity star clusters may be overluminous compared to higher metalicity clusters, resulting underestimating their sizes. However, It is unclear whether this effect is strong enough to result in the observed difference in the size measurements.
The uncertainties in the distance modulus of the LMC (LMC: 18.54+/-0.018; SMC: 18.93+/-0.024; Keller & Wood, 2006) is small and cannot be responsible for the entire size discrepancy. The clusters are seen against the stellar background of the LMC/SMC. This may result in an underestimation of the contribution of the more extended off center stellar cluster brightness distribution that is not dominated by luminous stars. This effect will lead to an underestimation of the cluster size.
4 The Antennae
The Antennae are the nearest and best-studied pair of merging galaxies, consisting of two large spirals that began to collide a few × 108 yr ago. The ongoing merger is almost certainly responsible for the large population of clusters. Understanding the formation and disruption of clusters in this setting is important because it represents a latter-day example of the hierarchical formation of galaxies, a process that operated even more effectively in the early universe. Fall et al. (2005) find a steep decline in the number of cluster as a function of age and interpret as a sign of intensive disruption of the clusters. They conclude that the short timescale on which the clusters are disrupted indicates that most of them are not gravitationally bound. So the Antennae seem to show a high rate of “infant mortality” similar to the Milky Way. As the clusters are initially disrupted mainly by internal processes, they expect the age distribution to be largely independent of the properties of the host galaxy.
As only values of the effective radii (half-light radii) are given for the Antennae clusters in Fig. 3 core radii were derived assuming a factor of 3 difference between and as deduced for globular clustersSchweizer (2004). Whether this relation holds as well for young clusters is uncertain. The so deduced core radii fit quite well onto the Galactic starburst cluster sequence, but in general the ages of the clusters are younger than that of equivalent Galactic starburst clusters.
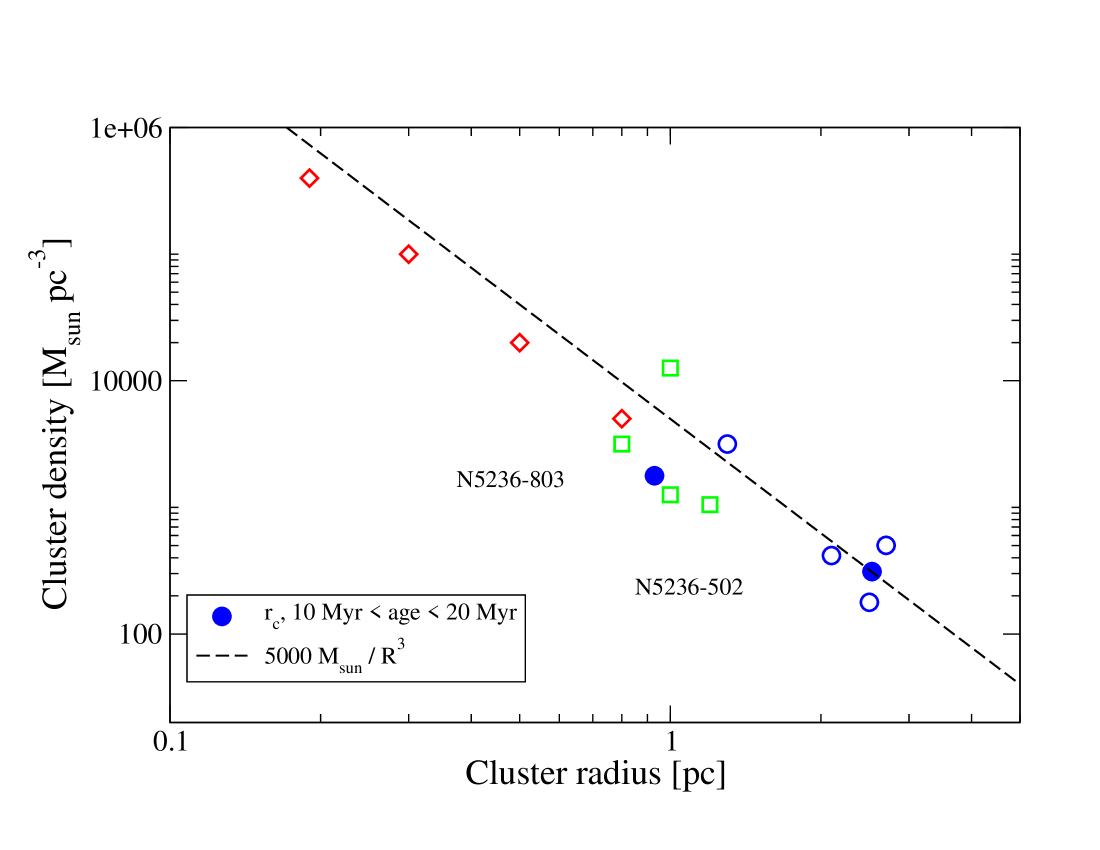
5 M83
The nearby spiral galaxy M83 is known to have a rich population of relatively young clusters, most likely due to its high star formation rate. Using the cluster data by Larsen & Richtler (2004) Fig. 4 shows the cluster density as a function of the effective radius. Like for the Antennae galaxy we deduced the core radii by assuming a factor of 3 difference between and as deduced for globular clustersSchweizer (2004). The so obtained data lie on the galactic starburst cluster sequence.
6 Conclusion
For the extragalactic young stellar clusters the overall trend in the cluster radius versus cluster density relation seems to fit the relation obtained for Galactic starburst clusters by Pfalzner (2009). A possible difference is indicated for the LMC clusters, where the densities are mostly below the comparable Galactic data at equal radius, or the radii are smaller than those of data points with comparable density. This might indicates that the sizes for LMC clusters are systematically smaller than the Galactic cluster sizes. This could be explained by intrinsic observational effects.
However, the sample size of extragalactic young clusters ( 20 Myr ) with known radii and masses is so small that this investigation can only be regarded as a first hint that the young starburst cluster sequence might also exist in galaxies other than the Milky way. In this study only literature values of age, mass and radius were used mostly obtained by different methods. Further studies with a larger sample size and more homogenous data acquisition will be required to confirm this result.
References
- Anders (2003) Anders, P., Fritz-von-Alvensleben, U. 2003 A&A 401, 1063.
- Bastian et al. (2009) Bastian, N., Trancho, G., Konstantopoulos, I., Miller, B. 2009, astro-ph 0906.2210.
- Bertelli et al. (2008) Bertelli, G., Girardi, L., Marigo, P., Nasi, E. 2008, A&A 484, 815.
- Bromm & Clarke (2002) Bromm, V. & Clarke, C. 2002 ApJ 566, L1.
- Chiosi (1995) Chiosi, C. Vallenari, A., Bressan, A., Deng, L., Ortolani, S. 1995 A&A 293, 710.
- Fall et al. (2005) Fall, S. M., Chandar, R., Whitmore, B. C., 2005, ApJ 631, L133.
- Fioc & Rocca-Volmerange (1997) Fioc, M. & Rocca-Volmerange, B. 1997, A&A, 326, 950.
- Gieles & Bastian (2008) Gieles, M., Bastian, N., 2008, A&A 482, 165.
- Girardi et al. (1995) Girardi, L., Chiosi, C., Bertelli, G.A. 1995, A&A 298, 87.
- Girardi et al. (2000) Girardi, Bressan, A., Bertelli, G.A., Chiosi, C. 2000, A&AS 141, 371.
- Keller & Wood (2006) Keller, S. C. & Wood, P. R., 2006, ApJ 642, 834.
- Kroupa et al. (1993) Kroupa, P., Tout, C. A. & Gilmore, G. F. 1993, MNRAS 262, 545.
- Larsen & Richtler (1999) Larsen, S. S. & Richtler, T. 1999, A&A 345, 59.
- Larsen & Richtler (2004) Larsen, S. S. & Richtler, T. 2004, A&A 427, 495.
- (15) Mackey, A.D. & Gilmore, G.F. 2003, MNRAS, 338, 85.
- (16) Mackey, A.D. & Gilmore, G.F. 2003, MNRAS, 338, 120.
- Maiz-Apellaniz (2001) Maiz-Apellaniz, J., 2001, ApJ 563, 151.
- McLaughlin & van der Marel (2005) McLaughlin & van der Marel 2005 ApJS 161 304.
- Mengel et al. (2008) Mengel, S., Lehnert, M.D., Thatte, N.A., Vacca, W.D., Whitmore, B., Chandar, 2008, å, 489, 1091.
- Mengel et al. (2005) Mengel, S., Lehnert, M. D., Thatte, N., Genzel, R., 2005, A&A 443, 41.
- Pfalzner (2009) Pfalzner, S. 2009, A&A 498, L37.
- Santiago (2008) Santiago, B., In The Magellanic System: Stars, gas and galaxies, ed. van Loon, J. & Oliveira, J., Proceed. IAU 256, (2008)
- Schaefer (2008) Schaefer, B., 2008, AJ 135, 112.
- Schweizer (2004) Schweizer, F. 2004 in Proc. of Formation and Evolution of Massive Young Star Clusters ASP Conference Ser., eds. H. Lamers, A. Nota & l.J. Smith
7 Online material
| Identifier | log(age) | age | radius | radius | log | |||
|---|---|---|---|---|---|---|---|---|
| [Myr] | [pc] | [M⊙] | [M⊙/pc-3] | |||||
| NGC 18051 | 7.0 | 0.3 | 1.33 | 0.06 | 3.52 | 0.13 | 2.54 | 0.2 |
| NGC 18181 | 7.4 | 0.3 | 2.45 | 0.09 | 4.13 | 0.15 | 2.35 | 0.2 |
| NGC 19841 | 7.06 | 0.3 | 0.99 | 0.07 | 3.38 | 0.24 | 2.79 | 0.2 |
| NGC 2004 1 | 7.30 | 0.2 | 1.57 | 0.13 | 4.43 | 0.38 | 2.32 | 0.2 |
| NGC 20111 | 6.99 | 0.3 | 1.17 | 0.12 | 3.47 | 0.14 | 3.24 | 0.12 |
| NGC 21002 | 7.20 | 0.3 | 1.14 | 0.14 | 4.43 | 0.13 | 3.05 | 0.2 |
| R 1361 | 6.48 | 0.18 | 0.32 | 0.02 | 4.55 | 0.21 | 4.47 | 0.08 |
| Identifier | log(age) | age | radius | radius | log | |||
|---|---|---|---|---|---|---|---|---|
| [Myr] | [pc] | [M⊙] | [M⊙/pc-3] | |||||
| NGC 330 | 7.4 | 0.4 | 2.61 | 0.12 | 4.58 | 0.2 | 2.72 | 0.2 |
| Identifier | log(age) [Myr] | radius [pc] | log(mass) [M⊙] | log [M⊙/pc-3] | |
|---|---|---|---|---|---|
| T54 | 6.9 0.1 | 3.7 | 4.8 0.3 | 2.49 | |
| T 270 | 6.8 | 9.3 | 5.4 0.3 | 1.89 | |
| T 324 | 6.5 - 6.8 | 7.7 | 5.2 0.3 | 2.54 | |
| T 343 | 6.5 - 6.8 | 8.8 | 5.4 0.3 | 1.96 | |
| T 365 | 6.5 - 6.8 | 4.3 | 5.3 0.3 | 2.80 | |
| T 367 | 6.5 -6.8 | 6.6 | 5.2 0.3 | 2.14 |
| Identifier | log(age) [Myr] | [pc] | log(mass) [M⊙] | log [M⊙/pc-3] |
|---|---|---|---|---|
| N5236-502 | 8.0 0.1 | 7.6 1.1 | 5.15 0.83 | 2.8 1.0 103 |
| N5236-805 | 7.1 0.2 | 2.8 0.4 | 4.16 0.67 | 1.6 1.1 104 |