also: ] Institut für Angewandte Physik, Universität Karlsruhe, 76128 Karlsruhe, Germany
Optically induced softening of the charge-transfer gap in Sr2CuO2Cl2
Abstract
Energy- and time-resolved spectroscopy reveals a photoinduced softening of the charge-transfer gap in the insulating copper oxide Sr2CuO2Cl2 that indicates rapid and efficient photoproduction of optical phonons. By relating the pump-probe signal amplitude to the thermal difference spectrum, we estimate that eleven to twenty optical phonons are created for every one 3 eV photon. Assuming relaxation to the optical absorption edge at 1.5 eV, this corresponds to 70–130 meV per boson. While the lower limit is consistent with relaxation exclusively through optical phonons, the upper limit suggests a significant role for magnetic excitations. We observe a photoinduced bleaching of the gap excitation that we associate with phase space filling, and estimate the excluded area of the photoexcited state to be about nine copper oxide plaquettes. The temporal decay of the pump-probe signal is consistent with anharmonic phonon decay.
pacs:
71.27.+a,78.47.jc,71.38.-k,74.72.-hI Introduction
When a semiconductor is optically excited above the band gap, the carriers relax to the band edges by emitting a cascade of optical phonons on a picosecond timescale; the resulting nonequilibrium phonon population then relaxes by anharmonic processes over a few picoseconds.von der Linde (1988); Shah (1999) Time-resolved spectroscopy played an essential role in characterizing this process,von der Linde (1988); Shah (1999) and it is now being applied successfully in research on more complex solids.Averitt and Taylor (2002); Rini et al. (2007); Hendry et al. (2007) The optical excitations of insulating magnetic oxides are an important frontier of this research.
Understanding the elementary excitation spectrum of magnetic insulators has been a central concern in condensed matter physics for over half a century, and there is widespread consensus that high-temperature superconductivity is intimately related to the physics of the insulating, antiferromagnetic copper oxide plane.Lee et al. (2006) The optical gap in lamellar insulating cuprates is associated with the transfer of an electron from an oxygen ion to a neighboring copper ion within the copper oxide plane.Zaanen et al. (1985); Tokura et al. (1990) The electron resides primarily on the copper in a nominal state, while the oxygen hole forms a Zhang-Rice singlet with another neighboring copper in a state.Zhang and Rice (1988) Beyond this basic picture, however, there continues to be controversy around the role played by interactions of the electron and hole with each other, with magnetic excitations, and with phonons.
The properties of the hole states in copper oxides have been extensively studied with angle resolved photoemission spectroscopy.(Damascelli et al., 2003) The hole bandwidth was measured to be meV, strongly renormalized from the band theoretic value and consistent with the prediction of the model, although an extension to a model is required to fit the detailed dispersion.(Wells et al., 1995; Sushkov et al., 1997) The photoemission lineshape was observed to be unusually broad, and recent work has interpreted this as Franck-Condon broadening due to phonons that modulate the electronic and magnetic interactions through the Cu-O bond.Shen et al. (2004, 2007); Mishchenko and Nagaosa (2004); Rosch et al. (2005); Sangiovanni et al. (2006)
The importance of carrier-phonon interactions to the optical properties of insulating cuprates were recognized by Falck et al. (1992) They showed that the energy and linewidth of the gap excitation have an anomalously strong temperature dependence, and explained this with a model involving short-range electron-hole interactions together with carrier-phonon interactions.Falck et al. (1992) This behavior has since been explained alternately as the result of lattice expansionZibold et al. (1996) or electron-magnon interactions,Choi et al. (1999) and currently the relative importance of these effects remains unresolved. Carrier-phonon interactions were further implicated in a study of the Urbach tail.Lövenich et al. (2001)
Time-resolved optical studies in insulating cuprates have also provided evidence for strong coupling of carriers to phonons and magnons at lower energies, and recent work on photoinduced phase transitions have exploited this feature to produce metastably ordered states that would be impossible to create in thermal equilibrium.Gedik et al. (2007); Koshihara (2008) Picosecond resonant Raman spectroscopy on insulating YBa2Cu3O6.2 indicated that photoexcited carriers release excess energy to optical phonons in less than one picosecond.Mertelj et al. (1997); Poberaj and Mihailovic (1994) The photoexcited states in insulating YBa2Cu3O6.2 and Nd2CuO4 have also been studied with transient absorption spectroscopy.Matsuda et al. (1994) In that case, an observed sub-picosecond initial relaxation time was interpreted to be the rate at which photoexcited states give off energy to magnons.
In this work we study the optical gap excitation of the insulating cuprate Sr2CuO2Cl2 with time- and energy-resolved laser spectroscopy, to probe the interaction between the optical gap excitation and bosonic modes at lower energies. We find that in response to photoexcitation, the energy gap softens and the optical spectral weight over the visible range is reduced. The photoinduced absorption spectrum mimics the effect of raising temperature, indicating that photoexcitation induces the same bosonic excitations that are excited thermally. By relating the pump-probe signal amplitude to the amplitude of the thermal difference spectrum we can infer that for every 3 eV photon absorbed, eleven to twenty low-energy bosons are emitted by the photoexcited state. For relaxation to the optical absorption edge at 1.5 eV, this corresponds to 70–130 meV per boson. While this range includes characteristic phonon energies, it extends well above them, indicating a possible role for magnetic excitations in relaxing the energy of photoexcited carriers.
II Experimental Method
All measurements were performed in a transmission geometry on high quality single crystals of Sr2CuO2Cl2 that were cleaved to optically thin plates. Sr2CuO2Cl2 stands out as an ideal model system for studying insulating cuprates, because the replacement of apical oxygen atoms by chlorine results in a very stable stoichiometry.Miller et al. (1990); Kastner et al. (1998) Several platelets were studied, all with consistent results. The measurements described here were performed on a Å thick Sr2CuO2Cl2 single crystal platelet, held under vacuum in a cold finger cryostat to avoid surface degradation.
In the optical region, the dominant spectral feature of Sr2CuO2Cl2 is the charge-transfer (CT) gap excitation at 2.1 eV.Zibold et al. (1996); Choi et al. (1999) We use 200 fs pulses of light from a frequency-doubled regenerative amplifier to create a non–equilibrium population of CT excitations. A white light continuum is used as a probe. We employ a zero dispersion stretcher to select a 7–9 nm wide probe pulse from the continuum that can be tuned from .
We determine the optical excitation density using the expression
| (1) |
where is the laser pulse energy, is the pump laser frequency, and are the horizontal and vertical Gaussian beam waists, respectively, is the sample thickness, and is the absorption coefficient at . The Gaussian beam profiles of both the pump and the probe were characterized at the sample plane to an accuracy of m using the knife-edge method along both horizontal and vertical axes. During the course of our experiments the beam delivery optics varied, with a typical pump beam waist of m. The pump beam was always 50% larger than the probe beam to create a more homogeneous excitation profile for the probe. We estimate the total uncertainty in to be 10%.
At each center frequency, we measure the change in the transmitted probe intensity as the pump is chopped mechanically. In the limit of small signals, the normalized change in transmission reproduces the differential absorption of the sample, since , where and are the transmitted intensities with the pump on and off, respectively. During the measurement of as a function of wavelength and time delay , we reset the position for each center wavelength. This is necessary to compensate for the dispersion experienced by probe pulses at different center frequencies.
III Results and Discussion
III.1 Pump-probe spectrum
Fig. 1(a) shows the normalized change in transmission immediately following photoexcitation with .
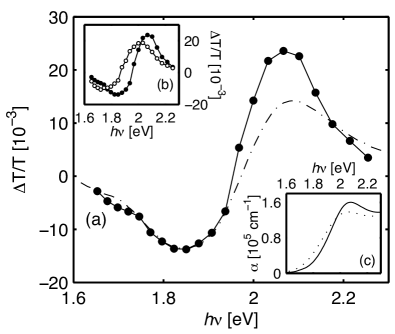
We observe photoinduced absorption, , at probe photon energies , and photobleaching, , for . In Fig. 2 we track the photoinduced absorption spectrum as a function of time delay, and we find that the transient spectral changes appear as one spectral unit instantaneously after the excitation, and decay—again as one spectral unit—on a picosecond timescale. In contrast to earlier work on similar cuprate compounds,Matsuda et al. (1994) this leads us to conclude that the feature should be considered as a whole, rather than being due to two separate physical effects, one associated with absorption and the other with bleaching.

Viewed in this way, the effect of the pump beam is to broaden the gap excitation and shift it to lower energy. This interpretation is reinforced by comparing the pump-probe spectrum to the thermal difference spectrum -, also shown in Fig. 1. Apart from the stronger photobleaching in the pump-probe spectrum, the two curves show a remarkable similarity both in position and in overall spectral shape. Furthermore, as the temperature is raised from to , the spectral shape of the pump-probe signal shown in Fig. 1(b) tracks the linear absorption spectrum shown in Fig. 1(c), broadening and shifting to lower energy.
These observations strongly suggest that the pump-probe response and thermally induced changes in the CT excitation result from the same underlying microscopic mechanism. Earlier studies found that both the energy and the linewidth of the CT excitation possess a temperature dependence that mimics a Bose-Einstein occupation function, with a characteristic energy scale of about 45 meV.Falck et al. (1992); Lövenich et al. (2001) Although this energy scale is characteristic of optical phonons in Sr2CuO2Cl2, we note that these can still couple strongly to the magnetic degrees of freedom by modulating the bonds through which magnetic exchange occurs.Mishchenko and Nagaosa (2004); Cataudella et al. (2007) Consequently we assign these low-energy bosons as optical phonons, with the understanding that they may have strong magnetic character.
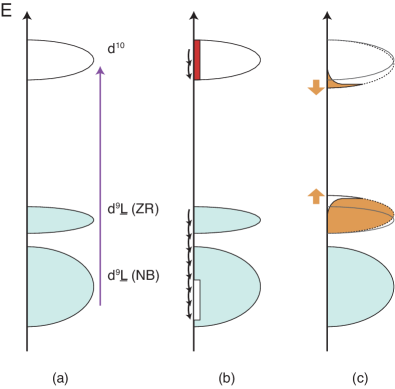
We propose that photoexcitation triggers the same event sequence that is observed in conventional polar semiconductors,von der Linde (1988); Shah (1999) represented schematically in Fig. 3. Fig. 3(a) shows the initial photoexcitation with a 3 eV pump photon. These energetic CT excitations rapidly release excess energy via the emission of optical phonons, shown in Fig. 3(b). As we discuss below, there may be an additional relaxation channel involving magnetic excitations, but for simplicity we limit the discussion here to phonons. Once produced, the additional phonons have the same effect on the CT excitation as an increase in the equilibrium temperature of the lattice, shown in Fig. 3(c). In contrast with a simple heating effect, however, the photoinduced phonon population is strongly out of equilibrium, and will decay via anharmonic processes as the system thermalizes (not shown). The carrier distribution is shown thermalized in Fig. 3(c), as we expect this to occur rapidly during the phonon emission process.
The phonon emission time is inversely proportional to the electron-phonon interaction strength,Kash et al. (1985); Shah (1999); Conwell (1967) given in the Frölich model as
| (2) |
where and are the high-frequency and static dielectric constants, respectively, is the carrier effective mass, chosen to be , and is the optical phonon frequency. We take meV to be consistent with our earlier estimate,Lövenich et al. (2001) although phonons with higher energies will tend to be favored as a way to release energy efficiently.Shah (1999) The experimental values for Sr2CuO2Cl2, and , give . In conventional semiconductors the inelastic electron-phonon scattering rate can be derived perturbatively from the Frölich model; in two dimensions, .Sarma (1992) While Sr2CuO2Cl2 is expected to be in the strong coupling limit, extending this perturbative result gives a crude estimate of . The cascade following a 3 eV excitation could then generate 33 phonons as it relaxes to the gap edge at 1.5 eV, a process that would take about 33 fs to complete. Although this is still much less than the 200 fs resolution of our experiment, it is a timescale that is testable with current experimental capability.
With the results shown in Fig. 1(a) we can estimate the number of phonons that are actually produced in the relaxation process by relating the amplitude of the pump-probe signal to the thermal difference spectrum ,
| (3) |
where is the change in boson occupation number in the thermal difference experiment, and in the photoinduced absorption measurement. To determine we have again assumed a characteristic phonon energy of 45 meV.Lövenich et al. (2001) The penetration depth of Sr2CuO2Cl2 at 3 eV is 100 nm.Zibold et al. (1996) As Fig. 1(a) shows, over the range 1.7–1.9 eV the thermal difference and pump-probe spectra are closely proportional; above eV the proportionality breaks down, although the spectral shape remains qualitatively similar. As we discuss further below, we assume that photoinduced bleaching is responsible for the difference at higher energies, and use the minimum of at eV as a proxy for the the phonon occupation level.
Combining these values in Eq. 3 gives . If the carriers relax completely to the gap edge at 1.5 eV, this implies an average energy per boson of 130 meV, much larger than the 45 meV we assumed for the optical phonon energy. Alternatively, if we match the photoinduced absorption and thermal difference spectra at the peak near eV instead of at the dip near eV, we get and an average boson energy of 76 meV, comparable to the highest energy optical phonons in Sr2CuO2Cl2.Zibold et al. (1996) Taking these as limiting cases, we get 11–20.
This comparison suggests that magnetic excitations may play a role in relaxing the energy of the photoexcited state while contributing little to the pump-probe spectrum. One possible relaxation product is the resonant excitation of two magnons and one phonon, which would absorb 350 meV of energy but create only one phonon.Lorenzana and Sawatzky (1995); Perkins et al. (1993) In this model, the average energy per boson can then be taken as a measure of the branching ratio between phonon relaxation and magnon relaxation. Taking the lower limit for , a 3 eV optical excitation will release about 0.5 eV to phonons and 1.0 eV to magnetic excitations.
We note an additional weak photoinduced absorption feature at that we assign to the ligand-field exciton.Perkins et al. (1993); Kuiper et al. (1998); Choi et al. (1999); Lövenich et al. (2001) This excitation is parity forbidden and appears as a weak shoulder extending from 1.4-1.7 eV in linear optical absorption measurements.Perkins et al. (1993); Choi et al. (1999); Lövenich et al. (2001) It is evident in both linear absorption and in our pump-probe measurements at low temperatures only. Photoexcited charge carriers and optical phonons can both lead to a weak symmetry breaking that will induce absorption from this otherwise optically forbidden transition.
III.2 Spectral weight
When integrated over the measured spectral range, the pump-probe spectrum shown in Fig. 1(a) exhibits a net photoinduced bleaching that is not observed in the thermal difference spectrum. Chemical doping causes dramatic changes to the spectral weight distribution of insulating cuprates,Basov and Timusk (2005) and similar changes have been observed in photoexcitation experiments on timescales of microseconds and longer.Kim et al. (1991); Perkins et al. (1998) Such changes are commonly analyzed using the sum rule
| (4) |
where is the total electron number density and the electron mass. An equivalent sum rule can be written for the absorption coefficient that is more convenient here:
| (5) |
These expressions indicate that the total frequency-dependent conductivity and absorption is conserved, so that any increase at one frequency must be compensated by a decrease elsewhere. In cuprates, increasing the carrier density causes spectral weight to be shifted from the charge-transfer gap to free-carrier conductivity at lower frequencies.
Photoinduced bleaching is well understood in semiconductor optics. It results from Pauli blocking, when photoexcited states occupy phase space that are then prevented by the Pauli exclusion principle from further population. To quantitatively assess the strength of the phase-space filling it is useful to calculate the real-space area that a photoexcited state excludes from further absorptionChemla et al. (1984) To determine this for a 3 eV excitation in Sr2CuO2Cl2, we extract the amount of photobleaching in the pump-probe response at and normalize it by the total linear absorption over the same spectral range to get a fractional absorption of . Dividing this by the excitation density gives excluded area of 9.3 copper oxide plaquettes. This number suggests that the photoexcited state is distributed over a several lattice spacings, as would be expected from a hole state that is participating in a Zhang-Rice singlet.
III.3 Time dependence
If the pump-probe response is generated by phonons as we have argued, we expect its temporal behavior to be determined by phonon decay mechanisms. Fig. 4(a) shows the decay of the pump-probe response with
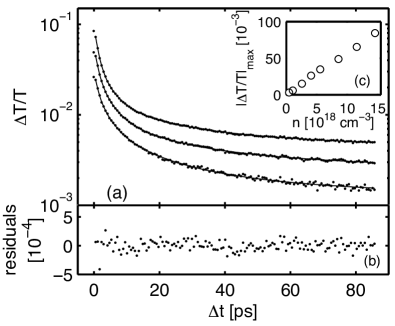
, and at three different excitation densities. The decay dynamics depend weakly on density and are strongly nonexponential. They are not well described by stretched exponential fits or bimolecular decay kinetics, so to facilitate quantitative comparison of the dynamics at different densities, we employ a discretized Laplace transform, fitting the data by a sum of exponential decays:
| (6) |
The decay times are globally constrained to a logarithmic spacing , yielding constrained linear fits to that may be compared directly as a function of excitation density.Istratov and Vyvenko (1999) We find that is the minimum value necessary to achieve a good fit, with residuals as shown in Fig. 4(b) for the highest density. Fig. 4(c) shows that up to the highest pump intensities available to us, the photoinduced signal is linear in the excitation density. Consequently, we expect , and an increase in one amplitude will come at the expense of others. The resulting amplitudes are shown as a function of density in Fig. 5.
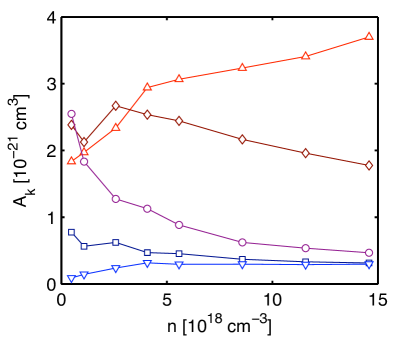
The picosecond decay timescale is typical for anharmonic decay of LO phonons into two LA phonons at lower energies,von der Linde (1988) and given the complexity of the Sr2CuO2Cl2 crystal structure the distribution of decay timescales is unsurprising. As the density increases, the amplitudes are shifted to shorter timescales, indicating an increase in the number of decay channels as the phonon density increases. We find relatively small temperature dependence of the decay dynamics up to room temperature, expected for optical phonons that will decay primarily through spontaneous emission. After the charge carriers have relaxed to the minimum gap energy of 1.5 eV, we expect them to dissipate their remaining energy through either radiative or nonradiative recombination on longer timescales.
IV Summary
In summary, we have characterized the photoinduced absorption spectrum of Sr2CuO2Cl2 as a function of excitation density, temperature, and pump-probe time delay, and found that the characteristic features of the response can be explained in terms of a strong coupling between the CT excitation and optical phonons. We have estimated that from eleven to twenty phonons are created upon photoexcitation at 3 eV. A value at the lower bound would account for only a third of the total energy that the carriers must release to relax to the gap edge, and we have argued that magnetic excitations may also play a role in the relaxation process. We have observed a photoinduced bleaching of the charge-transfer excitation and used this to estimate the size of a 3 eV excitation to be about nine CuO2 plaquettes. Finally, we have characterized the temporal decay of the photoexcited state and associated it with anharmonic phonon decay. Our experiments suggest a novel way to use light to manipulate the low-energy bosonic excitations of insulating cuprates and probe their interactions with other optical excitations.
Acknowledgements.
This work was supported by the Director, Office of Science, Office of Basic Energy Sciences, Division of Materials Sciences and Office of Science, U.S. Department of Energy, under Contracts No. DE-AC03-76SF00098 and W-7405-Eng-82. JSD acknowledges support from the Natural Science and Engineering Research Council of Canada (NSERC) and the Canadian Institute for Advanced Research (CIFAR). ABS gratefully acknowledges a fellowship by the German National Merit Foundation.References
- von der Linde (1988) D. von der Linde, in Ultrashort Laser Pulses and Applications, edited by W. Kaiser (Springer Verlag, Berlin, 1988).
- Shah (1999) J. Shah, Ultrafast spectroscopy of semiconductors and semiconductor nanostructures, vol. 115 of Springer Series in Solid State Sciences (Springer Verlag, New York, 1999), 2nd ed.
- Averitt and Taylor (2002) R. D. Averitt and A. J. Taylor, Journal of Physics: Condensed Matter 14, R1357 (2002).
- Rini et al. (2007) M. Rini, R. Tobey, N. Dean, J. Itatani, Y. Tomioka, Y. Tokura, R. W. Schoenlein, and A. Cavalleri, Nature 449, 72 (2007).
- Hendry et al. (2007) E. Hendry, M. Koeberg, and M. Bonn, Physical Review B (Condensed Matter and Materials Physics) 76, 045214 (pages 6) (2007).
- Lee et al. (2006) P. A. Lee, N. Nagaosa, and X.-G. Wen, Rev. Mod. Phys. 78, 17 (2006).
- Zaanen et al. (1985) J. Zaanen, G. A. Sawatzky, and J. W. Allen, Phys. Rev. Lett. 55, 418 (1985).
- Tokura et al. (1990) Y. Tokura, S. Koshihara, T. Arima, H. Takagi, S. Ishibashi, T. Ido, and S. Uchida, Phys. Rev. B 41, 11657 (1990).
- Zhang and Rice (1988) F. C. Zhang and T. M. Rice, Phys. Rev. B 37, 3759 (1988).
- Damascelli et al. (2003) A. Damascelli, Z. Hussain, and Z.-X. Shen, Rev. Mod. Phys. 75, 473 (2003).
- Wells et al. (1995) B. O. Wells, Z. X. Shen, A. Matsuura, D. M. King, M. A. Kastner, M. Greven, and R. J. Birgeneau, Phys. Rev. Lett. 74, 964 (1995).
- Sushkov et al. (1997) O. P. Sushkov, G. A. Sawatzky, R. Eder, and H. Eskes, Phys. Rev. B 56, 11769 (1997).
- Shen et al. (2004) K. M. Shen, F. Ronning, D. H. Lu, W. S. Lee, N. J. C. Ingle, W. Meevasana, F. Baumberger, A. Damascelli, N. P. Armitage, L. L. Miller, et al., Phys. Rev. Lett. 93, 267002 (2004).
- Shen et al. (2007) K. M. Shen, F. Ronning, W. Meevasana, D. H. Lu, N. J. C. Ingle, F. Baumberger, W. S. Lee, L. L. Miller, Y. Kohsaka, M. Azuma, et al., Phys. Rev. B 75, 075115 (2007).
- Mishchenko and Nagaosa (2004) A. S. Mishchenko and N. Nagaosa, Phys. Rev. Lett. 93, 036402 (2004).
- Rosch et al. (2005) O. Rosch, O. Gunnarsson, X. J. Zhou, T. Yoshida, T. Sasagawa, A. Fujimori, Z. Hussain, Z.-X. Shen, and S. Uchida, Phys. Rev. Lett. 95, 227002 (2005).
- Sangiovanni et al. (2006) G. Sangiovanni, O. Gunnarsson, E. Koch, C. Castellani, and M. Capone, Phys. Rev. Lett. 97, 046404 (2006).
- Falck et al. (1992) J. P. Falck, A. Levy, M. A. Kastner, and R. J. Birgeneau, Phys. Rev. Lett. 69, 1109 (1992).
- Zibold et al. (1996) A. Zibold, H. L. Liu, S. W. Moore, J. M. Graybeal, and D. B. Tanner, Phys. Rev. B 53, 11734 (1996).
- Choi et al. (1999) H. S. Choi, Y. S. Lee, T. W. Noh, E. J. Choi, Y. Bang, and Y. J. Kim, Phys. Rev. B 60, 4646 (1999).
- Lövenich et al. (2001) R. Lövenich, A. B. Schumacher, J. S. Dodge, D. S. Chemla, and L. L. Miller, Phys. Rev. B 63, 235104 (2001).
- Gedik et al. (2007) N. Gedik, D.-S. Yang, G. Logvenov, I. Bozovic, and A. H. Zewail, Science 316, 425 (2007).
- Koshihara (2008) S. Koshihara, J. Phys.: Conf. Ser. 148 (2008).
- Mertelj et al. (1997) T. Mertelj, J. Demsar, B. Podobnik, I. Poberaj, and D. Mihailovic, Phys. Rev. B 55, 6061 (1997).
- Poberaj and Mihailovic (1994) I. Poberaj and D. Mihailovic, Phys. Rev. B 50, 6426 (1994).
- Matsuda et al. (1994) K. Matsuda, I. Hirabayashi, K. Kawamoto, T. Nabatame, T. Tokizaki, and A. Nakamura, Phys. Rev. B 50, 4097 (1994).
- Miller et al. (1990) L. L. Miller, X. L. Wang, S. X. Wang, C. Stassis, D. C. Johnston, J. Faber, and C.-K. Loong, Phys. Rev. B 41, 1921 (1990).
- Kastner et al. (1998) M. A. Kastner, R. J. Birgeneau, G. Shirane, and Y. Endoh, Rev. Mod. Phys. 70, 897 (1998).
- Cataudella et al. (2007) V. Cataudella, G. De Filippis, A. S. Mishchenko, and N. Nagaosa, Phys. Rev. Lett. 99, 226402 (2007).
- Kash et al. (1985) J. A. Kash, J. C. Tsang, and J. M. Hvam, Phys. Rev. Lett. 54, 2151 (1985).
- Conwell (1967) E. M. Conwell, High Field Transport in Semiconductors (Academic Press, 1967).
- Sarma (1992) S. D. Sarma, in Hot Carriers in Semiconductor Nanostructures: Physics and Applications, edited by J. Shah (Academic Press, 1992).
- Lorenzana and Sawatzky (1995) J. Lorenzana and G. A. Sawatzky, Phys. Rev. Lett. 74, 1867 (1995).
- Perkins et al. (1993) J. D. Perkins, J. M. Graybeal, M. A. Kastner, R. J. Birgeneau, J. P. Falck, and M. Greven, Phys. Rev. Lett. 71, 1621 (1993).
- Kuiper et al. (1998) P. Kuiper, J.-H. Guo, C. Såthe, L.-C. Duda, J. Nordgren, J. J. M. Pothuizen, F. M. F. de Groot, and G. A. Sawatzky, Phys. Rev. Lett. 80, 5204 (1998).
- Basov and Timusk (2005) D. N. Basov and T. Timusk, Rev. Mod. Phys. 77, 721 (2005).
- Kim et al. (1991) Y. H. Kim, S.-W. Cheong, and Z. Fisk, Phys. Rev. Lett. 67, 2227 (1991).
- Perkins et al. (1998) J. D. Perkins, R. J. Birgeneau, J. M. Graybeal, M. A. Kastner, and D. S. Kleinberg, Phys. Rev. B 58, 9390 (1998).
- Chemla et al. (1984) D. S. Chemla, D. A. B. Miller, P. W. Smith, A. C. Gossard, and W. Wiegmann, IEEE J. Quantum Electr. 20, 265 (1984).
- Istratov and Vyvenko (1999) A. A. Istratov and O. F. Vyvenko, Rev. Sci. Instrum. 70, 1233 (1999).