Multiwavelength observations of 3C 454.3 II. The AGILE 2007 December campaign
Abstract
We report on the second AGILE multiwavelength campaign of the blazar 3C 454.3 during the first half of December 2007. This campaign involved AGILE, Spitzer, Swift, Suzaku, the WEBT consortium, the REM and MITSuME telescopes, offering a broad band coverage that allowed for a simultaneous sampling of the synchrotron and inverse Compton (IC) emissions. The 2-week AGILE monitoring was accompanied by radio to optical monitoring by WEBT and REM and by sparse observations in mid-Infrared and soft/hard X-ray energy bands performed by means of Target of Opportunity observations by Spitzer, Swift and Suzaku, respectively. The source was detected with an average flux of photons cm-2 s-1above 100 MeV, typical of its flaring states. The simultaneous optical and -ray monitoring allowed us to study the time-lag associated with the variability in the two energy bands, resulting in a possible 1-day delay of the gamma-ray emission with respect to the optical one. From the simultaneous optical and gamma-ray fast flare detected on December 12, we can constrain the delay between the gamma-ray and optical emissions within 12 hours. Moreover, we obtain three Spectral Energy Distributions (SEDs) with simultaneous data for 2007 December 5, 13, 15, characterized by the widest multifrequency coverage. We found that a model with an external Compton on seed photons by a standard disk and reprocessed by the Broad Line Regions does not describe in a satisfactory way the SEDs of 2007 December 5, 13 and 15. An additional contribution, possibly from the hot corona with K surrounding the jet, is required to account simultaneously for the softness of the synchrotron and the hardness of the inverse Compton emissions during those epochs.
Subject headings:
FSRQs objects: individual 3C 454.3; radiation mechanism: non-thermal; X-rays: galaxies, gamma-rays: observations; galaxies: jets1. Introduction
3C 454.3 is a flat spectrum radio quasar at redshift . It is one of the brightest extragalactic radio sources with superluminal motion hosting a radio and X-ray jet. It has been observed in almost all the electromagnetic spectrum from radio up to -ray energies; the SED has the typical double-humped shape of the blazars, the first peak occurring at mid-far infrared frequencies and the second one at MeV–GeV energies (see Ghisellini et al. 1998).
The first peak is commonly interpreted as synchrotron radiation from high energy electrons in a relativistic jet, while the second component is due to electrons scattering on soft seed photons. In the context of a simple, homogeneous scenario, the emission at the synchrotron and IC peaks is produced by the same electrons population that can self scatter the same synchrotron photons (Synchrotron Self Compton, SSC). Alternatively, the jet-electrons producing the synchrotron flux can Compton-scatter seed photons produced outside of the jet (External Compton, EC).
3C 454.3 is a highly variable blazar source. In spring 2005, 3C 454.3 experienced a strong outburst in the optical band reaching its historical maximum with mag (Villata et al. 2006). The exceptional event triggered observations at higher energies from Chandra (Villata et al. 2006), Swift (Giommi et al. 2006) and INTEGRAL (Pian et al. 2006). The available data allowed to build the spectrum of the source up to 200 keV. In particular, INTEGRAL detected (15-18 May 2005) the source from 3 up to 200 keV in a very bright state ( erg cm-2 s-1), being almost a factor 2-3 higher than the previously observed fluxes (see Tavecchio et al. 2002). Pian et al. (2006) compared the SED in 2000 with that obtained during the 2005 outburst. They were able to describe both observed SEDs with minimal changes in the jet power, assuming that the dissipation region (where most of the radiation is produced) was inside the Broad Line Region (BLR) in 2000 and outside of it in 2005. On the other hand, Sikora et al. (2008) argued that X-rays and -ray could be produced via inverse Compton scattering of near- and mid-IR photons emitted by the hot dust: a very moderate energy density of the dust radiation is sufficient to provide the dominance of the EC luminosities over the SSC ones.
In July 2007 the source woke up again in the optical band, reaching a maximum at mag (Raiteri et al. 2008b). Such an increase in the optical activity triggered observations with Swift and AGILE. Although still in its Science Verification Phase, AGILE repointed at 3C 454.3 and detected it in high -ray activity. The average -ray flux detected by AGILE was the highest -ray flux ever detected from this blazar, being photons cm-2 s-1(see Fig. 3 lower panel in Vercellone et al. 2008).
Ghisellini et al. (2007) reproduced the three source states in 2000, 2005, 2007 with the model proposed in Katarzynski Ghisellini (2007). The model assumes that the relative importance of synchrotron and SSC luminosity with respect to the EC one is controlled by the value of the bulk Lorentz factor , which is associated to the compactness of the source.
Villata et al. (2007) and Raiteri et al. (2008b) suggested an alternative interpretation involving changes of the viewing angle of the different emitting regions of the jet.
In both cases, a strong degeneracy of parameters exists in both SSC and EC models especially when the -ray data are missing. This is the case of both SEDs in 2000, 2005 in which historical EGRET data were used to constrain the models.
3C 454.3 exhibited outbursts several times between 2007 and 2008 (see Vercellone et al. 2008, Tosti et al. 2008, Raiteri et al. 2008a, Raiteri et al. 2008b, Vercellone et al. 2009) posing stringent constraints on its gamma-ray duty cycle.
This strengthened the need for simultaneous observations in different energy bands. In the case of 3C 454.3 (and other MeV blazars) it is clear that the dominant contribution in the SED comes from IR-optical bands, where the synchrotron peak lies and from both X-rays and -ray energy range where the inverse Compton emission lies.
In this paper we present and discuss the result of a multiwavelength campaign on 3C 454.3 during a period of intense -ray activity occurred between 2007 December 1 and 16. In Section 2 we present the multiwavelength campaign, in Sect. 3 - 7 we present the AGILE, Suzaku, Swift, , REM, WEBT and MITSuME observations and data analysis; in Sect. 8 we analyse the -optical correlation and present broad-band SEDs built with simultaneous data, discussing in details how they are modelled in the framework of SSC and EC scenarios. Throughout this paper the photon indexes are parametrized as (photons cm-2 s-1keV-1 or MeV-1). The uncertainies are given at 1- level, unless otherwise stated.
2. The multiwavelength campaign
During the period of intense -ray activity showed in November 2007 (Vercellone et al. 2009), AGILE continued the pointing towards 3C 454.3 for the first half of December 2007. The persistent high -ray activity of the source stimulated us to activate a new multiwavelength campaign.
AGILE data were collected between 2007 December 1 and 2007 December 16. Suzaku data were collected during a dedicated Target of Opportunity (ToO) performed on December 5, whereas the Spitzer data were collected on December 13 and 15 thanks to a granted Director’s Discretionary Time (DDT) observation.
During these two days a ToO with Swift data was activated for a total exposure of 9 ks.
During the whole AGILE observations the source was monitored in radio-to-optical bands by WEBT (see Raiteri et al. 2008a). In addition, observations in the NIR and optical energy bands by REM occurred between December 1 and 8. Moreover, optical data from MITSuME telescope are available on this source until December 6. In the following sections we report on the details of the observations and the data analysis for each instrument.
3. AGILE Observation
AGILE (Astrorivelatore Gamma a Immagini Leggero, Tavani et al. 2008, 2009) is a mission of the Italian Space Agency (ASI) for the exploration of -ray sky, operating in a low Earth orbit since 2007 April 23. The AGILE scientific Instrument (Prest et al. 2003, Perotti et al. 2006, Labanti et al. 2009) is very compact and combines four active detectors yielding simultaneous coverage in gamma-rays, 30 MeV-30 GeV and in hard X-ray energy band 18-60 keV (Feroci et al. 2007).
The AGILE observations of 3C 454.3 were performed between 2007 December 1 and 16, for a 2-week total pointing duration. In the first period, between December 1 and 5, the source was located off the AGILE pointing direction. In the second period, between December 5 and 16, after a satellite re-pointing, the source was located at off-axis (variable by degree per day due to the pointing drift) thus to increase the significance of the detection.
AGILE-GRID (AGILE-Gamma Rays Imaging Detector) data were analyzed using the Standard Analysis Pipeline. Counts, exposure, and Galactic background maps were created with a bin-size of for photons with energy greater than 100 MeV. To reduce the particle background contamination we selected only events flagged as confirmed -ray events, and all events collected during the South Atlantic Anomaly were rejected. We also reduced the -ray Earth albedo contamination by excluding regions within from the Earth limb.
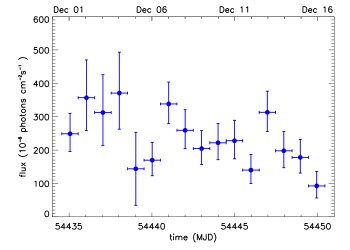
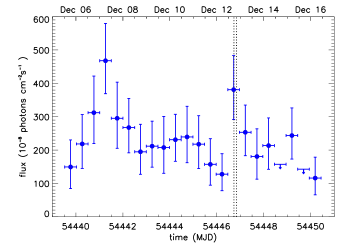
The 2-week data have been divided in 2 sets taking into account the two different pointings during which the source shifted from to degrees off-axis: the first set between UTC 2007-12-01 13:21 and UTC 2007-12-05 12:34; the second set between UTC 2007-12-05 12:35 and 2007-12-16 10:27 (in Fig. 1, top panel, we also report the -ray flux of 1 day before). The first set required a more detailed analysis due to uncertainty on calibration for large off-axis angles in the Field of View (FoV).
We ran the AGILE Maximum Likelihood procedure (ALIKE) on each data set, in order to obtain the average flux as well as the daily values in the -ray band, according to Mattox et al. (1996). The average fluxes obtained integrating separately the two data sets are photons cm-2 s-1() and photons cm-2 s-1() for the first and second periods, respectively. The source was always detected on the 2-week period with a daily integration time. The 1-day binned light curve shows three enhancements of the emission around December 4, December 7 and December 13 (see Fig. 1 top panel). In particular, the last two enhancements are characterized by a sharp increase of the emission followed by a slow recovery. We accumulated the spectrum over the second set of data in which the source was positioned within 30 degrees in the AGILE-GRID Field of View, where the most significant energy spectrum can be extracted, due to the higher statistical quality. The spectral fit was performed by using only data between 100 MeV and 1 GeV (which are better calibrated) although in Fig. 2 we report also the energy bin below 100 MeV. It resulted in a power law with a photon index . We note that the current AGILE response is calibrated up to 1 GeV, and that the energy flux above 1 GeV is underestimated by a factor of 2-3. This prevented us to discuss any possible spectral break above 1 GeV as found by Fermi (Abdo et al. 2009). However, we note that the AGILE spectrum seems to be harder than the one inferred by Fermi below GeV. The different energy range and the non-simultaneity of the data could explain the difference between the photon indexes.
SuperAGILE did not detect the source during the 2-week AGILE pointing. A deep 3- upper limit of mCrab was derived integrating all the data in which the source was within 30 degrees in the FoV (net source exposure of 360 ks).
4. Suzaku Observation
Following the AGILE detection of the flaring state, 3C 454.3 was observed with Suzaku (Mitsuda et al. 2007) on December 2007 as a ToO, with a total duration of 40 ks. Suzaku carries four sets of X-ray telescopes (Serlemitsos et al. 2007) each one equipped with a focal-plane X-ray CCD camera (XIS, X-ray Imaging Spectrometer; Koyama et al. 2007) that is sensitive in the energy range of 0.312 keV, together with a non-imaging Hard X-ray Detector (HXD; Takahashi et al. 2007; Kokubun et al. 2007), which covers the 10600 keV energy band with Si PIN photo-diodes and GSO scintillation detectors. 3C 454.3 was focused on the nominal center position of the XIS detectors.
For the XIS, we analyzed the screened data, reduced via Suzaku software version 2.1. The reduction followed the prescriptions described in ‘The Suzaku Data Reduction Guide’ provided by the Suzaku guest observer facility at the NASA/GSFC111http://suzaku.gsfc.nasa.gov/docs/suzaku/analysis/abc. See also seven steps to the Suzaku data analysis at http://www.astro.isas.jaxa.jp/suzaku/analysis. The screening was based on the following criteria: (1) only ASCA-grade 0, 2, 3, 4, 6 events are accumulated, while hot and flickering pixels were removed from the XIS image using the cleansis script, (2) the time interval after the passage through the South Atlantic Anomaly (T_SAA_HXD) is greater than 500 s, (3) the object is at least 5∘ and 20∘ above the rim of the Earth (ELV) during night and day, respectively. In addition, we also selected the data with a cut-off rigidity (COR) larger than 6 GV. After this screening, the net exposure for good time intervals is 35.1 ks. The XIS events were extracted from a circular region with a radius of centred on the source peak, whereas the background was accumulated in an annulus with inner and outer radii of and pixels, respectively. The response (RMF) and auxiliary (ARF) files are produced using the analysis tools xisrmfgen and xissimarfgen, which are included in the software package HEAsoft version 6.4.1.
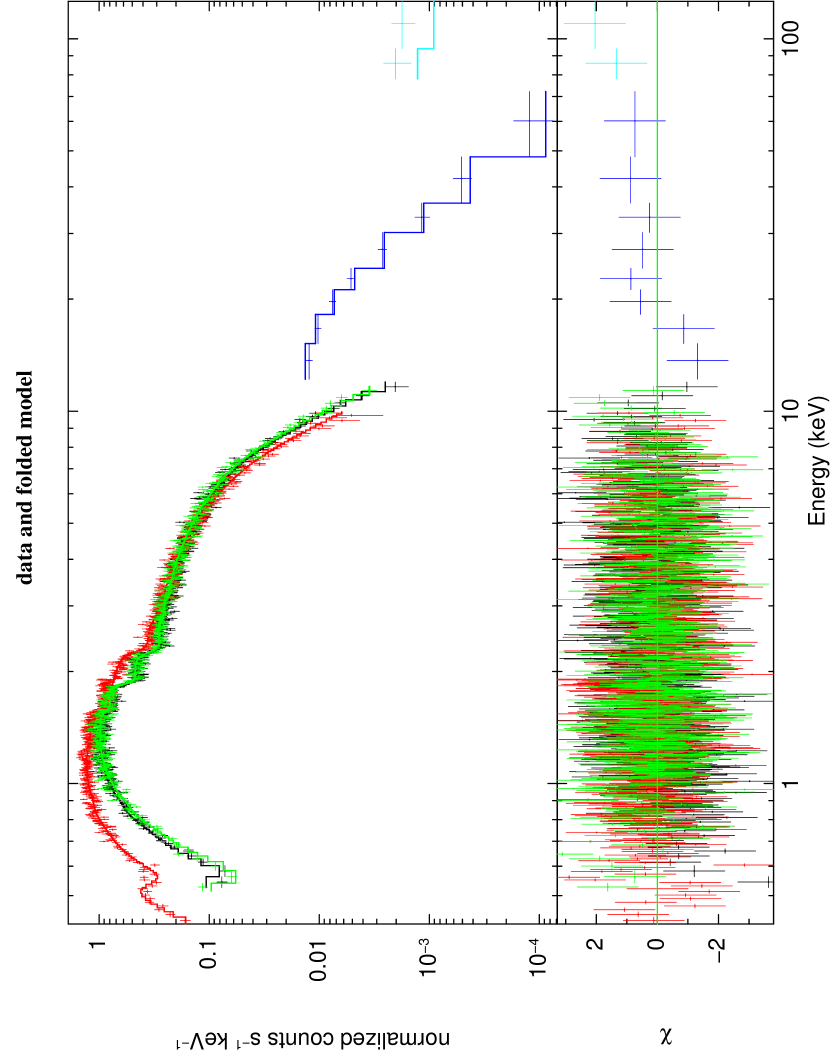
The HXD/PIN event data (version 2.1) are processed with basically the same screening criteria as those for the XIS, except that ELV 5∘ through night and day, and COR 8 GV. The HXD/PIN instrumental background spectra were generated from a time dependent model provided by the HXD instrument team for each observation (see Kokubun et al. 2007). Both the source and background spectra were made with identical good time intervals (GTIs) and the exposure was corrected for a detector deadtime of 6.9. We used the response files version ae_hxd_pinxinome_20070914.rsp, provided by the HXD instrumental team. Similarly, the HXD/GSO event data (version 2.1) were processed with a standard analysis technique described in the cited ‘The Suzaku Data Reduction Guide’. Despite the relatively high instrumental background of the HXD/GSO, the source was marginally detected at 5.5 level between 80 and 120 keV. We used the response files version ae_hxd_gsoxinom_20080129.rsp. Spectral analysis was performed using the Xspec fitting package 12.3.1. and we fitted both the soft and hard X-ray spectra with a power law with Galactic absorption free to vary. The XIS spectra are well fitted with a power law with absorbed with N cm-2, which infers the absorbed fluxes of erg cm-2 s-1 and erg cm-2 s-1 in the energy bands 0.3-10 keV and 2-10 keV, respectively. The hard X-ray spectrum determined by HXD/PIN and GSO seems to be a bit flatter than those determined by the XIS only below 10 keV, as it is shown in the residuals reported in Fig. 3 (where a model with a single power law is assumed). We found that it is better fitted by a power-law photon index = 1.350.14, which gives F erg cm-2 s-1. The uncertainties reported above are at 90 confidence level.
5. Swift observations
During our campaign Swift (Gehrels et al. 2004) performed two ToO observations of 3C 454.3: the first on 2007 December 13, the second on 2007 December 15. Both observations were performed using all on-board experiments: the X-ray Telescope (XRT; Burrows et al. 2005, 0.2-10 keV), the UV and Optical Telescope (UVOT; Roming et al. 2005, 170-600 nm) and the Burst Alert Telescope (BAT; Barthelmy et al. 2005, 15-150 keV). The hard X-ray flux of this source is below the sensitivity of the BAT instrument for short exposure and therefore the data from this instruments will not be used. We refer to Raiteri et al. (2008a) for a detailed description of data reduction and analysis of the UVOT data.
XRT observations were carried out using the instrument in Photon Counting (PC) readout mode (see Burrows et al. 2005 and Hill 2004, for details of the XRT observing modes). The XRT data were processed with the XRTDAS software package (v.2.2.2) developed at the ASI Science Data Center (ASDC) and distributed by HEASARC within the HEASoft package (v. 6.4). Event files were calibrated and cleaned with standard filtering criteria with the xrtpipeline task using the latest calibration files available in the Swift CALDB distributed by HEASARC. Both observations showed an average count rate 0.5 counts s-1 and therefore pile-up correction was required. We extracted the source events from an annulous extraction region with inner, outer radii of 3, 30 pixels. To account for the background, we also extracted events within a circular region centred on a region free from background sources and with radius of 80 pixels. The ancillary response files were generated with the task xrtmkarf. We used the latest spectral redistribution matrices (RMF, v011) in the Calibration Database maintained by HEASARC. The adopted energy range for spectral fitting is 0.3-10 keV, and all data are rebinned with a minimum of 20 counts per energy bin to use the statistics. Swift/XRT uncertainties are given at 90 confidence level for one interesting parameter, unless otherwise stated.
Spectral analysis was performed using the Xspec fitting package 12.3.1 and we fitted the spectra with a power law model with galactic absorption left free to vary. In Table 1 we summarize the best fit parameters and the derived absorbed fluxes in the energy ranges 0.3-10 keV, 2-10 keV. We note that the best-fit NH values in Table 1 are in agreement with the value cm-2 derived by Villata et al. (2006) when analysing Chandra observations in May 2005, and adopted by Raiteri et al. (2007) and Raiteri et al. (2008b) when fitting the X-ray spectra acquired by XMM-Newton in 2006–2007. In Fig. 4 we show the data and the folded models for these observations.
6. Optical monitoring
6.1. WEBT Observation
The Whole Earth Blazar Telescope (WEBT; http://www.oato.inaf.it/blazars/webt/) is an international collaboration including tens of optical, near-IR, and radio astronomers devoted to blazar studies. An extensive monitoring effort on 3C 454.3 was carried out by the WEBT from 2005 to 2008, to follow the large 2005 outburst and post-outburst phases (Villata et al. 2006, 2007; Raiteri et al. 2007), and the new flaring phase started in mid 2007 (Raiteri et al. 2008a, 2008b). A detailed presentation and discussion of the radio, mm, optical and SWIFT-UVOT data collected in December 2007 can be found in Raiteri et al. (2008a). Here we adopt their data analysis in the context of our multifrequency study.
6.2. REM Observation
The photometric optical observations were carried out with the Rapid Eye Mount (REM, Zerbi et al. 2004), a robotic telescope located at the ESO Cerro La Silla observatory (Chile). The REM telescope has a Ritchey-Chretien configuration with a 60 cm f/2.2 primary and an overall f/8 focal ratio in a fast moving alt-azimuth mount providing two stable Nasmyth focal stations. Two cameras are simultaneously used at the focus of the telescope, by means of a dichroic filter, REMIR for the NIR (Conconi et al. 2004) and ROSS for the optical (Tosti et al. 2004), in order to obtain nearly simultaneous data.
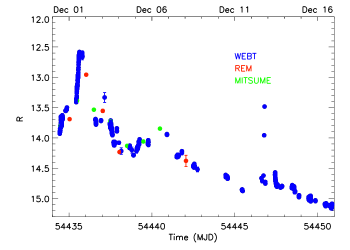
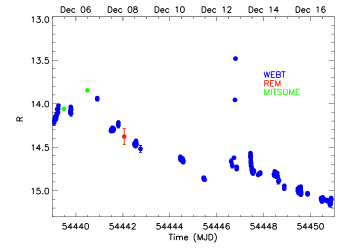
The telescope REM has continuously observed 3C 454.3 between 2007 December 1 and 2007 December 8, overlapping with the AGILE observation period. The light curve produced by REM in the -band is shown in Fig. 1 (bottom panel, red points).
6.3. MitSuME Observation
A contribution of the optical follow-up observations was given also by MITSuME (Multicolor Imaging Telescopes for Survey and Monstrous Explosions), composed of 3 robotic telescopes (of 50 cm diameter each) located at the ICCR (Institute of Cosmic-Ray Research) Akeno Observatory, Yamanashi, Japan and the OAO (Okayama Astrophysical Observatory). Each MITSuME telescope has a Tricolor Camera, which allows to take simultaneous images in , and bands. The camera employs three Alta U-6 cameras (Apogee Instruments Inc.) and KAF-1001E CCD (Kodak) with 10241024 pixels. The pixel size is 24m24m, or 1.6”1.6” at the focal plane. It is designed to have a wide field view of 28’28’. The primary motivation of MITSuME project is a multi-band photometry of gamma-ray bursts and their afterglows at very early phases, but the telescopes are also actively used for multi-color optical monitoring of more than 30 blazars and other interesting Galactic or extragalactic sources. These telescopes are automatically operated and respond to GRB alerts and transient events like AGN flares.
MITSuME observed 3C 454.3 almost every day from Nov 22 to Dec 6, 2007, so as to provide simultanous data with AGILE and . All raw , and frames were corrected for dark, bias and flat field by using IRAF ver 2.12 software. Instrumental magnitudes were obtained via aperture photometery using DAOPHOT (Stetson 1987) and SExtractor (Bertin & Arnouts 1996). Calibration of the optical source magnitude was conducted by differential photometry with respect to the comparison stars sequence reported by Raiteri et al. (1998) and Gonzalez-Perez et al. (2001). The fluxes are corrected for the Galactic extinction corresponding to a reddening of = 0.108 mag (Schlegel et al. 1998). The -optical light curve between November 30 and December 6 is showed in Fig. 1 (bottom panel, green circles).
7. Mid-Infrared observations
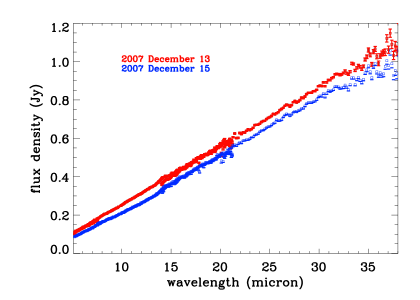
Given the high -ray activity detected by AGILE from 3C 454.3, we also requested and obtained a Director’s Discretionary Time for a mid-Infrared follow-up by Spitzer (Werner et al. 2004). The DDT was approved for 2 epochs for a total duration of 0.8 hours of the Infrared Spectrograph (IRS, Houck et al. 2004) providing short-low and long-low observations of 3C 454.3 scheduled for December 13 (starting at MJD 54447.410) and 15 (starting at MJD 54449.403). Both observations provided us with a low resolution spectrum () in the energy range . Data were acquired in the IRS standard staring mode: observations were obtained at two positions along the slit to enable sky subtraction. Each ramp duration was set to 14.68 s with a number of cycles equal to 5. Each set of data was processed with the IRS Standard Pipeline SMART developed at the Spitzer Science Center to produce calibrated data frames (Basic Calibrated Data, BCD files). Moreover, the BCD files covering the same spectral range were coadded and then sky-subtracted spectra were obtained. The absolute flux calibration was estimated by using the electron-to-Jy conversion polynomial given in the appropriate Spitzer calibration file. In Fig. 5 we present the two spectra obtained on December 13 and 15. We performed a linear fit of the two, obtaining a flux equal to erg cm-2 s-1for December 13 and 15, respectively.
8. Discussion
8.1. Timing analysis
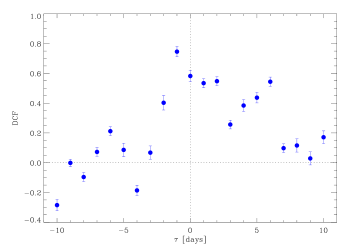
We investigated the emission of the blazar 3C 454.3 during a multifrequency campaign performed in the first half of December 2007. The source was found to be in flaring state with an average -ray flux above 100 MeV of photons cm-2 s-1, which is typical of its high gamma-ray state (Vercellone et al. 2008, Anderhub et al. 2008, Vercellone et al. 2009). As in the case of the previous multifrequency campaign (November 2007, Vercellone et al. 2009), the source was continuously monitored in -rays as well as in the optical energy bands. In both energy bands the source exhibited comparable flux variations of the order of : this argues for an EC model. Moreover, we deeply studied the optical- correlation by means of a Discrete Correlation Function (DCF; Edelson & Krolik 1988; Hufnagel & Bregman 1992) applied to the optical and gamma-ray light curves reported in Fig. 1. This analysis revealed 1 day delay of the gamma-ray emission with respect to the optical one (see Fig. 6). Indeed, the DCF maximum at a time lag day corresponds to a centroid day, whose uncertainty can be estimated by means of the Monte Carlo method known as “flux redistribution/random subset selection” (Peterson et al. 1998, Raiteri et al. 2003). By running 1000 simulations we found day at 1 sigma confidence level. We also performed the DCF reducing the data binning down to 12 hr between December 5 and 16, keeping the 1-day binned -ray light curve for the data before December 5 (MJD=54439.524). This shows a peak at -1 day with centroid at -0.54 which is in agreement with the result obtained with the 1-day binned -ray light curve. In this case, the Monte Carlo method is not able to provide a reliable estimate of the error on the time lag due to the larger uncertainties on the -ray fluxes.
The evidence of this time lag again suggests the dominance of the EC model: such a delay is compatible with the typical blob dimensions and the corresponding crossing time of the external seed photons (Sokolov et al. 2004). We note that this evidence agrees with what was found by Bonnig et al. (2009).
Particularly interesting is the source optical flare recorded by WEBT on December 12 (Raiteri et al. 2008a). The source experienced an exceptional variability in less than 3 hr. Raiteri et al. (2008a) interpreted this event as a variation in the properties of the jet emission. This unusual event clearly required an intra-day analysis of the -ray data. This analysis depends on the source brightness and the instrumental sensitivity. Given the -ray flux level of 3C 454.3 reached between 2007-12-05 and 2007-12-16, we obtained a data binning not smaller than 12 hr (Fig. 7). This analysis showed an enhancement of more than a factor of 2 of the -ray flux during the second half of 2007 December 12, that remarkably includes the time of the optical event (see vertical lines in Fig. 7). The enhancement by a factor of of the -ray flux was comparable with the 1.1 mag optical brightening. This could support the evidence of a change in the jet emission in the EC scenario. The 12-hour -ray light curve could constrain a possible delay between the -ray emission and the optical one within 12 hours, shorter than ever observed before for this source.
8.2. Spectral Modelling
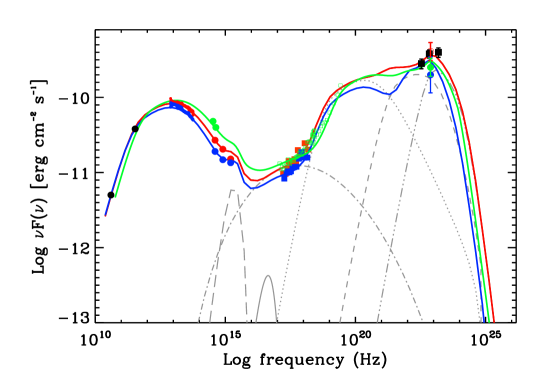
As described in the previous section, the December 2007 multifrequency campaign was characterized by ToO carried out in mid-Infrared (Spitzer), soft X-ray (Suzaku, Swift), hard X-ray (Suzaku) and radio-to-optical and -ray monitoring. These observations allowed us to obtain the SED of this blazar with a wide multi-frequency coverage for three different epochs: December 5, 13, 15. At these dates the SED in X-rays shows a softening towards lower frequencies that can be due to two causes: 1) a contribution from bulk comptonization by cold electrons in the jet (Celotti, Ghisellini & Fabian 2007), 2) the emergence of the SSC contribution in soft X-rays from the more energetic EC component due to the disk and the BLR. The mid-Infrared Spitzer data and optical data available in December 13 and 15 (which well define the synchrotron peak), combined with the resolved X-ray spectrum and the gamma-ray data constrain the model parameters, arguing for the latter cause; the SSC emergence is a natural and inevitable consequence of the simultaneous modelling of the broad-band SED. Nevertheless, some contribution from bulk comptonization cannot be ruled out.
We first considered the state of December 13 and 15 in which we have radio, mid-Infrared, optical, X and -ray simultaneous data. In these epochs 3C 454.3 was in a different state with respect to the one analyzed in November: optical and UV fluxes appeared lower by a factor 2-3, suggesting the synchrotron bump peaking at a frequency 5-10 times lower than the one observed in November, as confirmed also from the mid-Infrared data. On the other hand, the soft X-ray data were only a little bit lower than in November. Despite the softer synchrotron bump, -ray data showed in the SED the persistence of a hard peak at GeV, similar to the higher states observed by AGILE in July 2007 and November 2007 (Anderhub et al. 2009, Vercellone et al. 2009). In fact, the December -ray spectrum (characterized by a photon index of ) is consistent with those obtained during the 2 previous AGILE observations.
We attempted to fit the SEDs with a one-zone SSC model, adding the contribution of external seed photons coming from an accretion disk and a BLR (Raiteri et al. 2007). With this model, we succeeded to fit the synchrotron peak as well as the X-ray data assuming parameters similar to the November ones, but a lower was required to account for the softness of the synchrotron bump: with this the EC from a standard BLR peaks at eV. This is in contrast with the observed hardness of the -ray spectrum up to 1 GeV (eV is the typical energy of the external source as seen by the observer). We note that the EC by the disk can account for the rising hard X-ray portion of the SED, which did not show clear variability. Nevertheless, we note that both the disk and BLR components cannot account for the hardness of the -ray spectrum. Thus, we consider a further external source of seed photons.
A possibile candidate for this source is the hot extended corona that must be consistently produced in steady accretion/ejection flows as shown by MHD numerical simulations (Tzeferacos et al. 2009). Hence, we considered a one-zone SSC model plus the contribution by external seed photons coming from the accretion disk, the BLR and the hot corona. We adopted a spherical blob with radius cm and a broken power law for the electron energy density in the blob,
| (1) |
where is the electron Lorentz factor assumed to vary between , while and are the pre– and post–break electron distribution spectral indices, respectively. We assumed that the blob contained a random magnetic field Gauss and that it moved with bulk Lorentz Factor at an angle () with respect to the line of sight. The density parameter into the blob is cm-3.
The bolometric luminosity of the accretion disk is erg s-1, and it is assumed to lie at 0.01 pc from the blob; we assumed a BLR distant 1.5 pc, reprocessing a 10 of the irradiating continuum. We assumed for the disk a black-body spectrum peaking in UV (see Tavecchio and Ghisellini 2008, Raiteri et al. 2008b). Finally, we added the hot corona photons surrounding the jet as a black body spectrum of and erg s-1, and distant 0.5 pc from the blob. The SEDs of both December 13 and 15 could be fitted with almost the same parameters (see red and blue solid lines in Fig. 8). The high energy portion of the electron density becomes softer in December 15 as the same electrons should be accelerated with less efficiency than in December 13.
Remarkably, the lower required in the epochs considered here, makes the BLR a too soft contributor at GeV energies, while the contribution of the hot corona succeeded to account for the persistence of the hard -ray spectra measured by AGILE.
On December 5, the low energy peak of the SED is less constrained
with respect to the December 13 and 15 ones due to the lack of the
mid-Infrared data. On the other hand the Suzaku X-ray data (green points in
Fig. 8) better constrain the rise of the IC emission. We fitted this SED with
almost the same model assumed for the other two epochs, but the higher optical flux and the
lower -ray flux detected with respect to December 13 required a higher
magnetic field and a lower (see Table 2).
Given the different -ray state of the source analyzed in the November and December campaigns, we compared the particle injection luminosity, measured during the two multiwavelength campaigns. This is expressed by means of the following formula:
| (2) |
We found the particle injection luminosity of December to be , a factor of 5 lower than the November one. This difference is due to both the lower and values needed to reproduce the SED in the states of December.
9. Conclusions
We reported in this paper the main results of a multifrequency campaign on the blazar 3C 454.3 performed in December 2007. The source was simultaneously observed in mid-Infrared, optical, X-ray and -ray energy bands, which provided us with a wide dataset aimed to study the correlation between the emission properties at lower and higher frequencies. We summarize below the major results.
-
•
The -ray emission from 3C 454.3 shows variations on a daily time scale.
-
•
The simultaneous monitoring of the source in the optical and -ray energy bands allowed us to determine a possible 1 day delay of the -ray emission with respect to the optical one.
-
•
The extraordinary optical activity (lasting less than 3 hours), observed on December 12 has a counterpart in the -ray data. A possible delay between the -ray emission and the optical one is constrained within 12 hours.
-
•
We found that a leptonic model with an External Compton on seed photons from disk and BLR does not succeed to account for both the “hardeness” of the -ray spectrum and the “softness” of the Synchrotron emission, requiring an additional component. We argued that a possible candidate for it is the hot Corona ( K) surrounding the disk.
References
- Anderhub et al. (2009) Anderhub, H., et al. 2009, A&A, 498, 83
- Barthelmy et al. (2005) Barthelmy, S. D., et al. 2005, Space Science Reviews, 120, 143
- Bertin & Arnouts (1996) Bertin, E., & Arnouts, S. 1996, A&AS, 117, 393
- Bonning et al. (2009) Bonning, E. W., et al. 2009, ApJ, 697, L81
- Burrows et al. (2005) Burrows, D. N., et al. 2005, Space Science Reviews, 120, 165
- Celotti et al. (2007) Celotti, A., Ghisellini, G., & Fabian, A. C. 2007, MNRAS, 375, 417
- Conconi et al. (2004) Conconi, P., et al. 2004, in Presented at the Society of Photo-Optical Instrumentation Engineers (SPIE) Conference, Vol. 5492, Society of Photo-Optical Instrumentation Engineers (SPIE) Conference Series, ed. A. F. M. Moorwood & M. Iye, 1602–1612
- Edelson & Krolik (1988) Edelson, R. A., & Krolik, J. H. 1988, ApJ, 333, 646
- Fermi/LAT Collaboration: A. A. Abdo (2009) Fermi/LAT Collaboration: A. A. Abdo. 2009, arXiv:0904.4280
- Ghisellini et al. (1998) Ghisellini, G., Celotti, A., Fossati, G., Maraschi, L., & Comastri, A. 1998, MNRAS, 301, 451
- Ghisellini et al. (2007) Ghisellini, G., Foschini, L., Tavecchio, F., & Pian, E. 2007, MNRAS, 382, L82
- Giommi et al. (2006) Giommi, P., et al. 2006, A&A, 456, 911
- González-Pérez et al. (2001) González-Pérez, J. N., Kidger, M. R., & Martín-Luis, F. 2001, AJ, 122, 2055
- Hill et al. (2004) Hill, J. E., et al. 2004, in Presented at the Society of Photo-Optical Instrumentation Engineers (SPIE) Conference, Vol. 5165, Society of Photo-Optical Instrumentation Engineers (SPIE) Conference Series, ed. K. A. Flanagan & O. H. W. Siegmund, 217–231
- Houck et al. (2004) Houck, J. R., et al. 2004, ApJS, 154, 18
- Hufnagel & Bregman (1992) Hufnagel, B. R., & Bregman, J. N. 1992, ApJ, 386, 473
- Katarzyński & Ghisellini (2007) Katarzyński, K., & Ghisellini, G. 2007, A&A, 463, 529
- Kokubun et al. (2007) Kokubun, M., et al. 2007, PASJ, 59, 53
- Koyama et al. (2007) Koyama, K., et al. 2007, PASJ, 59, 23
- Labanti et al. (2009) Labanti, C., et al. 2009, Nuclear Instruments and Methods in Physics Research A, 598, 470
- Mattox et al. (1996) Mattox, J. R., et al. 1996, ApJ, 461, 396
- Mitsuda et al. (2007) Mitsuda, K., et al. 2007, PASJ, 59, 1
- Perotti et al. (2006) Perotti, F., Fiorini, M., Incorvaia, S., Mattaini, E., & Sant’Ambrogio, E. 2006, Nuclear Instruments and Methods in Physics Research A, 556, 228
- Peterson et al. (1998) Peterson, B. M., Wanders, I., Horne, K., Collier, S., Alexander, T., Kaspi, S., & Maoz, D. 1998, PASP, 110, 660
- Pian et al. (2006) Pian, E., et al. 2006, A&A, 449, L21
- Prest et al. (2003) Prest, M., Barbiellini, G., Bordignon, G., Fedel, G., Liello, F., Longo, F., Pontoni, C., & Vallazza, E. 2003, Nuclear Instruments and Methods in Physics Research A, 501, 280
- Raiteri et al. (2008a) Raiteri, C. M., et al. 2008a, A&A, 485, L17
- Raiteri et al. (1998) Raiteri, C. M., Villata, M., Lanteri, L., Cavallone, M., & Sobrito, G. 1998, A&AS, 130, 495
- Raiteri et al. (2008b) Raiteri, C. M., et al. 2008b, A&A, 491, 755
- Raiteri et al. (2007) —. 2007, A&A, 473, 819
- Raiteri et al. (2003) —. 2003, A&A, 402, 151
- Roming et al. (2005) Roming, P. W. A., et al. 2005, Space Science Reviews, 120, 95
- Schlegel et al. (1998) Schlegel, D. J., Finkbeiner, D. P., & Davis, M. 1998, ApJ, 500, 525
- Serlemitsos et al. (2007) Serlemitsos, P. J., et al. 2007, PASJ, 59, 9
- Sikora et al. (2008) Sikora, M., Moderski, R., & Madejski, G. M. 2008, ApJ, 675, 71
- Sokolov et al. (2004) Sokolov, A., Marscher, A. P., & McHardy, I. M. 2004, ApJ, 613, 725
- Stetson (1987) Stetson, P. B. 1987, PASP, 99, 191
- Takahashi et al. (2007) Takahashi, T., et al. 2007, PASJ, 59, 35
- Tavani et al. (2008) Tavani, M., et al. 2008, Nuclear Instruments and Methods in Physics Research A, 588, 52
- Tavani et al. (2009) —. 2009, A&Ain press, arXiv:0807.4254
- Tavecchio & Ghisellini (2008) Tavecchio, F., & Ghisellini, G. 2008, MNRAS, 386, 945
- Tavecchio et al. (2002) Tavecchio, F., et al. 2002, ApJ, 575, 137
- Tosti et al. (2004) Tosti, G., et al. 2004, in Presented at the Society of Photo-Optical Instrumentation Engineers (SPIE) Conference, Vol. 5492, Society of Photo-Optical Instrumentation Engineers (SPIE) Conference Series, ed. A. F. M. Moorwood & M. Iye, 689–700
- Tosti et al. (2008) Tosti, G., Chiang, J., Lott, B., Do Couto E Silva, E., Grove, J. E., & Thayer, J. G. 2008, The Astronomer’s Telegram, 1628, 1
- Tzeferacos et al. (2009) Tzeferacos, P., Ferrari, A., Mignone, A., Bodo, G., & Massaglia, S. P. 2009, accepted for publication in MNRAS
- Vercellone et al. (2008) Vercellone, S., et al. 2008, ApJ, 676, L13
- Vercellone et al. (2009) —. 2009, ApJ, 690, 1018
- Villata et al. (2007) Villata, M., et al. 2007, A&A, 464, L5
- Villata et al. (2006) —. 2006, A&A, 453, 817
- Werner et al. (2004) Werner, M. W., et al. 2004, ApJS, 154, 1
- Zerbi et al. (2004) Zerbi, F. M., et al. 2004, in Presented at the Society of Photo-Optical Instrumentation Engineers (SPIE) Conference, Vol. 5492, Society of Photo-Optical Instrumentation Engineers (SPIE) Conference Series, ed. A. F. M. Moorwood & M. Iye, 1590–1601


| Observation | NH | Flux 0.3-10 keV | Flux 2-10 keV | Spectral slope | /d.o.f. |
|---|---|---|---|---|---|
| date | 1022 cm-2 | erg cm-2 s-1 | erg cm-2 s-1 | ||
| 13-Dec-2007 | 1.28/54 | ||||
| 15-Dec-2007 | 1.14/44 |
| Observation Date | B (Gauss) | R (cm) | K (cm-3) | |||||
|---|---|---|---|---|---|---|---|---|
| 5-Dec-2007 | 18 | 2.5 | 50 | 30 | 2.3 | 4.2 | ||
| 13-Dec-2007 | 18 | 2 | 52 | 38 | 2.3 | 4.2 | ||
| 15-Dec-2007 | 18 | 2 | 52 | 35 | 2.3 | 4.2 |