22email: missing{jan.treibig,georg.hager,gerhard.wellein}@rrze.uni-erlangen.de
Multi-core architectures: Complexities of performance prediction and the impact of cache topology
Abstract
The balance metric is a simple approach to estimate the performance of bandwidth-limited loop kernels. However, applying the method to in-cache situations and modern multi-core architectures yields unsatisfactory results. This paper analyzes the influence of cache hierarchy design on performance predictions for bandwidth-limited loop kernels on current mainstream processors. We present a diagnostic model with improved predictive power, correcting the limitations of the simple balance metric. The importance of code execution overhead even in bandwidth-bound situations is emphasized. Finally we analyze the impact of synchronization overhead on multi-threaded performance with a special emphasis on the influence of cache topology.
1 Introduction
Many algorithms are limited by bandwidth, meaning that the memory subsystem cannot provide the data as fast as the arithmetic core could process it. One solution to this problem is to introduce multi-level memory hierarchies with low-latency and high-bandwidth caches, which exploit spatial and (hopefully) temporal locality in an application’s data access pattern. In many scientific algorithms the bandwidth bottleneck is still severe, however. A popular way to estimate the performance in such situations is the memory bandwidth balance metric schoenauer . This metric can estimate loop kernel performance very well on vector systems and previous generations of cache-based processors. We will show why the balance model fails on recent processors (Intel Nehalem) and for in-cache situations. To overcome these limitations we introduce a diagnostic performance model based on the real cache architectures and data transfer paths. The application of the model is demonstrated on elementary data transfer operations (load, store and copy operations) and benchmarked on three x86-type test machines. In addition, as a prototype for many streaming algorithms we use the STREAM triad , which matches the performance characteristics of many real algorithms jalby . We show multi-threaded bandwidth measurements on shared caches, providing valuable data on saturation effects.
Besides the limitations of shared outer-level caches and main memory bandwidth, another important issue can influence multi-threaded performance: synchronization overhead. We present measurements investigating the influence of cache topology, threading implementations, different OpenMP implementations and thread count on synchronization overhead.
This paper is organized as follows. Section 2 gives an overview on the microarchitectures and technical specifications of the test machines. In Section 3 we first present the original balance model as introduced in schoenauer and demonstrate its limitations, using a simple vector triad and a Jacobi relaxation solver. We then use a thorough analysis of cache hierarchies to develop our diagnostic model and elaborate on in-cache saturation effects that may harm multi-threaded performance. In Section 4 we finally pinpoint synchronization overheads on shared and separate caches.
2 Experimental test bed
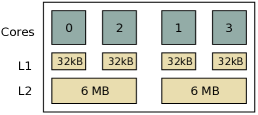
An overview of the machines used for benchmarking can be found in Table 1. As representatives of current x86 architectures we have chosen Intel’s “Core 2 Quad” and “Core i7” processors. The cache group structure, i.e., which cores share caches of what size, is illustrated in Figure 1. For detailed information about microarchitecture and cache organization, see the Intel IntelOpt Optimization Handbook.
Note that we will utilize two-socket variants of those systems in Section 4, which are however very similar on the one-socket level.
| Core 2 | Nehalem | |
| Intel Core2 Q9550 | Intel i7 920 | |
| Execution Core | ||
| Clock [GHz] | 2.83 | 2.67 |
| Throughput | 4 ops | 4 ops |
| Peak FP rate MultAdd | 4 flops/cycle | 4 flops/cycle |
| L1 Cache | 32 kB | 32 kB |
| Parallelism | 4 banks, dual ported | 4 banks, dual ported |
| L2 Cache | 2x6 MB (inclusive) | 4x256 KB |
| L3 Cache (shared) | - | 8 MB (inclusive) |
| Main Memory | DDR2-800 | DDR3-1066 |
| Channels | 2 | 3 |
| Memory clock [MHz] | 800 | 1066 |
| Bytes/ clock | 16 | 24 |
| Bandwidth [GB/s] | 12.8 | 25.6 |
| STREAM triad 1 thread [GB/s] | 6.8 | 13.9 |
| STREAM triad node [GB/s] | 7.1 | 22.2 |
3 Bandwidth
3.1 Memory Bandwidth Balance Model
The balance metric schoenauer sets into relation the number of data words a processor can transfer from memory to the number of arithmetic operations it can execute. This relation is also referred to as “machine balance”, . The “algorithmic balance” is the ratio between the number of words a given algorithm needs per iteration to the number of arithmetic operations it performs with this data. The expected efficiency (fraction of peak performance) of the algorithm on a certain machine is then determined by the relationship .
3.2 Limitations of the Memory Balance Model
In-cache Triad on the Core 2 architecture
Even though the balance model was initially proposed for the memory domain, at a first glance it seems to be worthwhile to also apply it to cache-bound algorithms. As an example the STREAM triad on a Core 2 processor with 2.83 GHz is considered. The L2 cache on the Core 2 has a 32-byte wide bus to the L1 cache and runs with full clock speed. This results in a theoretical bandwidth of 90.56 GBytes/s. The machine balance for the L2 cache is Words/Flop. The algorithmic balance for the STREAM triad is Words/Flop. The expected efficiency is then , resulting in a prediction of 7.47 GFlops/s. However, measurements in the L2 domain yield only 1.99 GFlops/s. Part of the discrepancy can be explained by the fact that Intel processors use a write allocate strategy for stores. Therefore a more accurate prediction has to take into account the additional read for ownership (RFO) for every store miss, resulting in an algorithmic balance of Words/Flop. Now , resulting in a prediction of 5.66 GFlops/s, still too large by a long shot.
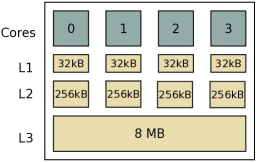
The reason why the balance metric fails for the in-cache case is that it assumes that runtime is solely made up of the data transfers from the L2 cache. Still in reality runtime is the sum of the cycles it takes to execute the instructions with data located in the L1 cache and the cycles it takes to load cachelines from L2 to L1 cache. These contributions cannot overlap, since either the core’s execution units or the cache controller can access the L1 cache at any given time. An analysis of the runtime contributions is shown in Figure 2. The analysis yields 16 cycles for a cacheline update, while we measure 22.72 cycles. The difference is caused by the data access latencies of the L2 cache. From the architectural specifications, one would expect a latency of about 14 cycles, but the Core 2 processor has a L2 to L1 hardware prefetcher, which is able to limit the overhead to six cycles for four transferred cachelines.
Jacobi smoother on the Nehalem architecture
The stencil scheme for the Jacobi smoother uses an eight-point update operation datta08 (Listing 1).
This variant of the Jacobi smoother in three dimensions performs eight flops per update (six additions and two multiplication). The Nehalem node described in Section 2 was used for the benchmarks. It is important to note that peak performance on this architecture can only be achieved with an equal distribution between additions and multiplications and full usage of packed SSE instructions. The peak main memory bandwidth is 25.6 GBytes/s or 3.2 double precision GWords/s. This results in a machine balance of Words/Flop. This value is often considered as an upper limit for memory-bound performance. At an algorithmic balance Words/Flop a performance of 3192 MFlops/s can be expected. In certain cases this can be within reasonable range of real measurements. However, this is pure coincidence and caused by a cancellation of two effects: The large memory bandwidth of the Nehalem architecture as compared to L3 performance, and our ignorance towards the real runtime contributions and data streams that have to be sustained from memory. As will be shown in the following, care must be taken that the model is applied in a sensible way.
The machine balance based on peak properties considers upper limits which cannot be reached even in the theoretical case by the Jacobi algorithm. It is necessary to adapt the machine balance to the algorithm under consideration. A more realistic estimate is to consider the peak performance for the present arithmetic instruction mix and the sustained single-threaded main memory performance of the STREAM triad benchmark (as listed in Table 1). This results in a new machine balance of Words/Flop. The initial algorithmic balance is based on the properties of the Jacobi stencil update, but can be significantly wrong on cache-based processors. Here the size of the grid determines how many streams have to be loaded from main memory. As we consider the balance model in the main memory domain, only the streams to memory must be taken into account.
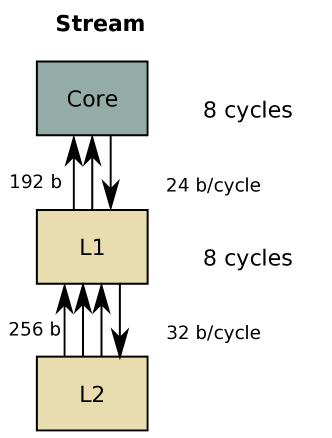
Depending on cache capacity, the data can be kept inside the caches between multiple loads or is already evicted to memory. This is illustrated in Figure 3 using a 2D Jacobi algorithm. In three dimensions the following cases can be distinguished:
-
•
If six grid rows (inner dimension) do not fit into the outer-level cache, this results in six data streams from memory. This is the worst case scenario.
-
•
If four planes do not fit into the outer-level cache, four streams have to be loaded.
-
•
With four complete planes fitting into cache only two streams have to come from memory.
The resulting machine balance and performance prediction based on the balance metric is illustrated in Table 2 in the second and third columns. In the last column measured performance is shown. It can be seen that for six and four streams the prediction is accurate while for two streams the performance is overestimated. This indicates that the simple balance model, while accurate for situations with high pressure on the memory subsystem, fails when many loads come from the outer-level cache. The first two cases are unusual cases as only in rare cases four planes do not fit in the large 8 MB L3 cache. Note that the Jacobi kernel was implemented in assembly language without using non-temporal store instructions.
| streams (with RFO) | predicted | measured | ||
|---|---|---|---|---|
| 6 (7) | 0.875 | 0.299 | 1988 | 1760 (88 %) |
| 4 (5) | 0.625 | 0.419 | 2786 | 2524 (90 %) |
| 2 (3) | 0.375 | 0.699 | 4648 | 3024 (65 %) |
A more realistic analysis of the Jacobi algorithm will be performed in Section 3.3, revealing the exact reasons for the balance metric failing in certain situations. The main assumption of the balance metric is that the contribution of in-cache data transfers and the execution of the instructions can be neglected against the time required to transfer the data from memory. The STREAM triad results (see Table 1) are used as the memory bandwidth component in the machine balance. The triad has a certain relation between runtime spent on-chip and runtime used to transfer data from main memory. In case of the Jacobi algorithm this relation is different and also depends on the ratio between the number of data streams toward main memory and cache.
Using the STREAM triad as the absolute limit for memory performance is only justified for kernels which have similar on-chip contributions to overall runtime, or on systems with very bandwidth-starved memory access. The latter is not the case on the Nehalem architecture as will be shown in Section 3.3.
3.3 Diagnostic performance model for bandwidth-limited loop kernels
The conclusions drawn from the simple kernel benchmarks in Section 3.2 will now enable us to develop a diagnostic model for loop kernels. This model proposes an iterative approach to analytically predict the performance of bandwidth-limited algorithms in all memory hierarchy levels. The basic building block of a streaming algorithm is its computational kernel in the inner loop body. Since all loads and stores come from and go to L1 cache, the kernel’s execution time on a cacheline basis is governed by the maximum number of L1 load and store accesses per cycle and the capability of the pipelined, superscalar core to execute instructions. All lower levels of the memory hierarchy are reduced to their bandwidth properties, with data paths and transfer volumes based on the real cache architecture. The minimum transfer size between memory levels is one cacheline.
Based on the transfer volumes and bandwidths, the total execution time per cacheline is obtained by adding all contributions from data transfers between caches and kernel execution times in L1. To lowest order, we assume that there is no access latency (i.e., all latencies can be effectively hidden by software pipelining and prefetching) and that the different components of overall execution time do not overlap.
It must be stressed that a correct application of this model requires an intimate knowledge of cache architecture and data paths. This information is available from processor manufacturers IntelOpt , but sometimes the level of detail is insufficient for fixing all parameters, and relevant information must be inferred from measurements.
Theoretical Analysis
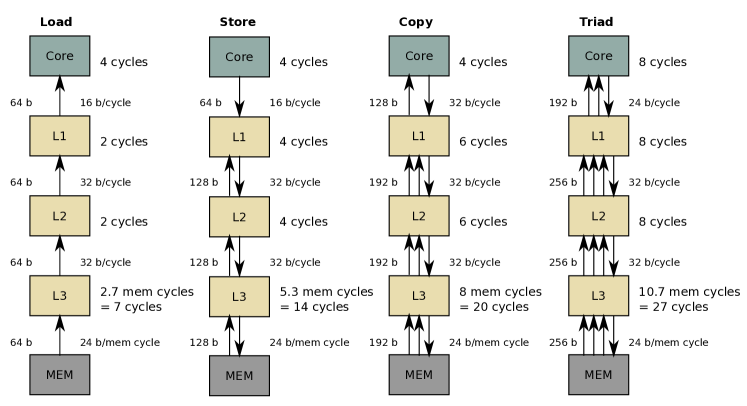
In this section we substantiate the model outlined above by providing the necessary architectural details for current Intel processors. Using simple kernel loops, we derive performance predictions which will be compared to actual measurements in the following section. All results are given in CPU cycles per cacheline; if streams are processed in the kernel, the number of cycles denotes the time required to process one cacheline per stream.
As mentioned earlier, basic data operations in L1 cache are limited by cache bandwidth, which is determined by the load and store instructions that can execute per cycle. The Intel cores can retire one 128-bit load and one 128-bit store in every cycle. L1 bandwidth is thus limited to 16 bytes per cycle if only loads (or stores) are used, and reaches its peak of 32 bytes per cycle only for a copy operation.
For load-only and store-only kernels, there is only one data stream, i.e., exactly one cacheline is processed at any time. With copy and stream triad kernels, this number increases to two and three, respectively. Together with the execution limits described above it is possible to predict the number of cycles needed to execute the instructions necessary to process one cacheline per stream (see the “L1” columns in Table 3).
| L1 | L2 | L3 | Memory | ||||
|---|---|---|---|---|---|---|---|
| A | B | A | B | B | A | B | |
| Load | 4 | 4 | 6 | 6 | 8 | 20 | 15 |
| Store | 4 | 4 | 8 | 8 | 12 | 36 | 26 |
| Copy | 4 | 4 | 10 | 10 | 16 | 52 | 36 |
| Triad | 8 | 8 | 16 | 16 | 24 | 72 | 51 |
L2 cache bandwidth is influenced by three factors: (i) the finite bus width between L1 and L2 cache for refills and evictions, (ii) the fact that either ALU access or cache refill can occur at any one time, and (iii) the L2 cache access latency. Both architectures have a 256-bit bus connection between L1 and L2 cache and use a write back and write allocate strategy for stores. In case of an L1 store miss, the cacheline is first moved from L2 to L1 before it can be updated (write allocate). Together with its later eviction to L2, this results in an effective bandwidth requirement of 128 byte per cacheline write miss update.
On Intel processors, a load miss incurs only a single cacheline transfer from L2 to L1, because the cache hierarchy is inclusive. The Core i7 L2 cache is not strictly inclusive, but for the benchmarks covered here (no cacheline sharing and no reuse) an inclusive behavior was assumed due to the lack of detailed documentation about the L2 cache.
The overall execution time of the loop kernel on one cacheline per stream is the sum of (i) the time needed to transfer the cacheline(s) between L2 and L1 and (ii) the runtime of the loop kernel in L1 cache. Table 5 shows the different contributions for pure load, pure store, copy and triad operations on Intel processors. Looking at, e.g., the copy operation, the model predicts that only 6 cycles out of 10 can be used to transfer data from L2 to L1 cache. The remaining 4 cycles are spent with the execution of the loop kernel in L1. This explains the well-known performance breakdown for streaming kernels when data does not fit into L1 any more, although the nominal L1 and L2 bandwidths are identical. All results are included in the “L2” columns of Table 3.
Not much is known about the L3 cache architecture on Intel Core i7. It can be assumed that the bus width between the caches is 256 bits, which was confirmed by our measurements. Our model assumes a strictly inclusive cache hierarchy for the Intel designs, in which L3 cache is “just another level”. Under these assumptions, the model can predict the required number of cycles in the same way as for the L2 case above. The “L3” column in Table 3 show the results.
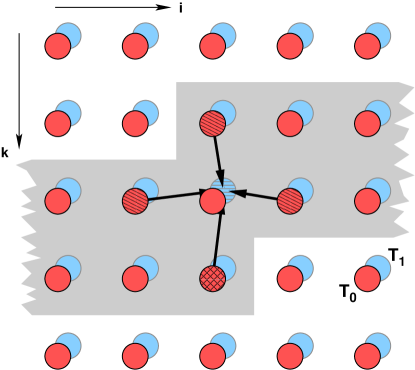
If data resides in main memory, we again assume a strictly hierarchical (inclusive) data load on Intel processors. The cycles for main memory transfers are computed using the effective memory clock and bus width and are converted into CPU cycles. For consistency reasons, non-temporal (“streaming”) stores were not used for the main memory regime. Data transfer volumes and rates, and predicted cycles for a cacheline update are illustrated in Figure 4. They are also included in the “Memory” columns of Table 3.
Measurements
Measured cycles for a cacheline update, the ratio of predicted versus measured cycles, and the real and effective bandwidths are listed in Table 4 for Load, Store, Copy and Triad benchmarks. Here, “effective bandwidth” means the bandwidth available to the application, whereas “real bandwidth” refers to the actual data transfer taking place. For every layer in the hierarchy the working set size was chosen to fit into the appropriate level, but not into higher ones. The measurements confirm the predictions of the model well in the L1 regime.
Also the L2 results confirm the predictions. One exception is the store performance of the Intel Core i7, which is significantly better than the prediction. This indicates that the model does not describe the store behavior correctly. At the moment we have no additional information about the L2 behavior on Core i7 to solve this problem. The overhead for accessing the L2 cache with a streaming data access pattern scales with the number of involved cachelines, as can be derived from a comparison of the measured cacheline update cycles in Table 4 and the predictions in Table 3. The highest cost occurs on the Core 2 with 2 cycles per cacheline for the triad, followed by Shanghai with 1.5 cycles per cacheline. Core i7 has a very low L2 access overhead of 0.5 cycles per cache line. Still, all Core i7 results must be interpreted with caution until the L2 behavior can be predicted correctly by a revised model. Both architectures are good at hiding cache latencies for streaming patterns.
On Core i7 the behavior with regard to the L3 cache is similar to the L2 results: The store result is better than the prediction, which influences all other test cases involving a store. It is obvious that the Core i7 applies an unknown optimization for write allocate operations.
| L1 | L2 | L3 | Memory | |||||||||||||
|---|---|---|---|---|---|---|---|---|---|---|---|---|---|---|---|---|
| Load | Store | Copy | Triad | Load | Store | Copy | Triad | Load | Store | Copy | Triad | Load | Store | Copy | Triad | |
| Core 2 [%] | 96.0 | 93.8 | 92.7 | 99.5 | 83.1 | 94.1 | 74.9 | 70.4 | 67.6 | 49,9 | 58.7 | 66.6 | ||||
| CL update | 4.17 | 4.26 | 4.31 | 8.04 | 7.21 | 8.49 | 13.34 | 22.72 | 29.60 | 72.04 | 88.61 | 108.15 | ||||
| GB/s | 43.5 | 42.5 | 84.1 | 67.7 | 25.1 | 42.7 | 40.7 | 31.9 | 6.1 | 5.0 | 6.1 | 6.7 | ||||
| eff. GB/s | - | - | - | - | - | 21.3 | 27.2 | 23.9 | - | 2.5 | 4.1 | 5.0 | ||||
| Nehalem [%] | 97.1 | 95.3 | 94.1 | 96.0 | 83.5 | 120.9 | 91.4 | 91.7 | 95.3 | 121.4 | 103.9 | 96.3 | 106.8 | 142.2 | 123 | 119.4 |
| CL update | 4.12 | 4.20 | 4.26 | 8.34 | 7.18 | 6.61 | 10.94 | 17.45 | 8.39 | 9.88 | 15.4 | 24.91 | 14.02 | 18.27 | 29.25 | 42.72 |
| GB/s | 41.3 | 40.5 | 79.8 | 61.2 | 23.7 | 51.5 | 46.7 | 39.0 | 20.3 | 34.4 | 33.2 | 27.3 | 12.1 | 18.6 | 17.4 | 15.9 |
| eff. GB/s | - | - | - | - | - | 25.7 | 31.1 | 29.3 | - | 17.2 | 22.1 | 20.5 | - | 9.3 | 11.6 | 11.9 |
As for main memory access, one must distinguish between the classic frontside bus concept as used with all Core 2 designs, and the newer architectures with on-chip memory controller. The former has much larger overhead, which is why Core 2 shows mediocre efficiencies of around 60 %. The Core i7 shows results better than the theoretical prediction on all memory levels except L1. This might be caused either by a potential overlap between the different contributions (which is ignored by our model), or by deficiencies in the model caused by insufficient knowledge about the details of data paths inside the cache hierarchy.
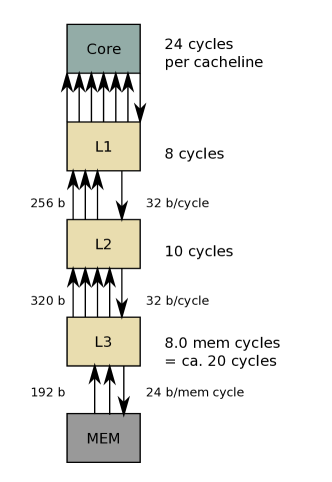
Application to the Jacobi smoother on Nehalem
An analysis of the Jacobi algorithm is shown in Figure 5. The prediction based on this analysis for the case with three data streams to memory is 2745 MFlops/s, while we measure 3024 MFlops/s. It must be noted that two important details on the Nehalem processor are not documented: First, measurements show that runtime is overestimated if an RFO transfer from L2 to L1 is assumed for each store miss. This issue was already taken into account in the model analysis in Figure 5, and indicates that the L1/L2 hierarchy is not accurately described by a simple inclusive structure. Second, the possibility to overlap data transfers in different hierarchy levels is neglected in our model. The measured performance indicates that our prediction overestimates the time required by a cacheline update by six cycles. Since these predictions were based on bandwidth capabilities we must conclude that indeed the cache hierarchy allows an overlap between data transfers and execution of the instructions from L1 cache.
Finally, the comparison between the model predictions and the measured performance show that on the Nehalem architecture it is a good approximation for stream-oriented algorithms to neglect data access latencies.
3.4 Bandwidth saturation with shared caches
Shared caches are the “glue” holding together today’s multi-core architectures. While shared caches allow very fast data exchange and synchronization between cores, one possible drawback is that all cores share the bandwidth.
In order to measure the bandwidth saturation behavior of the shared caches, a special version of a Load and Copy benchmark was implemented which only loads and/or copies one 4-byte item per cacheline. This minimizes the influence of instruction execution in the core and runtime is reduced to the pure data transfers between cache hierarchies. The Core 2 and Core i7 systems described in Section 2 were used for all measurements.
The runtime for running the single-threaded loop kernel in the L1 domain was chosen as the baseline. Although both CPUs are quite similar on this level, an important difference is that the L1 cache of Core 2 has a lower latency than on Nehalem (see Table 5). From an architectural point of view it should always be possible to execute the loop body in one cycle, a target which both systems miss by a considerable amount. This is, however, not unusual for very small loop bodies with high instruction throughput.
Nehalem has less overhead for transfers between L1 and L2, saving 1 cycle per cacheline against Core 2 for pure loads, and almost 3 cycles for copies. This indicates a more efficient prefetching mechanism from L2 to L1 than on Core 2. L2 performance on Nehalem is in certain cases better than predicted based on the bandwidth capabilities (at least 4 cycles for Load and 10 cycles for Copy as indicated in Figure 4), suggesting that the data paths on this level are not fully understood yet.
Running two threads on separate L2 domains, both processors scale as expected because there is no shared bandwidth. On a shared L2 (only possible with Core 2), the Load benchmark on Core 2 loses about 1.2 cycles on average per cacheline versus the non-shared case (note that measurements indicate that the overhead roughly scales with the number of transferred cachelines). For the shared Copy benchmark the loss is nearly 4 cycles. Core 2 has a theoretical transfer limit of 32 bytes/cycle between L2 and L1, which results in a bandwidth of 90.56 GB/s on our test machine. Translating the cycle measurements to effective bandwidths, it turns out that one thread cannot saturate the L2 bus: It achieves 36.6 GB/s for Load and 44.2 GB/s (including RFO) for Copy. With two threads on the shared cache, these numbers increase to 57.4 GB/s and 63.3 GB/s, respectively. Hence, although there is some headroom for providing additional bandwidth from L2 to the second core, scalability is far from perfect. It would thus not make sense to have a Core 2 design with more than two cores on a shared L2.
An additional third cache level can decouple loads and stores from L3-L2 refills and enlarge the time slots available to transfer data from the L3 cache for each core. However, a large L3 cache usually has larger latencies as well. Nehalem compensates this by very effective prefetchers which achieve L3 bandwidths similar to (if not better than) the L2 cache on Core 2. Our measurements show that Nehalem’s L3 can fully scale up to two cores for Copy and to three cores for Load, with considerable headroom for an additional core. It reaches its peak L3 bandwidth at 85 GB/s (Load) and 63 GB/s (Copy). Latency effects cannot be detected, suggesting that Nehalem overlaps transfers between L3 and L2 with the execution of loads and stores from L1.
| Core 2 | Core i7 | |||
| Load | Copy | Load | Copy | |
| L1 1 thread | 1.45 | 2.25 | 2.21 | 2.24 |
| L2 1 thread | 4.95 | 12.29 | 3.85 | 9.47 |
| L2 2 threads non-shared | 4.97 | 13.01 | 3.82 | 9.51 |
| L2 2 threads shared | 6.31 | 17.16 | - | - |
| L3 1 thread | - | - | 5.26 | 14.98 |
| L3 2 threads shared | - | - | 5.33 | 16.86 |
| L3 3 threads shared | - | - | 6.05 | 24.48 |
| L3 4 threads shared | - | - | 8.01 | 33.35 |
4 Synchronization effects in multi-core environments
An elementary component in many multi-threaded algorithms is synchronization between different threads. Commonly, a barrier is used to ensure synchronized execution. The available x86 multi-core processors have no hardware support for synchronization primitives, hence software solutions are required. Depending on the granularity of synchronization, this can incur significant overhead, as will be shown in the following.
We compare three different options for barrier synchronization:
-
•
The OpenMP barrier (Intel icc 11.0 and GNU gcc 4.3.3 compiler). The barrier benchmark contained in the EPCC OpenMP Microbenchmarks V2.0 bull was used for this.
-
•
The pthread (NPTL 2.9) barrier.
-
•
A spin-waiting loop, implemented following the guidelines from the Intel Optimization Handbook IntelOpt and using dedicated cachelines for all synchronization variables.
The original EPCC code was endowed with cycle-accurate timing. An equivalent benchmark was implemented for the pthread and spin-waiting loop variants.
Note that we mainly present measured results here, to be used as guidelines when estimating synchronization overheads on the architectures and software environments under consideration. Without intimate knowledge about the underlying OpenMP and pthread implementations, it is next to impossible to find the exact reasons for the deviations observed.
4.1 Two threads on a shared cache
The first case we consider is the interaction of two threads sharing a cache. Table 6 shows the complete results.
On a Core 2-based quad-core processor (see Section 2) the spin
waiting loop needs 231 cycles to synchronize the two threads. The Intel OpenMP
implementation is significantly slower (399 cycles). In contrast, the
pthread barrier and the OpenMP implementation provided by gcc are around 60
times slower, both taking over 20000 cycles per synchronization. (Thus gcc can
be expected to provide especially low performance on code with relatively short
parallel loops or regions because of the implicit barriers imposed by OpenMP.)
A look in the source code of both the NPTL pthread and gcc OpenMP
implementation reveals that both rely on the futex system
call futex .
| Intel Q9550 (sh. L2) | Intel i7 920 (sh. L3) | |
|---|---|---|
| pthreads_barrier_wait | 23739 | 6511 |
| omp barrier (icc 11.0) | 399 | 469 |
| omp barrier (gcc 4.3.3) | 22603 | 7333 |
| spin waiting loop | 231 | 270 |
On the Core i7 the results for the spin waiting loop and the Intel OpenMP
barrier are slightly worse than on Core 2. On the other hand, the pthread
and gcc OpenMP barriers improve to around 7000 cycles, reducing the difference
to a factor of 14. The reason for this discrepancy could be that pthread and
gcc barrier overhead are dominated by the inefficient futex mechanism,
while the more efficient Intel OpenMP and spin waiting loops sense the slightly
larger cache latencies on Nehalem as compared to Core 2.
In summary, Intel’s OpenMP barrier implementation provides reasonable synchronization performance on a shared cache, and is only outperformed by an optimized spin wait. Pthread and gcc OpenMP barriers appear to use a very inefficient underlying mechanism.
4.2 Cache and node topology
Placing two threads on cores with separate caches and/or separate sockets measures the influence of node topology. The results are shown in Table 7. Note that these tests were conducted on dual-socket machines. From now on we omit results for the gcc barrier because it uses the same underlying mechanism as pthread, and the performance results are very similar. Note that the pthread results cannot be compared to the results in the previous section. Because of the complex influences of the kernel and the pthread library results on different machines (even with the same processor architecture) show a large variance in the results.
For the Core 2 architecture, good results are achieved by the Intel OpenMP implementation with 576 cycles on a shared cache, 760 cycles on one socket, and 1269 cycles on different sockets. The pthread barrier, apart from being much less efficient even on the shared cache, loses a factor of four if the threads run in separate caches. While the spin waiting loop reaches the best overall result on a shared cache and on separate caches inside a socket, a striking performance loss occurs on different sockets.
| Intel Xeon E5420 | shared L2 cache | same socket | different socket |
|---|---|---|---|
| pthreads_barrier_wait | 5863 | 27032 | 27647 |
| omp barrier (icc 11.0) | 576 | 760 | 1269 |
| spin waiting loop | 259 | 485 | 11602 |
| Intel Nehalem | SMT threads | shared L3 cache | different socket |
| pthreads_barrier_wait | 23352 | 4796 | 49237 |
| omp barrier (icc 11.0) | 2761 | 479 | 1206 |
| spin waiting loop | 17388 | 267 | 787 |
On the Nehalem architecture the behavior of the pthread barrier and Intel OpenMP is comparable to Core 2. Note that the spin waiting loop is relatively efficient on separate sockets with 787 cycles, probably because cachelines can be exchanged directly across the QuickPath link without explicit eviction to memory. The influence of simultaneous multi-threading (SMT) is of special interest, so we also considered synchronization between two threads on the same physical core but different logical cores. There are already considerable penalties for both the Intel OpenMP and pthread barriers (about a factor of 6), but the spin waiting loop loses a factor of 65 because of severe resource contention between the SMT threads. This effect is well-known from former SMT implementations (called “Hyper-Threading” on Pentium 4 processors).
In summary, again the Intel OpenMP barrier yields satisfactory average performance across all topology variants on Core 2. Our spin wait loop, while outperforming Intel on one socket, obviously misses an important optimization aspect when synchronizing different sockets. On the other hand, the Nehalem architecture seems to be well suited for spin-waiting, except when running threads on the same physical core, which is, to varying degree, never a good idea, regardless of the synchronization method. If SMT must be used, Intel’s OpenMP barrier is clearly the best solution. An possible solution to the low SMT and dual socket performance of the spin waiting loop is to replace the spin loop with a mechanism which senses the synchronization objects of other cores only every few hundred cycles halting the core in the meantime. This would increase the response time for very short synchronization periods but prevent the problems in the SMT case and for multiple sockets leading to overall more balanced results.
4.3 Barrier cost for many threads
In Table 8 we show the scaling of barrier cost when using all threads on one versus two sockets. On one socket the spin waiting loop achieves best results on both architectures, as could be expected from the two-threads results above. For Core 2 the overhead roughly doubles when including the second socket, but the impact is much larger on Nehalem. However, if threads must be synchronized across the whole node, Intel OpenMP and spin waiting are roughly on par. The former is still dominating, however, if SMT threads are used.
Overall, pthread and gcc OpenMP synchronization are not suited for fine-grained parallelization. For the ease of use and overall balanced results the Intel OpenMP barrier is the preferred solution. The spin waiting loop reaches best results for shared caches but is outperformed on different sockets (Core 2) and SMT threads (Nehalem).
As a rule of thumb, synchronizing all threads in a two-socket node costs of the order of one microsecond. Barriers on SMT threads should be avoided by all means.
| Intel Xeon E5420 | 4 threads | 8 threads | |
|---|---|---|---|
| pthreads_barrier_wait | 31436 | 60664 | |
| omp barrier (icc 11.0) | 1290 | 2040 | |
| spin waiting loop | 1084 | 2761 | |
| Intel Nehalem | 4 threads | 8 threads | 16 threads SMT |
| pthreads_barrier_wait | 10355 | 58577 | 89635 |
| omp barrier (icc 11.0) | 794 | 2373 | 5431 |
| spin waiting loop | 448 | 1915 | 20033 |
5 Conclusion and Outlook
Using single-threaded, stream-based benchmarks and a Jacobi solver, we have demonstrated why performance modeling by a simple balance metric fails for current multi-core architectures (Intel Core 2, Nehalem) and in-cache situations. Based on these results we have introduced a diagnostic performance model, which led to a deeper understanding of runtime contributions in all memory hierarchy levels and finally to more accurate predictions. However, lacking some important details about the covered microarchitectures, up to now not all observed effects can yet be explained by the model.
Using load and copy microbenchmarks, the outer level cache bandwidth scaling behavior was analyzed to answer the question whether shared caches may impose bandwidth bottlenecks. While not all effects on the Nehalem could be explained in-depth it was clearly shown what the differences are between Core 2 and Nehalem and how the shared L3 cache scales in a multi-threaded context for load- and copy-type streaming patterns.
Finally as a major performance-limiting issue for multi-threaded codes synchronization overhead was analyzed. Different synchronization primitives were compared and the influence of cache/node topology and thread count on synchronization overhead was measured. The results may help to decide how to best utilize the complex, hierarchical CPU and node topologies in production environments.
Future work will include a thorough analysis of multi-threaded interleaving effects for shared caches and memory. We will substantiate our findings with performance counter measurements and develop tools which allow even end users to gain a deeper understanding of their applications’ bandwidth behavior.
Acknowledgments
We thank Darren Kerbyson (LANL), Herbert Cornelius (Intel Germany), Michael Meier (RRZE), and Matthias Müller (ZIH) for fruitful discussions. This work was financially supported by the KONWIHR-II project “Omi4papps”.
References
- (1) W. Schönauer: Scientific Supercomputing: Architecture and Use of Shared and Distributed Memory Parallel Computers. Self-edition, Karlsruhe (2000).
- (2) K. Datta, M. Murphy, V. Volkov, S. Williams, J. Carter, L. Oliker, D. Patterson, J. Shalf, K. Yelick: Stencil Computation Optimization and Auto-tuning on State-of-the-Art Multicore Architectures. In: ACM/IEEE (Ed.): Proceedings of the ACM/IEEE SC 2008 Conference (Supercomputing Conference ’08, Austin, TX, Nov 15–21, 2008).
- (3) Intel Corporation: Intel 64 and IA-32 Architectures Optimization Reference Manual. (2008) Document Number: 248966–17.
- (4) W. Jalby, C. Lemuet and X. Le Pasteur: WBTK: a New Set of Microbenchmarks to Explore Memory System Performance for Scientific Computing. International Journal of High Performance Computing Applications, Vol. 18, 211–224 (2004).
- (5) J. M. Bull: Measuring Synchronization and Scheduling Overheads in OpenMP. In Proceedings of First European Workshop on OpenMP, 99–105 (1999)
- (6) U. Drepper: Futexes Are Tricky. http://people.redhat.com/drepper/futex.pdf (2009)