1Dipartimento di Fisica e
Matematica, Università degli Studi dell’Insubria
I-22100, Como, Italy
\address2CNISM, U.d.R. Milano Università, I-20133, Milano, Italy
\address3National Laboratory for Ultrafast and Ultraintense
Optical Science - CNR-INFM, I-22100, Como, Italy
\address2CNISM, U.d.R. Milano Università, I-20133, Milano, Italy
\address4CNISM, U.d.R. Como, I-22100, Como, Italy
\address∗Corresponding author: maria.bondani@uninsubria.it
Photon-number statistics with Silicon photomultipliers
Abstract
We present a description of the operation of a multi-pixel detector in the presence of non-negligible dark-count and cross-talk effects. We apply the model to devise self-consistent calibration strategies to be performed on the very light under investigation.
270.5290, 230.5160, 040.1240
1 Introduction
In the last decade many efforts have been devoted to the development and characterization of photon-number resolving detectors. The motivation stems from the variety of fields of applications: as an example, this kind of devices has already been used in particle physics experiments [1, 2, 3, 4, 5, 6], PET systems [3, 7], biomedical research [8, 9, 10, 11, 12] and atmospheric pollution measurements [13, 14]. Moreover, there are other interesting fields of application in which photon-counting detectors could be exploited, such as LIDAR (light detection and ranging), laser scanning microscopy, and fluorescence correlation spectroscopy [15]. In addition, this class of detectors play a key role in quantum optics as it offers the possibility to characterize nonclassical multiphoton states. In this field they can be considered as a valid alternative to optical homodyne tomography [16] as they can be employed in direct detection schemes [17].
Several concepts and technologies have been proposed that lead to the development of detectors such as visible-light photon counters (VLPC) [18], superconductive transition edge sensors (TES) [19], time-multiplexed detectors [20, 21, 22], hybrid photodetectors (HPD) [23, 24] and Silicon photomultipliers (SiPM) [25]. Irrespective of the concept and design features, these detectors may in general be classified in terms of photon detection efficiency, spectral response, time development of the signal, dead time, and notable photon number resolving capability. As of today, the ideal detector has yet to appear and the optimal choice is application specific.
This paper focuses on SiPMs, detectors featuring unique characteristics that are achieved by a rapidly evolving technology. Silicon photomultipliers consist of a high density (by now limited to cells/mm2) matrix of diodes with a common output. Each diode (or cell) is operated in a limited Geiger-Mueller (GM) regime, in order to achieve gains at the level of . Quenching mechanisms are implemented to avoid establishing self-sustaining discharges. These detectors are sensitive to single photons triggering GM avalanches and can be endowed with a dynamic range well above 100 photons/burst. The photon detection efficiency (PDE) depends on the sensor design and specification, but it may well exceed 60%. Moreover, SiPM are genuine photon-number resolving detectors in that they measure light intensity simply by the number of fired diodes. Compactness, robustness, low cost, low operating voltage, and power consumption are also added values against traditional photodetectors. On the other hand, SiPMs are affected by significant dark count rates (DCR), associated to cells fired by thermally generated charge carriers. Moreover, the GM avalanche development is known to be associated to the generation of photons [26], which may in turn trigger secondary avalanches and result in relevant cross-talk. Whether DCR and cross-talk may be directly measured, it is clear that they are folded in the detector response to any signal and need to be modelled to properly assess the statistical properties of the light field being investigated. This paper reports the experimental validation of two models, on the way to a self-consistent characterization of the SiPM response.
2 Experimental set-up
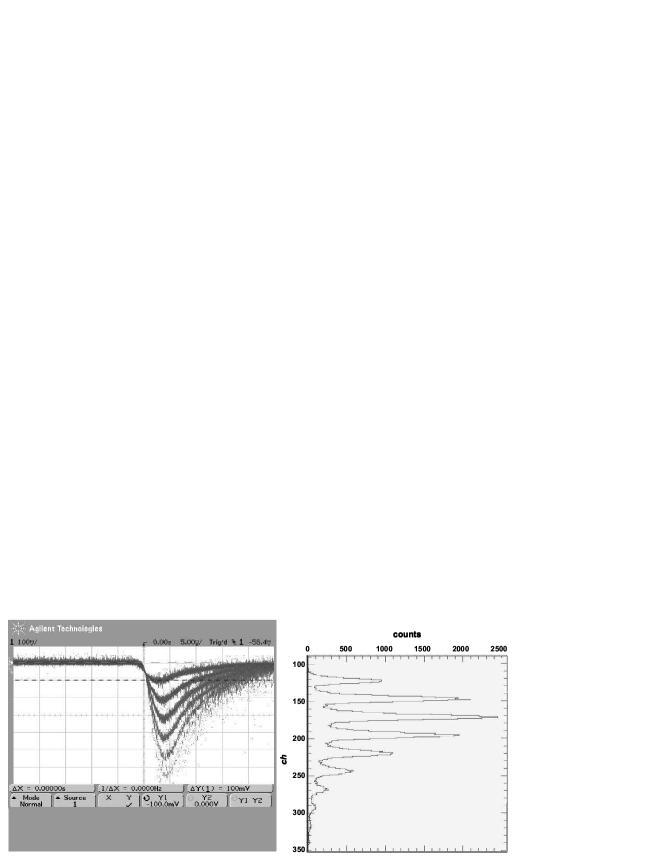
The detector response to a weak light field is shown in Fig. 1(a), featuring the sensor output signal after a high-bandwidth amplifier with a gain of 50. The different bands in the image, obtained in persistency mode, correspond to samples with different numbers of triggered cells, i.e. different numbers of detected photons. The photon-number resolving properties are also clear in Fig. 1(b) that shows the corresponding spectrum as obtained by digitizing the amplified current pulse from the detector over a well defined time window, synchronized to the light pulse. These data and the results reported in the following were obtained with a SiPM produced by Hamamatsu Photonics [15]; more specifically, the main features of the detector are reported in Table 1. We have decided to test a detector with cells in order to keep DCR and cross-talk at a reasonable level and to maximize PDE. The signal was integrated by a charge digitizer V792 produced by Caen [27], with a 12-bit resolution over 400 pC range; the signal was typically integrated over a 200 ns long time window. The DCR and cross-talk can be directly obtained by measuring the frequency of the pulses from the sensor, with no illumination, above a well defined threshold. The result of a threshold scan of DCR is displayed in Fig. 2, clearly showing that the single cell avalanches stochastically triggered by thermally generated carriers can induce, by optical cross-talk, a cascade effect resulting in a multiple cell spurious event. Thus optical cross-talk can be measured using:
| (1) |
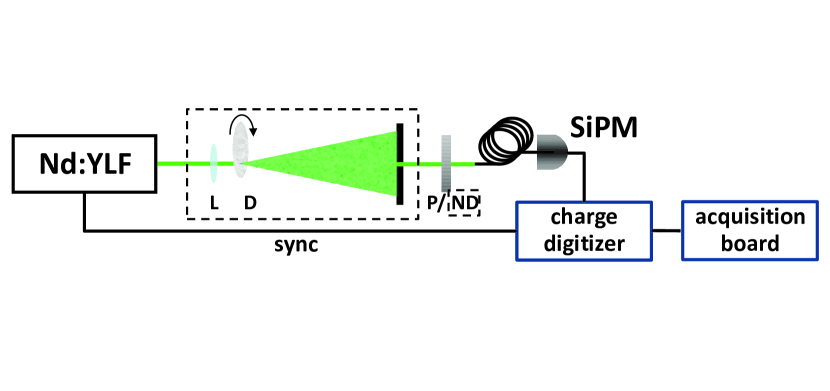
where is the the dark count rate measured by setting a threshold at a value lower than the peak amplitude of the signal corresponding to a single avalanche and is the count rate obtained when the threshold is set beyond the single cell signals (see Figure 2). The experimental results reported below were obtained illuminating the sensor with a frequency-doubled Nd:YLF mode-locked laser amplified at 500 Hz (High Q Laser Production) that provides linearly polarized pulses of 5.4 ps duration at 523 nm wavelength. Two series of measurements were performed, the first one directly on the coherent laser output and the second one on the pseudo-thermal light obtained by passing the laser through a rotating ground-glass diffuser (D in Fig. 3) [28]. The light to be measured was delivered to the sensor by a multimode optical fiber (1 mm core diameter). The signal digitization was synchronized to the laser pulse.
3 Detector response modelling
The response of an ideal detector to a light field can be described in a simple way as a bernoullian process:
| (2) |
being the number of impinging photons over the integration time, the number of detected photons and the photon-detection efficiency. Actually, is a single parameter quantifying detector effects and losses (intentional or accidental) which can be tracked to the optical system. As far as SiPMs are concerned, detector effects are due to the quantum efficiency, the fill factor and the avalanche triggering probability, namely the probability for a charge carrier to develop a Geiger-Mueller quenched discharge [29, 30]. As a consequence, the distribution of the number of detected photons, that is the GM avalanches actually corresponding to a detected photon has to be linked to the distribution of the number of photons in the light under measurement by [31, 32, 33]:
| (3) |
It can be demonstrated [34, 24] that for a combination of classical light states the statistics is preserved by the primary detection process. This simple description has to be further developed to link to the probability density distribution of the GM avalanches of any origin. First we must take into account spurious hits and cross-talk effects, not negligible in the detectors being studied. The dark count rate results in a poissonian process which can be described as:
| (4) |
where is the mean number of dark counts during the gate window (or integration time) and .
As a consequence, the statistics of the recorded pulses may be described as:
| (5) |
obviously shifting the mean value to , with an increased variance and third-order central moment and .
As a further step, cross-talk effects shall be taken into account. Cross-talk is a genuine cascade phenomenon that can be described at first order as [35]
| (6) |
being the (constant) probability that the GM avalanche of a cell triggers a second cell, the number of dark counts and photo-triggered avalanches and the actual light signal amplitude. Within this first-order approximation, the actual sensor response is described by
| (7) |
characterized by , and . In the following we refer to this analytical model as Model I. We also consider a better refined model (vide infra, Model II) offering, in principle, an extended range of application, but paying the price of being limited to a numerical rather than analytical solution. Irrespective of the model, the amplification and digitization processes that produces the output can simply be described as a multiplicative parameter :
| (8) |
conveniently scaling the momenta as , and .
3.1 Model I: an analytical evaluation of the second and third order momenta
This approach extends the method presented in [23] to detectors with a significant dark count rate and first order cross-talk effects. Experimentally, it is based on the detection of a light field performed by varying, in a controlled way, the optical losses, i.e. , with detector parameters presumed to be constant throughout the scan. The second-order momentum of the recorded pulse distribution can be used to evaluate the Fano factor:
| (9) | |||||
where is the Mandel factor of the primary charges. Note that, due to dark-counts, the coefficient of in Eq. (9) cannot be written as [23, 36], that is, the coefficient does not only depend on the light field to be measured. Similarly we can calculate a sort of symmetry parameter
| (10) | |||||
where . Note that in the presence of dark-counts both coefficients and are no-more independent of the light under measurement [24]. We will see how this modifies the results in the following examples involving classical light states for which the statistics of detected photons is the same as that of photons.
A validation and a comparison of the proposed model was performed by sampling coherent and multi-thermal light fields, where the proposed model can be specified as follows.
3.1.1 Sampling a coherent light field
For a coherent field, the photon-number distribution is given by
| (11) |
for which . Remembering that the distribution of dark-counts is also poissonian, according to Eq.s (9) and (10), we have:
We thus obtain from Eq.s (9) and (10)
| (12) | |||||
| (13) |
at any mean value .
The results in Eq.s (12) and (13) show that, if we measure a coherent field at different values of by varying the overall detection efficiency through an attenuator [23], we can obtain the values of , the detector gain, and , the probability of cross-talk, by fitting the experimental values of and . The -value is obtained in units of per detected photon. Of course, no information can be obtained from Eq.s (12) and (13) on the amount of dark-counts as far as the statistics is poissonian for both light and dark-counts. Note that, as the relation between and is quadratic, we have in general two sets of possible values for each fit. The choice of one of the sets is made by comparing the value of with the interspacing between the peaks of the pulse-height spectrum.
3.1.2 Sampling a multi-mode thermal light field
The photon-number distribution of a field made of independent thermal modes each containing mean photons [31] is given by
| (14) |
for which , and . In this case we have
We now observe that the measured output mean value can be written as , where only undergoes attenuation during the experimental procedure while remains constant. We thus rewrite Eq.s (9) and (10) as
| (15) | |||||
| (16) |
By measuring our multi-mode thermal field at different values of , and plotting and we can obtain an estimation of the parameters , , , from a self-consistent procedure and without need of an independent calibration. Again is in units of per detected photon and the relation between and is quadratic (see above).
3.2 Model II: a numerical evaluation based on the photon-number resolving properties of SiPM
The above mentioned self-consistent method is very powerful, but requires the acquisition of several histograms at varying , which could not always be easy to perform, or possible at all, in many practical applications: from this point of view, the possibility to analyze each spectrum independently looks complementary to the self-consistent approach. We performed this analysis with a two-step procedure:
-
-
we measured the areas of the spectrum peaks, thus obtaining an estimation of the number of counts per peak;
-
-
we fitted the obtained data points with a theoretical function, which takes into account the statistics of light, detection and all deviations of the detectors from ideality, such as DCR and cross-talk effects.
To evaluate the area of each peak, we performed a multi-peak fit of the spectrum histogram, modelling each peak with a Gauss-Hermite function [37]:
| (17) |
where
| (18) |
and is a normalization factor, is the peak position and is the
variance of the gaussian function; and are the third and the fourth
normalized hermite polynomials and their contribution gives the asymmetry of the peak
shape, whose entity is regulated by the pre-factors and , with values in the
range . The global fit function of the spectrum is a sum of as many Gauss-Hermite
function as the number of resolved peaks.
The choice of the GH-function in Eq. (17) allows us to calculate the area
of the -th peak in a very straightfoward way, simply by the relation
| (19) |
The error on the obtained value is calculated by propagating the errors
on the fit parameters.
This analysis is also useful in order to calculate the system gain : in fact,
from the fitted values of the peak positions we can calculate the
peak-to-peak distance for all the resolved peaks:
| (20) |
The error associated to this value is once again obtained by
propagating the fit errors of the peak position values; furthermore, to estimate
a weighted average on all the peak-to-peak values obtained from the analyzed histogram is
performed.
As for the theoretical function, the effect of detection, DCR and amplification is
modelled as described in previous sections (see Eq.s (2)-(5)
and Eq. (8)).
The effect of cross-talk, is described by using a bernoullian process, in a way analogue
to what has been done with function of Eq. (6). However,
as cross-talk process is intrinsically a cascade phenomenon, its contribution has been
calculated by adding higher order effects:
| (21) |
where terms like stand for the bernoullian distribution
| (22) |
Such a higher order expansion is not trivial to be achieved by the self-consistent
approach of Model I, in which an explicit analytic expression of
is needed in order to calculate its momenta. Here, as all the
elements of interest (, , , the number of
modes ) will be obtained as fit parameters, this is not necessary and therefore
can be just numerically calculated as the fitting function.
The major limitation of this approach is obvious: as all the information on the
statistics of the system is obtained from the peak areas, this method can only be applied
to peak-resolving histograms with a number of peaks greater than the number of free
parameters of the fitting function, which, in the present analysis, can rise up to five.
4 Experimental results
4.1 Coherent light
First of all, we measured the coherent light emerging from the laser. We measured the
values of the output, , at 20000 subsequent laser shots for 15 series, each one with a
different mean value , set by rotating a polarizer (P in
Fig. 3) in front of the collection fiber. We then acquired a series of data
in the absence of light and set the zero at the mean value of the main peak of the
resulting histogram, in which the presence of dark counts and cross talk emerges as a
much lower separated peak. Following Model I we evaluated the experimental values
of and that are plotted in Fig. 4
as a function of . We then fitted the data to straight lines
and obtained () ch, for , and () ch2, for
. These values were used to evaluate and from
Eqs. (12) and (13). We obtained ch
and . The -values were then divided by and
re-binned in unitary bins [23, 36] to obtain the
distribution of the actual light signal amplitude measured in the presence of dark-counts
and cross-talk. Note that due to the linearity of the detector the mean value of the
output can be directly obtained as
, independent of the
shape of the distribution.
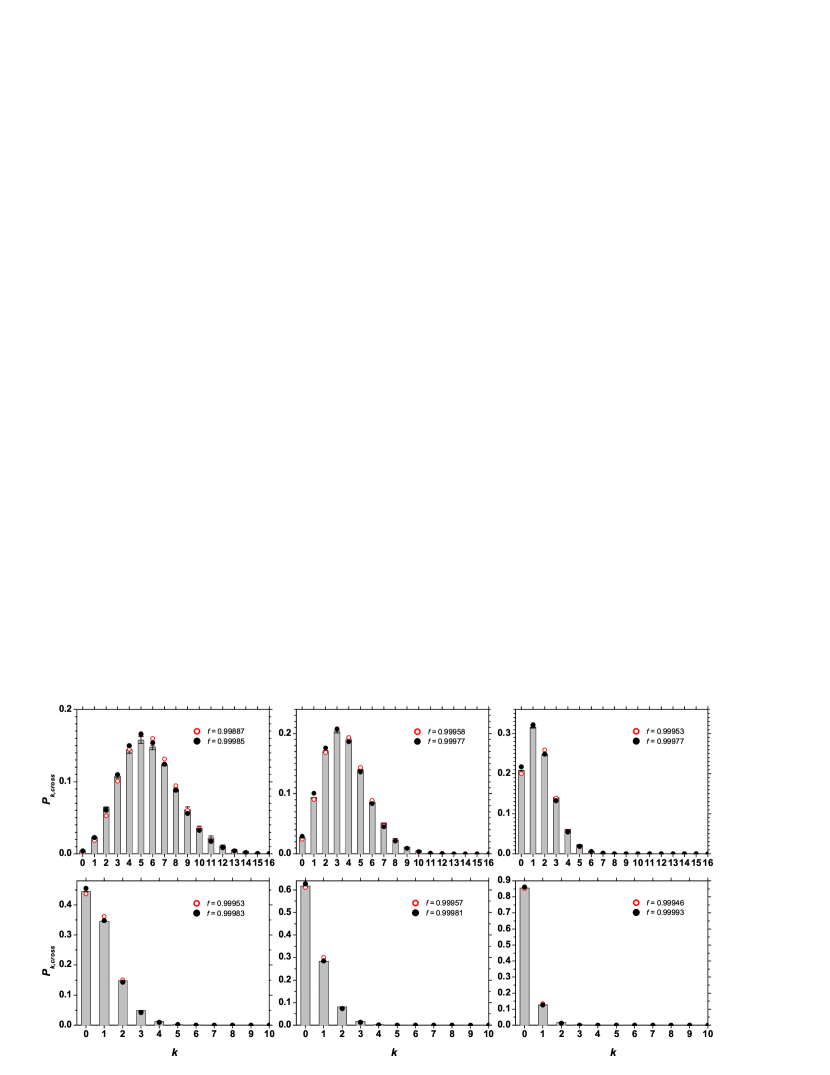
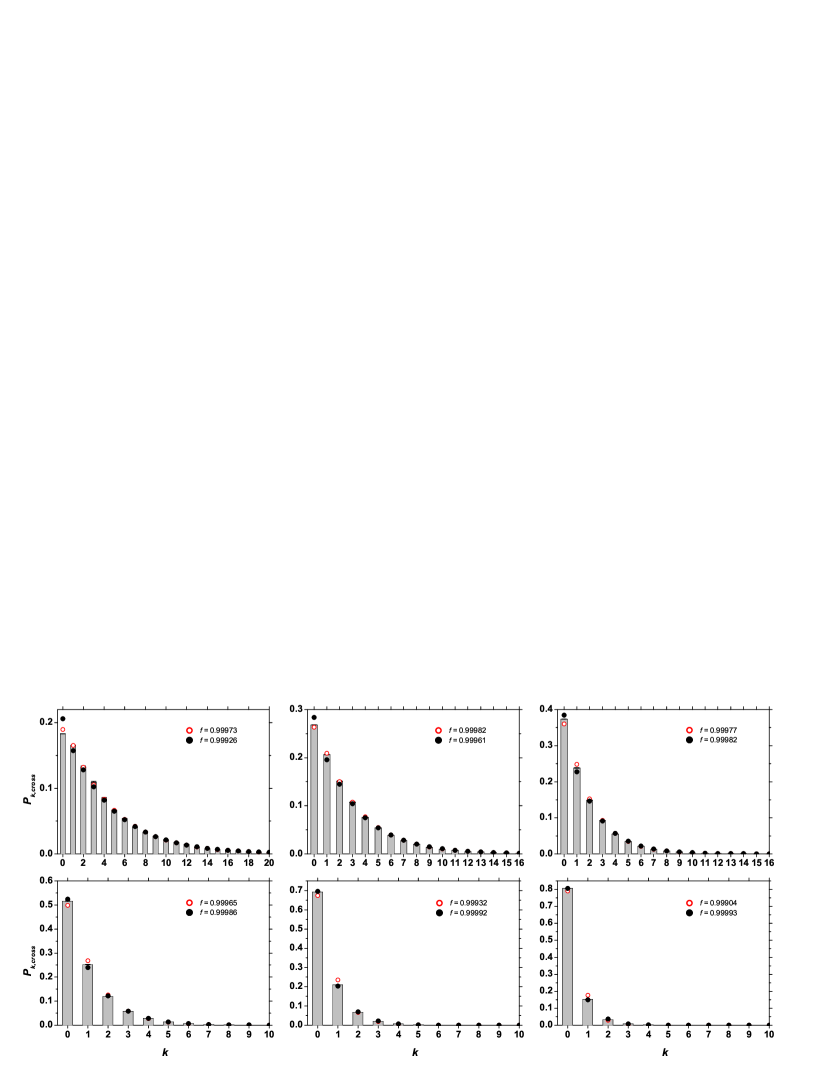
In Fig. 5 we plot as bars six different
distributions at different mean values. Superimposed to the experimental values we plot
two theoretical curves, one is a poissonian (see Eq. (11)) having mean value
(white circles), while the other (full circles) is
evaluated by including the cross-talk effect. We evaluate from
Eq. (7) in the case in which is poissonian and get:
| (23) |
where . The theoretical distributions (full
circles in Fig. 5) are evaluated by using the measured values of
, and .
Note that measuring a coherent light with this method enables the simultaneous
characterization of the detector gain and of the contribution of cross-talk. The
comparison between the data and the theoretical functions can be estimated through the
evaluation of the fidelity
| (24) |
On the other hand, using the method of analysis of Model II, we could study each
one of the acquired histograms separately. As mentioned above, in the case of coherent
light, we have a theoretical fitting function with a total of three free parameters:
expectation value of light and DCR contribution , the
probability for an avalanche to trigger a second one and a global
normalization factor (up to three “iterations”): in this case we are limited to spectra
with at least 4 resolved peaks.
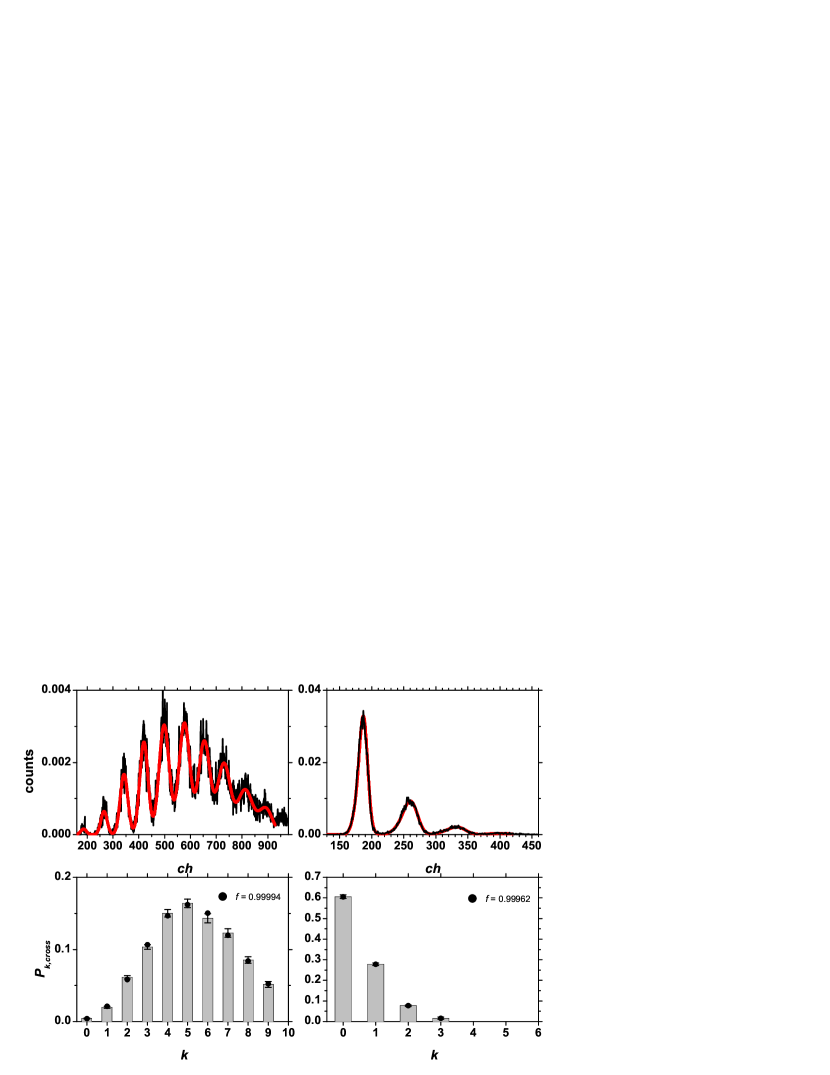
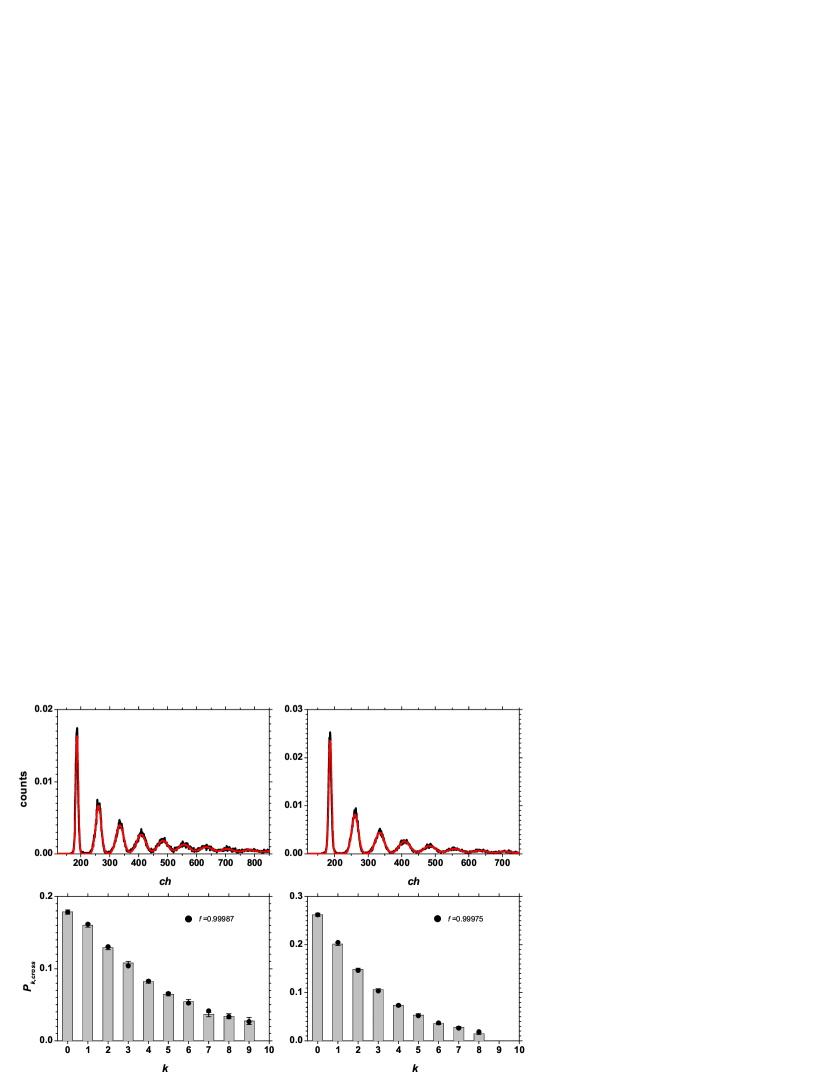
In Fig. 6 we show the results of this analysis for the multi-peak fit and
for the fit of the statistics of the avalanches using as an indicator of the
goodness of the fit result. The obtained values are compatible with what we
obtained with Model I. Also the gain values, evaluated as the peak-to-peak
distance, show a good agreement with the values given by Model I: ch for spectrum in left panel and ch for
spectrum in right panel.
4.2 Multi-mode pseudo-thermal light
In order to obtain information on the contribution of dark-counts we have to measure a different light statistics, whose shape is modified by the convolution with the poissonian distribution for dark-counts. We thus produced a pseudo-thermal light field by selecting with a small aperture ( m diameter) a region much smaller than the coherence area of the speckle patterns produced by the rotating diffuser. We follow the same procedure described for coherent light by measuring the values of the output, , at 50000 subsequent laser shots and at 10 different mean values, obtained by means of a variable neutral-density filter (ND in Fig. 3). In Fig. 7 we plot the experimental values of and as a function of . Along with the experimental data we plot the fitting curves evaluated according to Eqs. (15) and (16). To describe the fitting procedure in detail we rewrite Eqs. (15) and (16) as the
| (25) | |||||
| (26) |
where we have set . First of all we fitted the data to and obtained the values of and ch. Then we fitted the data for by substituting the obtained values of ch and to obtain and ch2. These values are then used to evaluate and from Eqs. (15) and (16). We obtained ch and . The -values were then divided by and re-binned in unitary bins [23] to obtain the distribution of the actual light signal amplitude measured in the presence of dark-counts and cross-talk. In Fig. 8 we plot, as bars, six different distributions at different mean values. Superimposed to the experimental values we plot two theoretical distributions: the first one (open circles) is evaluated by including the contribution of dark-count that modifies the statistics of a single-mode thermal distribution (see Eq. (14)) into according to Eq. (27), which, in the present case, yields:
| (27) | |||||
where is the confluent hypergeometric function. The parameters are evaluated as and . The second distribution (full circles) is evaluated from Eq. (7) to take into account the cross-talk. Unfortunately, the calculation does not yield an easy analytical result, and hence we evaluate it numerically. The values of the fidelity for the data in Fig. 8 improve when we take into account both dark-counts and cross-talk.
Turning now to the other approach, we note how the number of fit parameters in this case
is enhanced: we now have the expectation value of avalanches
generated by detection, the expectation value of DCR
contribution, the number of modes , the probability of triggering a
cross-talk event (up to three iterations) and again a global normalization factor, for a
total of 5 fit parameters: obviously, this puts a severe limit on the
applicability of this method, needing at least 6 resolved peaks.
As it can be noted
from the fit results in Fig. 9, once again the results obtained by using
Model II are compatible within errors with what we found by applying
Model I. However, whether the global fits present a very low value for
degree of freedom, the obtained fit parameters present high uncertainties, probably
indicating the presence of very high off-diagonal elements in the minimization matrix and
suggesting a strong correlation between the various parameters. This problem can be
avoided by fixing some of the fit parameters (such as DCR or cross-talk), by retrieving
their value from an accurate direct measurement as that explained in
Section 2.
5 Discussion
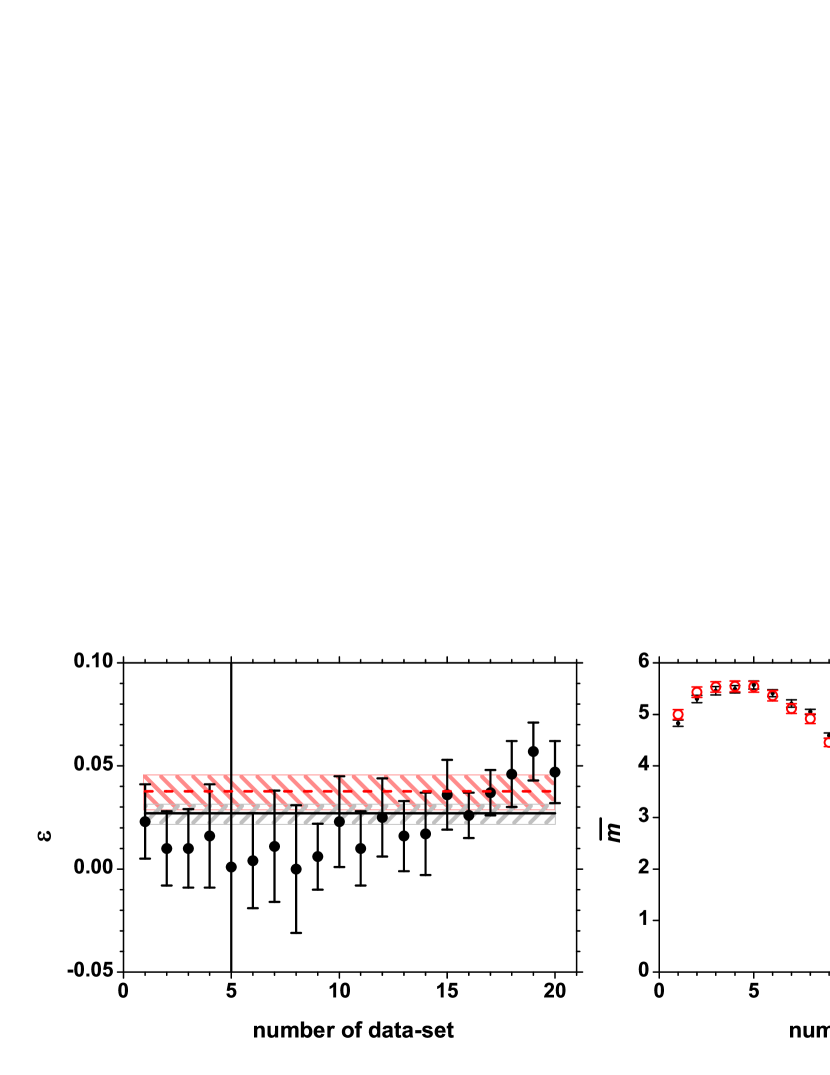
We can compare the results of the two analysis methods on the same data-sets taken at different intensities. In Fig. 10 (a) we plot as full circles the values of obtained by applying Model II to coherent light along with their weighted average (full line). As a comparison, the value of obtained by applying Model I is plotted as dashed line. In Fig. 10 (b) we plot as full circles the values of mean photon numbers evaluated for the same data as in panel (a) by applying Model II. White circles represent the values of mean photon numbers obtained by applying Model I. As we can see, the values are compatible within errors.
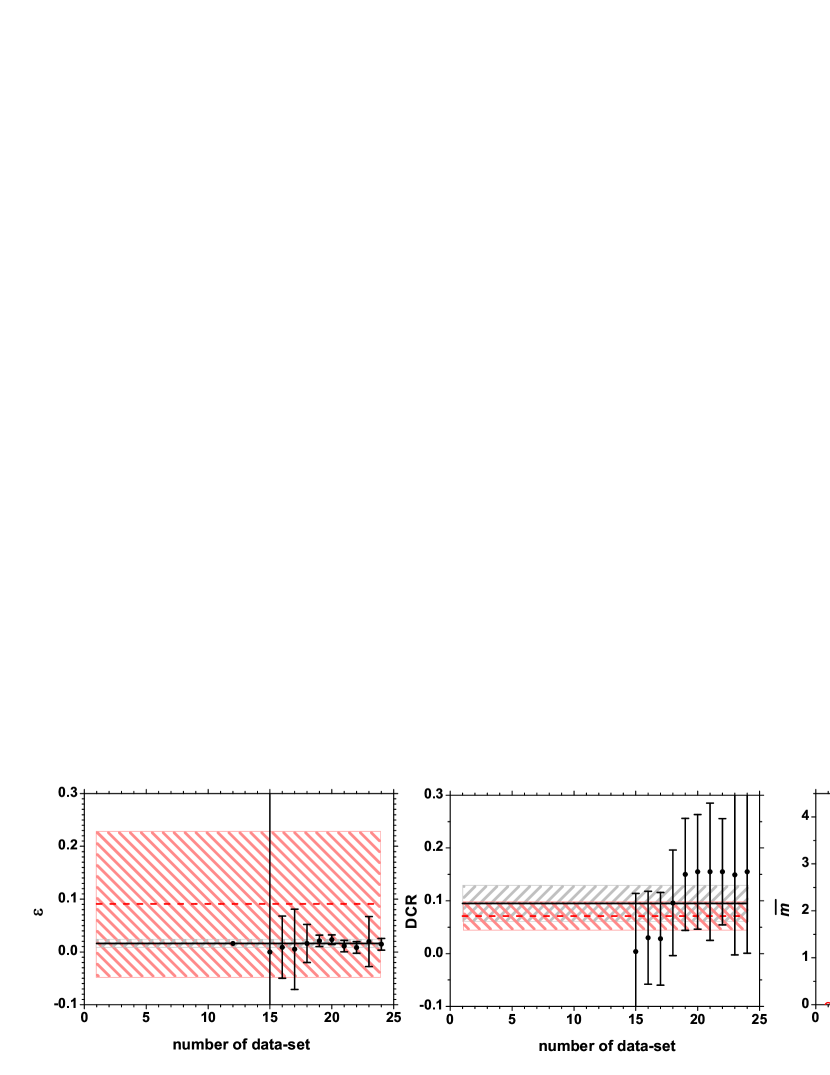
The same comparison for the measurements on thermal light is shown in Fig. 11. Here we can see that the agreement is better for the mean values of detected photons (panel (a)) and for the DCR (panel (b)), while the estimated values of from the two Models definitely disagree. This can be due to the different approximations adopted by the two Models (first order vs third order) that become relevant when measuring thermal light instead of coherent light.
In Table 2 we summarize the results of the two Models. We demonstrated that both the Models work in a self-consistent way, even if they have two definitely different approaches. Model I does not need peak resolving capability, but requires the acquisition of several histograms at varying . Once determined the parameters and DCR, all the data-sets in a series can be analyzed, independent of the number of distinguishable peaks in the pulse-height spectrum. Model II works analyzing each histogram independently, but, as GM-avalanches distribution is obtained with a fit of the data, it requires at least a number of resolved peaks greater than the number of free parameters. The fact that the two Models give very similar results for mean photon numbers is particularly important as in most applications this is the only important parameter. Merging the two Models we can devise an optimal strategy based on a self-consistent calibration performed by measuring a known light and analyzing the data with Model I: once known and DCR, the determination of the mean photon number is independent of the specific statistics of light. Hence the information on the mean photon number can be obtained from each single measurement, even when the fitting procedure of Model II cannot be applied.
6 Conclusions
We have developed a model to describe the operation of a multi-pixel detector for which dark-count and cross-talk effects are non negligible and we have implemented two different procedures for recovering the values of dark-counts and cross-talk, both implemented on measurements performed on the same light under characterization. We demonstrated that Model I is self-consistent and does not need peak resolving capability; on the other hand, it requires the acquisition of several histograms at varying . Model II works by analyzing each histogram independently, but seems to be a less robust method in order to perform direct measurements of the detector parameters and it is better performing if supported with direct measurement of some relevant parameters. The results obtained by both methods show that the light statistics can be reliably reconstructed in the case of coherent and thermal light.
Acknowledgments
Part of the equipement used has been founded by the European Commission within the RAPSODI Project - COOP 32993.
References
- [1] N. Kanaya, “HPD for linear colliders for the JLC calorimeter group,” Nucl. Instrum. Methods Phys. Res. A 442, 295-299 (2000).
- [2] P. Buzhan et al., “Silicon photomultiplier and its possible applications,” Nucl. Instrum. Methods Phys. Res. A 504, 48-52 (2003).
- [3] B. Dolgoshein et al., “Status report on silicon photomultiplier development and its applications,” Nucl. Instrum. Methods Phys. Res. A 563, 368-376 (2006).
- [4] J. Haba, “Status and perspectives of Pixelated Photon Detector (PPD),” Nucl. Instrum. Methods Phys. Res. A 595, 154-160 (2008).
- [5] S. Korpar et al., “Silicon photomultiplier as a detector of Cherenkov photons,” Nucl. Instrum. Methods Phys. Res. A 595, 161-164 (2008).
- [6] S. Takeshita et al., “Development of positron detector for mSR based on multi-pixel photoncounter,” Nucl. Instrum. Methods Phys. Res. A 600, 139-142 (2009).
- [7] S. Moehrs, A. Del Guerra, D.J. Herbert, and M.A. Mandelkern, “A detector head design for small-animal PET with silicon photomultipliers (SiPM),” Phys. Med. Biol. 51, 1113-1127 (2006).
- [8] E. Grigoriev et al., “Silicon photomultipliers and their bio-medical applications,” Nucl. Instrum. Methods Phys. Res. A 571, 130-133 (2007).
- [9] S. Gomi et al., “Development and study of the multi pixel photon counter,” Nucl. Instrum. Methods Phys. Res. A 581, 427-432 (2007).
- [10] C. Cappellini et al., “The RAPSODI project: SiPM development for applied research in radiation protection,” Nuclear Science Symposium Conference Record, 2008. NSS ’08. IEEE, 1069-1072 (2009).
- [11] D. Fukuda et al., “Photon number resolving detection with high speed and high quantum efficiency,” Metrologia 46, S288-S292 (2009).
- [12] F. Risigo, A. Bulgheroni, M. Caccia, C. Cappellini, V. Chmill, N. Fedyushkina, A. Golubev, M. Jastrzab, A. Kantsyrev, N. Markov, A. Martemianov, C. Pychlau, J. Wrfel, “SiPM technology applied to radiation sensor development,” Nucl. Instrum. Methods Phys. Res. A, 607, 75 77 (2009).
- [13] D. Kedar and S. Arnon, “Subsea ultraviolet solar-blind broadband free-space optics communication,” Opt. Eng. 48, 046001(1-7) (2009).
- [14] S. Arnon and D. Kedar, “Non-line-of-sight underwater optical wireless communication network,” J. Opt. Soc. Am. A 26, 530-539 (2009).
- [15] http://www.hamamatsu.com
- [16] For a review, see A. I. Lvovsky and M. G. Raymer, “Continuous-variable optical quantum state tomography,” Rev. Mod. Phys. 81, 299-332 (2009).
- [17] M. Bondani, A. Allevi, and A. Andreoni, “Wigner function of pulsed fields by direct detection,” Opt. Lett. 34, 1444-1446 (2009).
- [18] J. Kim, S. Takeuchi, Y. Yamamoto and H. H. Hogue, “Multiphoton detection using visible light photon counter,” Appl. Phys. Lett. 74, 902-904 (1999).
- [19] A. E. Lita, A. J. Miller, and S. W. Nam, “Counting near-infrared single photons with 95% efficiency,” Opt. Expr. 16, 3032-3040 (2008).
- [20] D. Achilles et al., “Photon-number-resolving detection using time-multiplexing,” J. Mod. Opt. 51, 1499-1515 (2004).
- [21] K. Laiho, M. Avenhaus, K. N. Cassemiro and Ch. Silberhorn, “Direct probing of the Wigner function by time-multiplexed detection of photon statistics,” New J. Phys. 11, 043012(1-21) (2009).
- [22] M. Miuda, O. Haderka and M. Jeek, “High-efficiency photon-number-resolving multichannel detector,” Phys. Rev. A 78, 025804(1-4) (2008).
- [23] M. Bondani, A. Allevi, A. Agliati, and A. Andreoni, “Self-consistent characterization of light statistics,” J. Mod. Opt. 56, 226-231 (2009).
- [24] M. Bondani, A. Allevi, and A. Andreoni, “Light statistics by non-calibrated linear photodetectors,” Adv. Sci. Lett. 2, 463-468 (2009).
- [25] A. V. Akindinov, A. N. Martemianov, P. A. Polozov, V. M. Golovin, and E. A. Grigoriev, “New results on MRS APDs,” Nucl. Instr. and Meth. in Phys. Res. A 387, 231-234 (1997).
- [26] F. Zappa, S. Cova, M. Ghioni, A. Lacaita, C. Samori, “Avalanche photodiodes and quenching circuits for single-photon detection,” Appl. Opt. 35, 1956-1976 (1996).
- [27] http://www.caen.it
- [28] F. T. Arecchi, “Measurement of the Statistical Distribution of Gaussian and Laser Sources,” Phys. Rev. Lett. 15, 912-916 (1965).
- [29] K. G. McKay, “Avalanche Breakdown in Silicon,” Phys. Rev. 94, 877-884 (1954).
- [30] W. G. Oldham, R. R. Samuelson, P. Antognetti, “Triggering phenomena in avalanche diodes,” IEEE Trans. Electron. Dev. ED-19, 1056-1060 (1972).
- [31] L. Mandel and E. Wolf, Optical Coherence and Quantum Optics (Cambrige University Press, New York, NY, 1995).
- [32] A. Agliati, M. Bondani, A. Andreoni, G. De Cillis and M. G. A. Paris, “Quantum and classical correlations of intense beams of light via joint photodetection,” J. Opt. B: Quantum Semiclassical Opt. 7, S652-S663 (2005).
- [33] G. Zambra, M. Bondani, A. S. Spinelli, and A. Andreoni, “Counting photoelectrons in the response of a photomultiplier tube to single picosecond light pulses,” Rev. Sci. Instrum. 75, 2762-2765 (2004).
- [34] E. Casini and A. Martinelli, “A family of distributions stable with respect to random sums”. Manuscript in preparation.
- [35] I. Afek, A. Natan, O. Ambar, and Y. Silberberg, “Quantum state measurements using multipixel photon detectors,” Phys. Rev. A 79, 043830(1-6) (2009).
- [36] A. Andreoni and M. Bondani,“Photon statistics in the macroscopic realm measured without photon counters,” Phys. Rev. A 80, 013819(1-5) (2009).
- [37] R. P. Van Der Marel and M. Franx, “A new method for the identification of non-gaussian line profiles in elliptical galaxies,” Astrophys. J. 407, 525-539 (1993).
Fig. 1. Left panel: Output of a SiPM Hamamatsu MPPC S10362-11-100C detecting a weak light field as displayed by a 100 MHZ oscilloscope. Right panel: histogram of the corresponding spectrum.
Fig. 2. Threshold scan of the SiPM performed at room temperature with no impinging light.
Fig. 3. (Color online) Experimental setup. Nd:YLF: laser source, P: polaroid, ND: variable neutral density filter, SiPM: detector. The components in the dashed boxes are inserted to produce the pseudo-thermal field.
Fig. 4. (Color online) Plot of and as a function of for coherent light.
Fig. 5. (Color online) Experimental distributions at different mean values (bars) and theoretical curves evaluated according to Model I: poissonian (white circles), poissonian modified by cross-talk effect (full circles). The corresponding fidelity values of the reconstruction are also shown.
Fig. 6. (Color online) Experimental results for Model II applied on two of the histograms acquired with coherent light. Upper row: result of the multi-peak fit procedure; lower row: fitted theoretical distributions. The corresponding fidelity values of the reconstruction are also shown.
Fig. 7. (Color online) Plot of and as a function of for pseudo-thermal light.
Fig. 8. (Color online) Experimental distributions at different mean values (bars) and theoretical distributions evaluated according to Model I: thermal modified by dark count distribution (white circles), thermal modified by dark counts and cross-talk effect (full circles). The corresponding fidelity values of the reconstruction are also shown.
Fig. 9. (Color online) Experimental results for Model II applied on two of the histograms acquired with thermal light. Upper row: result of the multi-peak fit procedure; lower row: fitted theoretical function. The corresponding fidelity values of the reconstruction are also shown.
Fig. 10. (Color online) Left panel: values of obtained by applying Model II to coherent light (full circles) and their weighted average (full line). Dashed line: value of obtained by Model I. Right panel: values of mean photon numbers evaluated by applying Model II (full circles) and by applying Model I (white circles).
Fig. 11. (Color online) Left panel: values of obtained by applying Model II to thermal light (full circles) and their weighted average (full line). Dashed line: value of obtained by Model I. Central panel: values of DCR evaluated for the same data as in the left panel by applying Model II (full circles) and their weighted average (full line). Dashed line: value of DCR obtained by Model I. Right panel: values of mean photon numbers evaluated by applying Model II (full circles) and by applying Model I (white circles).


| Hamamatsu MPPC S10362-11-100C | |
|---|---|
| Number of Diodes: | 100 |
| Area: | 1 mm 1 mm |
| Diode dimension: | 100 m 100 m |
| Breakdown Voltage: | 69.23 V |
| dark-count Rate: | 540 kHz at 70 V |
| Optical Crosstalk: | 25 at 70 V |
| Gain: | at 70 V |
| PDE (green): | 15 at 70 V |
| Poissonian | Pseudo-thermal | ||||
|---|---|---|---|---|---|
| Model I | Model II | Model I | Model II | ||
| DCR | - | - | 0.071 0.027 | 0.094 0.035 | |
| 0.038 0.008 | 0.027 0.005 | 0.091 0.138 | 0.035 0.004 | ||