11email: rodes@dfists.ua.es 22institutetext: Department of Physics and Astronomy, University of Leicester, Leicester, LE1 7RH, UK 33institutetext: Dr. Karl Remeis-Sternwarte, Sternwartstr. 7, D-96049 Bamberg, Germany
44institutetext: Erlangen Centre for Astroparticle Physics (ECAP), Erwin-Rommel-Str. 1, 91058 Erlangen, Germany
55institutetext: National Space Science and Technology Center, 320 Sparkman Drive, Huntsville, AL 35805, USA††thanks: Fundación Española de Ciencia y Tecnología, C/ Rosario Pino, 14-16, 28020 Madrid, Spain
The first cyclotron harmonic of 4U 153852
Abstract
Context. Cyclotron resonant scattering features are an essential tool for studying the magnetic field of neutron stars. The fundamental line provides a measure of the field strength, while the harmonic lines provide information about the structure and configuration of the magnetic field. Until now only a handful of sources are known to display more than one cyclotron line and only two of them have shown a series of harmonics.
Aims. The aim of this work is to see the first harmonic cyclotron line, confirming the fundamental line at 22 keV, thus increasing the number of sources with detected harmonic cyclotron lines.
Methods. To investigate the presence of absorption or emission lines in the spectra, we have combined RXTE and INTEGRAL spectra. We modeled the 3–100 keV continuum emission with a power law with an exponential cut off and look for the second absorption feature.
Results. We show evidence of an unknown cyclotron line at 47 keV (the first harmonic) in the phase-averaged X-ray spectra of 4U 153852. This line is detected by several telescopes at different epochs, even though the S/N of each individual spectrum is low.
Conclusions. We conclude that the line-like absorption is a real feature, and the most straightforward interpretation is that it is the first harmonic, thus making 4U 153852 the fifth X-ray pulsar with more than one cyclotron line.
Key Words.:
X-rays: binaries – stars: pulsars: individual: 4U 1538521 Introduction
Cyclotron resonant scattering features (CRSFs), usually referred to as ‘cyclotron lines’, have proved to be powerful tools for directly studying the magnetic field in neutron stars. CRSFs are present in the hard X-ray spectra of several X-ray pulsars and originate in the “cyclotron process” under extreme conditions. Through keV (the ‘12-B-12 law’, where is the gravitational redshift), an energy of the fundamental feature in the hard X-rays indicates that the magnetic fields are rather strong ( G). Under such conditions, the interaction of the electrons and radiation must be treated quantum-mechanically. The behaviour of an electron in a strong magnetic field implies that the electron energy must be quantized in so-called Landau levels. These absorption features stem from the resonant scattering of photons by electrons, also referred to as cyclotron lines.
While the fundamental energy of the cyclotron line provides valuable information about the magnitude of the field, it is only through the detection and the analysis of the harmonic lines that we can get direct information about the geometrical configuration of the B field (Harding & Daugherty 1991; Araya-Góchez & Harding 2000; Schönherr et al. 2007). However, to date, only in a handful of systems have harmonic lines been discovered, and only two systems have shown more than two (Santangelo et al. 1999 & Coburn et al. 2005). It is therefore paramount to add as many systems to this selected group as we can.
In this work, we present a spectral analysis of the high mass X-ray binary pulsar 4U 153852. It is an eclipsing system consisting of the B0 I supergiant star QV Nor and a neutron star with an orbital period of 3.728 days (Clark clark (2000)). The orbital eccentricity is 0.08 (Corbet et al. corbet (1993)), although more recently a higher value of 0.17 was deduced by Clark (clark (2000)). The X-ray eclipse lasts 0.6 days (Becker et al. becker (1977)). The system is fairly bright in X-rays. The estimated flux is erg s-1 cm-2 in the 3100 keV range (Rodes rodesPhD (2007)). Thus, assuming a distance of the source of 5.5 kpc (Becker et al. becker (1977), Parkes et al. parkes (1978)) and an isotropic emission, the luminosity follows erg/s. The magnetized neutron star has a spin period of 529 s (Davison davison (1977); Becker et al. becker (1977)).
The pulse-phase averaged X-ray spectrum of 4U 153852 has usually been described either by an absorbed power law modified by a high energy cutoff, a power law modified by a Fermi-Dirac cutoff, or by two power laws with indices of opposite sign multiplied by an exponential cutoff (the NPEX model, Mihara mihara (1995); Rodes et al. rodes1 (2006)). In addition to these continuum models, an iron fluorescence line at 6.4 keV and a cyclotron resonant scattering feature at 20 keV discovered by Ginga (Clark et al. clark90 (1990)) are needed to describe the data. The variability of this CRSF was studied by Rodes-Roca et al. (rodes2 (2008)). Rossi X-ray Timing Explorer (RXTE) (Coburn coburn (2001)) and BeppoSAX data (Robba et al. robba (2001)) did not show evidence of the first harmonic at 40 keV. Robba et al. (robba (2001)) presented some evidence of an absorption feature around 50 keV; however, because of the lack of a signal-to-noise ratio of the spectrum at these energies, the feature could not be confirmed.
2 Observations
2.1 RXTE data
To study the presence of spectral features, we have used all archival data from RXTE on this source: three observations have been carried out in 1996, 1997, and 2001. The first one, is a monthly observation between 1996 November 24 and 1997 December 13. The second and third ones cover a complete orbital period. In our analysis we used data from both RXTE pointing instruments, the Proportional Counter Array (PCA) and the High Energy X-ray Timing Experiment (HEXTE).
To extract the spectra, we used the standard RXTE analysis software FTOOLS111available at http://heasarc.gsfc.nasa.gov. This package takes care of the modeling of PCA background, the dead time corrections of HEXTE data and generates the appropriate response matrices for the spectral analysis.
The PCA consists of five co-aligned Xenon proportional counter units with a total effective area of 6000 cm2 and a nominal energy range from 2 keV to over 60 keV (Jahoda et al. jahoda (1996)). However, because of response problems above 20 keV and the Xenon-K edge around 30 keV, we restricted the use of the PCA to the energy range from 3 keV to 20 keV (see also Kreykenbohm et al. ingo (2002)). Systematic uncertainties are taken into account by the standard spectral analysis.
The HEXTE consists of two clusters of four NaI(Tl)/CsI(Na) Phoswich scintillation detectors with a total net detector area of 1600 cm2. These detectors are sensitive from 15 keV to 250 keV (Rotschild et al. hexte (1998)), however, response matrix, instrument background and source count rate, limit the energy range from 17 to 100 keV. Background subtraction in HEXTE is done by source-background swapping of the two clusters every 32 s throughout the observation. For the HEXTE, the response matrices were generated with HXTRSP, version 3.1. We used HXTDEAD version 2.0.0 to correct for the dead time. In order to improve the statistical significance of the data, we added the data of both HEXTE clusters and created an appropriate response matrix by using a 1:0.75 weighting to account for the loss of a detector in the second cluster. We also binned several channels together of the HEXTE data at higher energies and chose the binning as a compromise between increased statistical significance while retaining a reasonable energy resolution.
2.2 INTEGRAL data
INTEGRAL winkler03 (Winkler et al. 2003) has a unique broad band capability thanks to its four science instruments (imager IBIS, spectrometer SPI, X-ray monitor JEM-X, and optical monitor OMC) which allow us to study a source from 3 keV up to 10 MeV and in the optical simultaneously. The imager IBIS has a very large field of view of which allows us to observe many sources at the same time. Together with a large collecting area of 2600 cm2 and decent energy resolution of 9% at 100 keV makes IBIS the prime instrument for our analysis.
Since its launch on October 17 2002, INTEGRAL observatory has been constantly collecting a wealth of data. INTEGRAL data are organized in revolutions (i.e. 72 h long satellite orbits around the Earth) and then science windows which are typically 1800 s to 3600 s long.
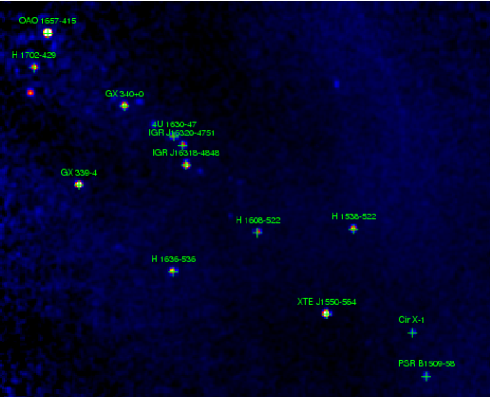
The source was observed by the hard X-ray imager (IBIS) camera on board INTEGRAL during the regular scans of the Galactic plane and the Norma survey. Fig. 2 shows an IBIS/ISGRI mosaic image of the Norma Arm region in the energy range 20100 keV. The source 4U 153852 (labelled as H 1538522) is clearly detected and its position is well determined, allowing us to extract its spectrum without contamination of other sources in the field of view of the instrument.
To extract INTEGRAL data, we used the Offline Science Analysis Software (OSA) version 7.0, as distributed by the Integral Science Data Centre (ISDC) following the respective cookbook222available at http://isdc.unige.ch instructions. For IBIS, we selected all public data up to revolution 400 with the source in the fully coded field of view of the instrument, resulting in 400 Science Windows (ScWs). In a first step we created a mosaic of the full data set to obtain a catalog of the detected sources in the field of view. Since 4U 1538522 is relatively close to the galactic centre, the catalog contains other 15 sources, among them several bright sources such as 4U 1700377. We then used this catalog to extract the spectrum of 4U 1538522 using all 400 ScWs in order to obtain a high signal-to-noise ratio. Since all other sources in the field are several degrees away, source confusion is not a problem. For JEM-X we used all data of monitor number one (JEM-X 1) within 2∘ to ensure a reliable spectrum resulting in approximately 55 ScWs. And for SPI, the selection of all available data within a 8∘ radius (the fully coded field of view of the instrument) allowed us to obtain 969 ScWs. The selected spectra then have an effective exposure time of 720 ksec for IBIS, 1907 ksec for SPI, and 360 ksec for JEM-X.
See Table 1 for the details of all observations which have been used in this work.
| Satellite/Instrument | MJD | Exposure | Orbital |
|---|---|---|---|
| (ks) | phase | ||
| RXTE/PCA | 51925.25 | 9.296 | 0.53 |
| RXTE/HEXTE | 51925.25 | 6.418 | 0.53 |
| RXTE/PCA | 51925.74 | 12.592 | 0.66 |
| RXTE/HEXTE | 51925.74 | 8.261 | 0.66 |
| INTEGRAL/JEM-X 1 | 53407.753826.3 | 360 | |
| INTEGRAL/ISGRI | 52651.453756.2 | 720 | |
| INTEGRAL/SPI | 52651.453941.4 | 1907 |
3 Spectral analysis
For spectral analysis we used the XSPEC (Arnaud (1996)) fitting package, released as a part of XANADU in the HEASoft tools.
3.1 RXTE analysis
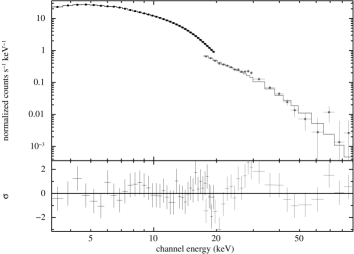
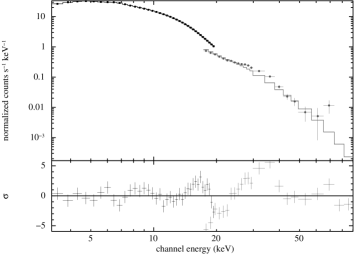
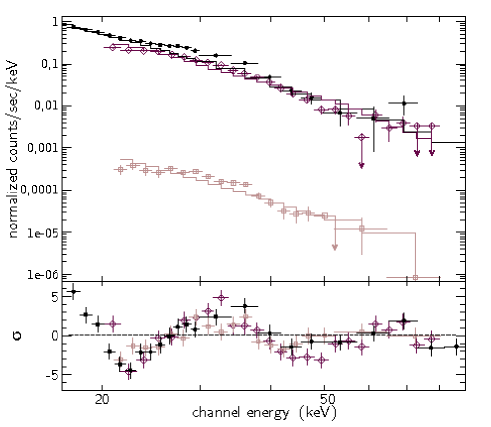
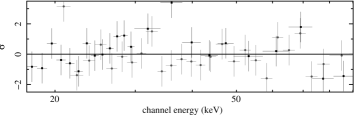
Fig. 1 shows PCA and HEXTE phase-averaged spectrum at orbital phases 0.53 (left panel) and 0.66 (right panel). The raw data together the best-fit model and the residuals of the fit as the difference between observed flux and model flux divided by the uncertainty of the observed flux, i. e. in units of , are included in this plot. The dip of the second cyclotron line at 47 keV is apparent in the raw data. The RXTE continuum is properly described by an absorbed powerlaw modified by an exponential cutoff at keV (cutoffpl in XSPEC (Arnaud (1996))), see Table 2. Analytically, cutoffpl is given by the equation,
| (1) |
where is the power law photon index and is the cutoff energy in keV. An iron emission line at 6.4 keV was also added. The proper description of the continuum, however, further required a very broad Gaussian emission line component at 12 keV to account for a flux excess at these energies. This phenomenological component has been used to describe the continuum of several X-ray pulsars (Coburn et al. coburn2 (2002) concluded that this bump is an inherent feature in the spectra of accreting pulsars). Although it has no clear physical interpretation, its use here is justified as we concentrate on the presence of absorption features at significantly higher energies. See Table 2 for the best fit spectral parameters for the data set in Fig. 1. Data from PCA and HEXTE have been fitted simultaneously. All uncertainties refer to a single parameter at the 90% ( 2.71) confidence limit333Also in Tables 3, 4 and 5.
A significant absorption feature is present in the residuals around 47 keV. When other models are used to describe the underlying continuum, i.e. an absorbed powerlaw with a Fermi-Dirac cutoff (Tanaka 1986) or the NPEX model (Mihara mihara (1995)), the overall residuals were higher, but none of them was able to account for the absorption feature at 47 keV.
| Component | Parameter | Left panel | Right panel |
|---|---|---|---|
| Continuum | 0.74 | 0.52 | |
| (keV) | 11.4 | 9.4 | |
| (1022 cm-2) | 1.0 | 1.05 | |
| Gaussian | (keV) | 12.54 | 12.15 |
| emission line | (keV) | 3.12 | 2.92 |
| Fluorescence | (keV) | 6.54 | 6.56 |
| iron line | (keV) | 0.2 | 0.1 (frozen) |
| (dof) | 1.2(51) | 4.4(52) |
3.2 INTEGRAL analysis
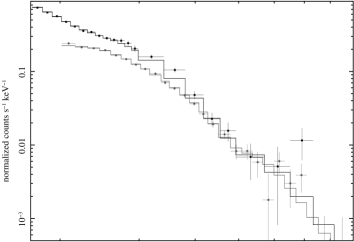
In Fig. 3, we present the combined JEM-X, ISGRI and SPI spectrum using all data. The spectra of all three instruments were fitted simultaneously with a cutoffpl model, using the latest response matrices provided by the OSA software (see Section 2.2 for more details). A factor term was included in the model to allow for the adjustement of efficiencies between different instruments. No photoelectric absorption has been used since the INTEGRAL spectra start only at 4 keV and none was required by the data. An absorption column below cm-2 is expected to have no noticeable effect below 5 keV. Nevertheless JEM-X data are needed to constrain the X-ray continuum model. Likewise, neither the very broad Gaussian at 12 keV, nor the iron fluorescence line at 6.4 keV are required by the JEM-X data and were therefore not added to the model. As can clearly be seen in Fig. 3, significant absorption line structures are present at 20 keV (the well known CRSF) and keV after fitting the continuum with a cutoffpl model (best-fit parameters of continuum are given in Table 3). Data from JEM-X, ISGRI and SPI have been fitted simultaneously.
| Component | Parameter | ||
|---|---|---|---|
| Continuum | 0.29 | ||
| (keV) | 9.06 | ||
| Normalization | 0.90 | ||
| 1.0 (frozen) | |||
| 1.29 | |||
| (dof) | 5.5(68) |
3.3 Combined RXTE and INTEGRAL analysis
To further explore this second feature and in order to achieve the highest significance at high energies, we jointly fitted the data of the high energy instruments of the two satellites, HEXTE, ISGRI, and SPI. We fixed the continuum parameters , the power law photon index and , the cutoff energy of the exponential cutoff, to the values given in Table 3.
In Table 4 we show the best fit parameters for each spectrum we used in Fig. 4. Data from SPI, ISGRI and HEXTE have been fitted individually. As the continuum parameters are frozen, we have not included them in this Table. The results of the spectral fits from three different instruments show that the values describing the shape of the cyclotron lines are consistent with one to another within uncertainties.
| Parameter | SPI | ISGRI | HEXTE |
|---|---|---|---|
| Fundamental | |||
| (keV) | 22.7 | 22.0 | 20.7 |
| 0.8 | 0.5 | 0.5 | |
| (keV) | 3 | 3 | 4 |
| Harmonic | |||
| (keV) | 42 | 47 | 48 |
| 0.9 | 0.8 | 0.6 | |
| (keV) | 3 | 10 | 8 |
| (dof) | 1.0(14) | 1.1(18) | 0.8(16) |
| Component | Parameter | ||
|---|---|---|---|
| Continuum | 0.29 (frozen) | ||
| (keV) | 9.1 (frozen) | ||
| Fundamental | (keV) | 21.4 | |
| 0.43 | |||
| (keV) | 3 | ||
| Harmonic | (keV) | 47.1 | |
| 0.88 | |||
| (keV) | 5 | ||
| (dof) | 1.4(41) |
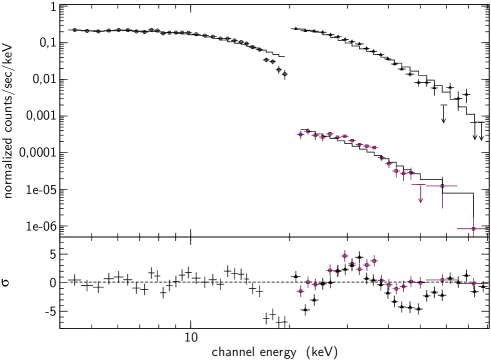
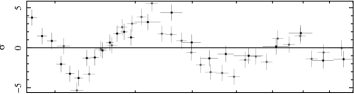
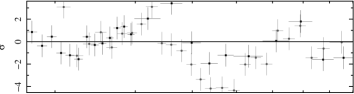
As evident from Fig. 4, the two cyclotron absorption features are clearly seen in the raw data of the three instruments. Although SPI has a very high energy resolution, the compared to ISGRI rather low signal-to-noise ratio required the use of rather broad energy bins. Therefore we will use ISGRI as the prime instrument in our study together with HEXTE while SPI data will be used for comparison. In summary, to get the best fit parameters of the absorption features, we have combined ISGRI and HEXTE data including a factor for free normalization between the two instruments (see Fig. 5 top panel). The two absorption features at 22 keV and 47 keV are modeled using the cyclabs model from XSPEC (Arnaud (1996)).
We started by modeling the fundamental cyclotron line that was discovered by the Ginga satellite observatory (Clark et al. clark90 (1990)) (see Fig. 5 second panel). After the inclusion of the fundamental cyclotron line at keV, the improves from 5.5 for 47 degrees of freedom (dof) to 3.4, for 44 dof (F-test: ). Although residuals improve significantly (see Fig. 5 third panel), another absorption feature can be seen at 47 keV. Including a second cyclotron line at keV improves the fit further resulting in a of 1.4 for 41 dof (F-test: see Fig. 5 bottom panel). ISGRI data (filled grey circles in Fig. 5) has a far better resolution than HEXTE at these energies. However, the overall shape is virtually identical, ruling out any instrumental or circumstantial effects. The final fit parameters are given in Table 5. Data from HEXTE and ISGRI have been fitted simultaneously.
The F-test is known to be problematic when used to test the significance of an additional spectral feature (see Protassov & van Dik ftest (2002)), even if systematic uncertainties are not an issue. However, the low false alarm probabilities may make the detection of the line stable against even crude mistakes in the computation of the significance (Kreykenbohm ingophd (2004)). Therefore, taking into account these caveats, we can conclude that the the first harmonic CRSF is detected with high significance in the spectrum of this source.
Although the uncertainties of the determined values are rather large, these values are consistent with one another within uncertainties. This makes it extremely unlikely that the 47 keV feature results from a calibration problem. Nevertheless, the line parameters depend slightly on the shape of the continuum (for example, using the NPEX component (Mihara mihara (1995)) and two cyclotron absorption lines, we obtained the line centre energies at 22 keV and 44 keV, for the fundamental and first harmonic respectively).
In short, this feature has been found to be present under the following circumstances:
-
•
Three different telescopes and instruments: Narrow Field Instruments (NFIs) on board BeppoSAX (Robba et al. robba (2001)), HEXTE on board RXTE, and IBIS/ISGRI on board INTEGRAL (this work).
-
•
Different epochs within the same telescope (i.e. 1996, 1997, 2001 using RXTE).
-
•
Different orbital phases within a given epoch and instrument (Fig. 1) .
We therefore conclude, that despite the relatively low significance of the feature in an individual observation, its detection in different epochs, configuration of the binary system, and different instrumentation, makes this feature highly significant. The most direct explanation for this absorption line like feature is that it is the first harmonic cyclotron line.
4 Summary and discussion
We presented the spectral analysis of 4U 153852 using data from RXTE and INTEGRAL. We present evidence for a previously unknown absorption line like feature in the phase-averaged spectrum of the source. As we have shown in Section 3, we have been able to achieve a good fit to the phase-averaged spectra by including a Lorentzian absorption line at 47 keV into the model (see Fig. 5). This absorption line is clearly visible whenever the signal-to-noise ratio in the spectrum is good enough to allow an analysis of the data. The most straightforward interpretation for this feature is that it is the first harmonic of the 22 keV fundamental CRSF.
According to the theory, cyclotron lines are due to the resonant scattering of photons by electrons whose energies are quantized into Landau levels by the magnetic field (Mészáros meszaros (1992)). The quantized energy levels of the electrons are harmonically spaced in the first order, such that the first harmonic line should be placed at twice the energy of the fundamental line, i.e. keV. In reality, however, the coupling factor between the fundamental and first harmonic is with slightly higher than 2.0. This anharmonic spacing, however, has been observed already in several systems where more than one line is present. As explained by Schönherr et al. (2007), the relativistic photon-electron scattering already produces some anharmonicity, because photons with energies close to the Landau levels may not escape the plasma if their energies are not changed by inelastic scattering. This, however, can not be the only reason because some systems show an anharmonic spacing larger than that predicted by this effect. A possibility to explain this difference is to take into account that the optical depths of the fundamental and the first harmonic could be different if they are formed at different heights above the neutron star. With increasing height, the strength of the magnetic field decreases resulting in a different CRSF energy. Another possibility is to consider a displacement of the magnetic dipole which would also explain the difference of energy of the two lines if the lines originate from the different poles of the neutron star. Therefore a significant phase dependence of the strength of the both lines is expected, however, the low signal-to-noise ratio at higher energies prevents us to test this hypothesis with the current data sets.
Acknowledgements.
We are grateful to the anonymous referee for useful and detailed comments. Part of this work was supported by the Spanish Ministry of Education and Science Primera ciencia con el GTC: La astronomía española en vanguardia de la astronomía europea CSD200670 and Multiplicidad y evolución de estrellas masivas project number AYA200806166C0303. This research has made use of data obtained through the High Energy Astrophysics Science Archive Research Center Online Service, provided by the NASA/Goddard Space Flight Center and through the INTEGRAL Science Data Center (ISDC), Versoix, Switzerland. SMN is a researcher of the Programme Juan de la Cierva, funded by the MICINN. JMT acknowledges the support by the Spanish Ministerio de Educación y Ciencia (MEC) under grant PR2007-0176. ACA thanks for the support of this project to the Spanish Ministerio de Ciencia e Innovación through the 2008 postdoctoral program MICINN/Fulbright under grant 2008-0116. JJRR acknowledges the support by the Spanish Ministerio de Educación y Ciencia (MEC) under grant PR2009-0455.References
- (1) Araya-Góchez, R. A. & Harding, A. K. 2000, ApJ, 544, 1067
- Arnaud (1996) Arnaud, K. A. 1996, in Astronomical Data Analysis Software and Systems V, ed. J. H. Jacoby & J. Barnes, ASP Conf. Ser. 101, San Francisco, 17.
- (3) Becker, R. H., Swank, J. H., Boldt, E. A.et al. 1977, ApJ, 216, L11
- (4) Bulik, T., Riffert, H., Mészáros, P. et al. 1995, ApJ, 444, 405
- (5) Clark, G. W., Woo, J. W., Nagase, F. et al. 1990, ApJ, 353, 274
- (6) Clark, G. W. 2000, ApJ, 542, L131
- (7) Coburn, W. 2001, Ph. D. thesis, University of California, San Diego
- (8) Coburn, W., Heindl, W. A., Rothschild, R. E., et al. 2002, ApJ, 580, 394
- (9) Coburn, W., Kretschmar P., Kreykenbohm, I., et al. 2005, ATel, 381, 1
- (10) Corbet, R. H. D., Woo, J. W. & Nagase, F. 1993, A&A, 276, 52
- (11) Davison, P. J. N., Watson, M. G. & Pye, J. P. 1977, MNRAS, 181, 73P
- (12) Harding, A. K. & Daugherty, J. K. 1991, ApJ, 374, 687.
- (13) Jahoda, K., Swank, J. H., Giles, A. B. et al. 1996, in EUV, X-ray and Gamma-Ray Instrumentation for Astronomy VII Proc. SPIE, ed. O. H. Siegmund & M. A. Gummin, vol. 2808, SPIE, 59
- (14) Kreykenbohm, I. 2004, Ph. D. thesis, University of Tübingen
- (15) Kreykenbohm, I., Coburn, W., Wilms, J.et al. 2002, A&A, 395, 129
- (16) Mészáros, P. 1992, High-energy radiation from magnetized neutron stars, University of Chicago Press
- (17) Mihara, T. 1995, Ph.D. thesis, University of Tokyo
- (18) Parkes, G. E., Murdin, P. G. & Mason, K. O. 1978, MNRAS, 184, 73P
- (19) Protassov, R. & van Dik, D. A. 2002, ApJ, 571, 545
- (20) Robba, N. R., Burderi, L., Di Salvo, T. et al. 2001, ApJ, 526, 950
- (21) Rodes, J. J., Torrejón, J. M. & Bernabéu, G. 2006, in The Many Scales in the Universe, ed. J. C. del Toro Iniesta, E. J. Alfaro, J. G. Gorgas, E. Salvador Solé & H. Butcher
- (22) Rodes, J. J. 2007, Ph.D. thesis, University of Alicante
- (23) Rodes-Roca, J. J., Torrejón, J. M. & Bernabéu, G. 2008, in Lectures Notes and Essays in Astrophysics III, ed. A. Ulla & M. Manteiga
- (24) Rothschild, R. E., Blanco, P. R., Gruber, D. E. et al. 1998, ApJ, 496, 538
- (25) Santangelo A., Segreto A., Giarrusso S. et al. 1999, ApJ, 523, L85
- (26) Schönherr G., Wilms J., Kretschmar P. et al. 2007, A&A, 472, 353
- (27) Tanaka, Y. 1986, in Radiation Hydrodynamics in Stars and Compact Objects, ed. Mihalas & K. H. A. Winkler (Springer Verlag), IAU Coll. 89, 198
- (28) Wilms, J., Nowak, M. A., Dove, J. B. et al. 1999, ApJ, 522, 460
- (29) Winkler, C., Courvoisier, T. J.-L., Di Cocco, G., et al. 2003, A&A, 411, L1