Evidence for mass ejection associated with long secondary periods in red giants
Abstract
Approximately 30% of luminous red giants exhibit a Long Secondary Period (LSP) of variation in their light curves, in addition to a shorter primary period of oscillation. The cause of the LSP has so far defied explanation: leading possibilities are binarity and a nonradial mode of oscillation. Here, large samples of red giants in the Large Magellanic Cloud both with and without LSPs are examined for evidence of an 8 or 24 m mid-IR excess caused by circumstellar dust. It is found that stars with LSPs show a significant mid-IR excess compared to stars without LSPs. Furthermore, the near-IR - color seems unaffected by the presence of the 24 m excess. These findings indicate that LSPs cause mass ejection from red giants and that the lost mass and circumstellar dust is most likely in either a clumpy or a disk-like configuration. The underlying cause of the LSP and the mass ejection remains unknown.
Subject headings:
stars: variables: other — stars: AGB and post-AGB — binaries: general — stars: low-mass, brown dwarfs — circumstellar matter — stars: mass loss1. Introduction
When red giants become more luminous than L⊙, they begin to vary with periods of variation which fall on six physically distinct period-luminosity sequences111On these sequences, stars on the first ascent giant branch (FGB) have slightly longer periods than those on the asymptotic giant branch (AGB) at the same luminosity (Ita et al., 2004; Soszyński et al., 2007). Some authors designate the corresponding FGB and AGB sequences as distinct sequences. (Wood et al., 1999; Ita et al., 2004; Soszyński et al., 2007; Fraser et al., 2008). As well as these six sequences for the most luminous red giants, there is another sequence (known as sequence-E) extending to lower luminosities and which is known to consist of close binary systems exhibiting ellipsoidal light variations (Wood et al., 1999; Soszyński et al., 2004).
Among the six luminous sequences all but the longest in period can be explained by radial pulsation in the fundamental and overtone modes (Wood et al., 1999). The longest period sequence, sequence-D, consists of stars that exhibit variations with a short period, usually corresponding to radial pulsation in a low overtone mode, as well as a Long Secondary Period (LSP). It is the LSPs that make up sequence-D in the period-luminosity diagram for variable red giants. Approximately 30% of all luminous red giants have LSPs (Wood et al., 1999; Percy & Bakos, 2003; Soszyński et al., 2007; Fraser et al., 2008) so the LSP phenomenon is very common in the late evolution of low mass stars. Soszyński et al. (2007) suggest that LSPs can be seen at very low amplitude in up to 50% of luminous red giants. The LSPs also seem to occur in red supergiants (Stothers & Leung, 1971).
Since the period of the LSP is approximately 4 times longer than the period of the normal-mode radial fundamental mode, the LSP can not be due to normal-mode radial pulsation. The most favoured explanations for the origin of LSPs are binarity and nonradial g-modes (Wood et al., 1999; Hinkle et al., 2002; Wood et al., 2004; Derekas et al., 2006; Soszyński, 2007; Hinkle et al., 2009), but these and other explanations for the LSPs all have significant problems (Wood et al., 2004; Nicholls et al., 2009). For example, stars exhibiting LSPs have velocity curves which generally are of similar shape and, in a binary model, this would indicate a favoured value for the angle of periastron of the orbit rather than the expected uniform distribution (Nicholls et al., 2009). In addition, the full amplitudes of the velocity curves are closely concentrated around 3.5 km s-1 (Nicholls et al., 2009) which implies the unlikely situation wherein all these stars have companions of a similar mass of 0.09 M⊙. The problem with the nonradial g-mode explanation for the LSPs is that g-modes, which have the correct periods, only have substantial amplitudes in radiative regions and red giants have convective envelopes with only a thin radiative layer on top (Wood et al., 2004). Currently, no satisfactory explanation for the LSPs exists.
Several of the suggested explanations for the LSPs in red giants involve circumstellar dust. The change in visible light associated with the LSP is typically of a rather irregular nature, and the light variation can be large, up to a factor of two. In the binary model, it has been suggested that the light change could be due to a large dust cloud orbiting with the companion and obscuring the red giant once per orbit (Wood et al., 1999). Another possible explanation for the LSPs (Wood et al., 1999) involves semi-periodic dust ejection events such as those predicted by theoretical models of AGB stars (Winters et al., 1994; Höfner et al., 1995).
Confirmation that dust was involved with the LSP phenomenon would be obtained if these stars showed a mid-infrared flux excess due to absorption of stellar light by circumstellar dust followed by re-radiation in the mid-IR. Both Hinkle et al. (2002) and Olivier & Wood (2003) examined the mid-IR colors of small samples of stars with LSPs in the solar vicinity using IRAS data. They found no evidence for a mid-IR excess that would indicate the presence of unusual amounts of circumstellar dust. With the completion of the Spitzer Space Telescope SAGE survey in the LMC (Meixner et al., 2006; Blum et al., 2006), it is now possible to search for the presence of a mid-IR excess in large samples of stars with LSPs, good contemporary light curves and a known distance. We now describe such a search.
2. Selection of samples of variables
The sample of variable stars examined here is taken from Fraser et al. (2008) who classified the luminous red giant variables in the LMC according to whether they belonged to sequence-D or sequences 1–4222Other authors use sequences C, C′, B and A in place of sequences 1–4, respectively, of Fraser et al. (2008). In addition, Soszyński et al. (2007) find a shorter period sequence that would be sequence 5 in the notation of Fraser et al. (2008).. The sequence-D stars exhibit light variations at both a primary period, which is usually on sequence-2 or sequence-3, and a Long Secondary Period, which falls on sequence-D. Examples of the light curves of typical sequence-D stars are shown in the top three panels of Figure 1.

The sequence-D sample of Fraser et al. (2008) was refined in a number of ways. To be retained in our sample of sequence-D stars, a star was required to show both the quasi-periodic LSP as well as a shorter primary period. In an initial examination of the light curves of the sequence-D stars in the catalog of Fraser et al. (2008), we found stars which have light curves that show a smooth, large amplitude variation as well as a variation of mean magnitude over very long timescales. Examples of their light curves are shown in the lower three panels of Figure 1. These are stars with large-amplitude, Mira-like pulsation, high mass loss rates and thick circumstellar dust shells and they belong on sequence-1. The dust shells cause them to appear fainter in the visible and near-IR part of the spectrum than they would appear without the dust shell. In the (,) plane, they thus lie below sequence-1, and they can take a position near or on sequence-D (e.g. Wood, 2003). In order to decrease the number of light curves to be examined to test for genuine sequence-D characteristics, we restricted our sample of sequence-D stars to have a value for the LSP falling on the main body of the sequence, defined by . This eliminates considerable numbers of the dusty, Mira-like stars assigned to sequence-D by Fraser et al. (2008), as well as some sequence-E stars. The light curves of all remaining stars within the main body of sequence-D and with were inspected and the dusty, Mira-like stars and sequence-E stars were removed. We limited our detailed examination of light curves to as it is these brighter stars that are used later in the paper for the comparison of mid-IR properties. A small number of other stars that did not have the required sequence-D light curve shape were also removed: these were normal semi-regular variables without obvious LSPs that are typical of sequences 2 and 3, and several R Coronae Borealis stars. In total, we removed 105 stars from the original sequence-D sample. Finally, about 5% of stars appeared twice in the lists of Fraser et al. (2008) under different MACHO names (because they were in overlapping parts of different MACHO fields): only one entry was retained for these stars.
Our aim is to see if unusual amounts of circumstellar dust are associated with stars exhibiting LSPs. In order to make such a test, we need a sample of stars that are identical to the stars with LSPs except that they do not have LSPs. This comparable sample is the combined group of stars on sequence-2 and sequence-3 i.e. stars with an oscillation similar to the primary oscillation period of the LSPVs. Hereinafter, we will refer to the variable stars on sequence-D as LSPVs and the stars on sequence-2 and sequence-3 as SRVs (semi-regular variables).
Looking at the light curves of the LSPVs and SRVs, it is clear that some variations are of low amplitude and therefore the periods, and hence the variability sequence, are not well determined. Fraser et al. (2008) determined periods by two methods - a Fourier analysis and a SuperSmoother method. In order to get samples of LSPVs and SRVs with reliable sequence determinations, we chose a subsample of the LSPVs and SRVs in which the SuperSmoother and Fourier period agreed to 5%. We call these the P5 samples. The stars in the P5 samples tend to have larger amplitudes and more regular variations than the remaining stars in the complete samples. The amplitude distribution of the two samples is shown later, in Section 3.3. For the stars with that are examined in detail in this paper, there are 4807 LSPVs and 4568 SRVs in the complete samples and 1568 LSPVs and 971 SRVs in the P5 samples.
3. Testing for circumstellar dust using mid-IR fluxes from the SAGE survey
Since cool circumstellar dust emits preferentially in the mid-IR (longward of 5 m) while the stellar photosphere emits mainly in the near-IR (shortward of 3 m), a large ratio of mid-IR flux to near-IR flux can be used as an indicator of circumstellar dust. The - color is a sensitive indicator of cool circumstellar dust, especially very cool dust with a temperature of 200 K, while the - color would be more sensitive to slightly warmer dust with K. A problem with the - color is that the SAGE survey only detected a 24 m flux from a small fraction of the bright red giants in the LMC. On the other hand, and 8 m flux was detected for most bright red giants. We now discuss both of these options.
3.1. The - color
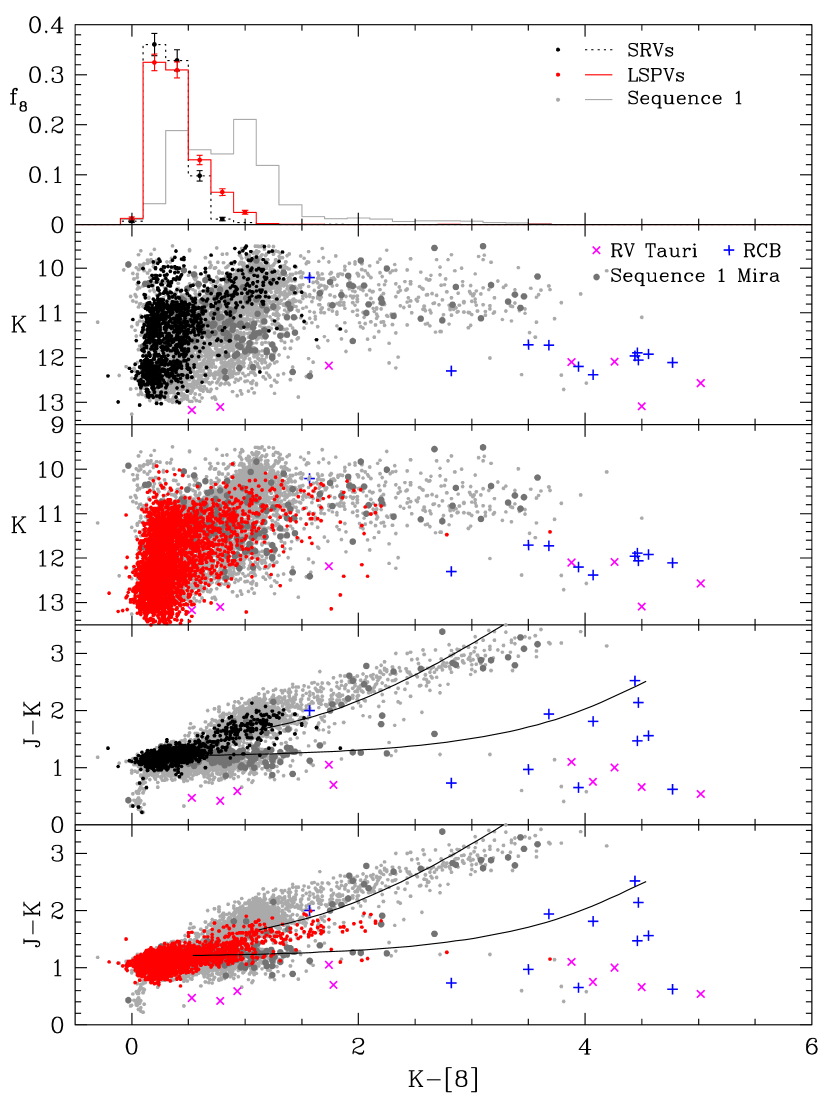
In Figure 2 we show and - plotted against - for the LSPVs and the SRVs in the P5 samples. Also shown are stars on sequence-1: these are fundamental mode radial pulsators and they include the Mira variables and large amplitude, high mass loss rate, dust enshrouded long period variables.
It is well known that, in the LMC, red giant stars with - are mostly carbon stars and those with - are oxygen-rich M or K stars (Cioni & Habing, 2003). The separation of the C- and O-rich stars is seen in the (-,-) diagrams in the lower two panels of Figure 2: the separation is seen most easily for the grey points of sequence-1. These diagrams also show that there is a long tail of sequence-1 stars extending from the clump of C stars around (-,-) = (1.1,1.8) to redder - and redder - colors. This tail contains many C-rich Mira variables, defined as sequence-1 variables with a MACHO blue amplitude greater than 2.5 magnitudes. However, the Mira variables are not confined to this region of the (-,-) diagram. There are even more of them lower in the diagram with - 1.4 and - 1.5: these are O-rich Mira variables.
Mira variables are AGB stars of relatively high mass loss rate with roughly spherical shells, perhaps with some clumpiness (see Olofsson 2004 for a review of the evidence for clumpiness in Mira winds). In order to get some idea of the positions of stars with spherical mass loss shells in the (-,-) diagram, models of such stars have been made with the code DUSTY (Ivezić et al., 1999) which is designed to model the spherical dust envelopes of mass-losing AGB stars. Two series of models were made, one for C stars and one for O-rich stars. The C star models had a central star which was assumed to be a blackbody of temperature 2200 K and the grains in the stellar wind emanating from the central star were assumed to be 50% amorphous carbon and 50% SiC. The O-rich models had a central blackbody with = 2700 K and warm silicate dust in the stellar wind. In both sets of models, the inner temperature of the dust shell was assumed to be 1000 K, and the model series had a range of V-band optical depths from 0.1 to 10, corresponding to mass loss rates of approximately 210-7 to 710-6 M⊙ yr-1 for a star with L⊙. These are simple approximations that do not allow for variation of the stellar temperature, inner boundary temperature or grain composition as the stars evolve. They are meant to provide a general idea of how mass-losing AGB stars evolve in the (-,-) diagram rather than a precise prediction.
The upper curve in the lower two panels of Figure 2 represents the sequence of model C stars with increasing mass loss rate. This corresponds, within the simple model approximations used here, to the tail of sequence-1 stars in the upper parts of the (-,-) diagrams. This tail thus represents the evolutionary sequence of C stars with spherical mass loss shells of increasing mass loss rate (see Groenewegen et al. 2007 for detailed mass loss rate estimates for these stars). The lower curve in the bottom two panels of Figure 2 is the equivalent curve for O-rich stars. It can be seen that many O-rich Miras fall on this curve.
The position of the high mass loss rate AGB stars with spherical shells contrasts with the position of the RV Tauri stars shown in Figure 2. The latter can have very large - colors but their - colors are similar to the colors of stars with unobscured photospheres. Since RV Tauri stars are luminous post-AGB stars containing a dusty circumbinary disk which radiates in the mid-IR (de Ruyter et al., 2005), a low - and a large - is likely to indicate a star with a dusty disk. This picture is consistent with the - colors of the R Coronae Borealis (RCB) stars, which are all C-rich. The dust associated with them is in neither a disk nor a spherical shell but arises from the ejection of puffs of dust in random directions, leading to a highly non-spherical dust distribution (Clayton, 1996). The - colors of the RCB stars scatter between the - colors of the RV Tauri stars and the high mass loss rate C-rich spherical shell sources, as expected in this model since the line of sight to some RCB stars would contain dust clouds while in other stars the photosphere would be seen unobscured.
The considerations above allow us to interpret the positions of the SRVs and LSPVs in Figure 2. The great majority of the oxygen-rich SRVs (-) have - 0.7, indicating very little mid-IR excess and low mass loss rates. Similarly, the C-rich SRVs lie mostly in the domain of the C stars with low mass loss rates on sequence-1. This contrasts with the LSPVs, both C- and O-rich, many of which appear to show some evidence for a - excess. For the C stars, the large fraction of LSPVs with a - excess can be clearly seen by comparing the lower two panels of the figure. The top panel of Figure 2 shows the - color distribution of the O-rich SRVs and LSPVs more quantitatively: the larger fraction of LSPVs with - 0.7 is clearly seen (11% of LSPVs have - 0.7 compared to 2.3% of SRVs). A two sample K-S test gives a probability less than that the SRVs and the LSPVs in the histograms come from the same underlying distribution i.e. the higher fraction of LSPVs with - 0.7 is extremely unlikely to be a statistical artifact. Note that in the histograms shown in Figure 2, and in subsequent figures, we have restricted the samples of stars to those with since most of the stars that have detectable 8 and 24 m fluxes have . In addition, first ascent giant branch stars are excluded by the restriction . At 8 m, we find that 99.4% of LSPVs (1561 stars), 99.8% of SRVs (969 stars) and 99.5% of sequence-1 variables (3964 stars) with were detected.
There is one notable feature of the (-,-) diagram for LSPVs. The reddest C-rich LSPVs have - colors that are similar to those of the unreddened C stars, and they are distinctly less than the - colors of the C-rich circumstellar shell sources in sequence-1 which have the same - color. There are also a few O-rich LSPVs with large - colors that fall near the RV Tauri stars. This suggests that mass loss from LSPVs is not spherically symmetric and that the dust may be in a circumstellar disk or some other non-spherical distribution. These results become much clearer when using the 24 m measurements from the SAGE survey, as we will now show.
3.2. The - color
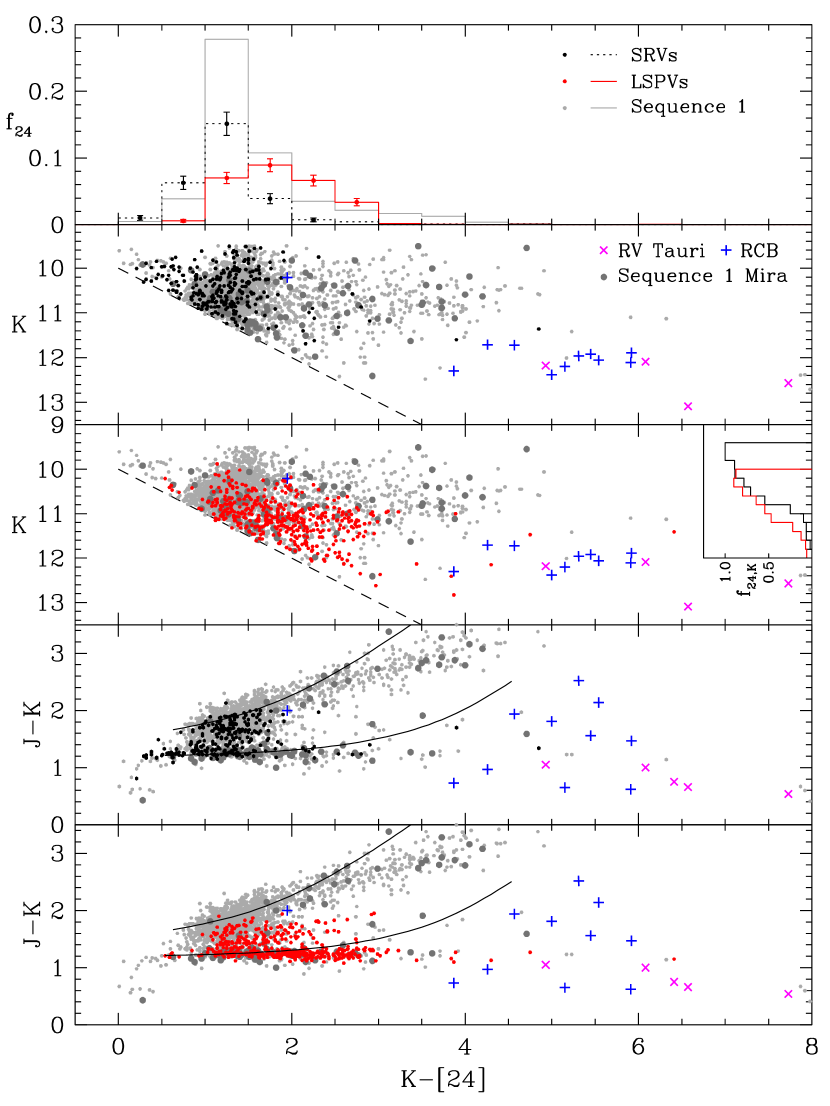
Figure 3 shows a plot similar to Figure 2 but using the - color. It is immediately obvious from comparing Figures 2 and 3 that only a small fraction of the sample was detected at 24 m. In the P5 samples, for objects brighter than , 27% of LSPVs (424 stars) and 28% of SRVs (269 stars) were detected at 24 m whereas essentially all stars were detected at 8 m. For the sequence-1 variables, 52% (2077 stars) brighter than were detected at 24 m.
Comparing the LSPV and SRV samples in the lower four panels of Figure 3, it appears that the LSPVs are much more likely to show a - excess than the SRVs. This is confirmed by the histogram of - colors in the top panel of the figure where it can be seen that a significantly larger fraction of LSPVs with have - 1.5 (72% of LSPVs have - 1.5 compared to 19% of SRVs). A two sample K-S test gives a probability less than that the SRVs and the LSPVs in the histograms come from the same underlying distribution.
Given the stronger mid-IR excess exhibited by the LSPVs, one would expect a larger fraction of LSPVs to be detected at 24 m than SRVs yet, as noted above, similar fractions of LSPVs (27%) and SRVs (28%) were detected. This is explained by the inset histogram in the middle panel of Figure 3 which shows the detection fraction as a function of magnitude. It is seen that the SRVs extend to brighter magnitudes than the LSPVs and that there is almost 100% detection of these brighter objects even though they do not have large - values. Most importantly, at all magnitudes where the LSPV and SRV samples both exist, the LSPV detection fraction is higher than the SRV detection fraction.
The C stars and the O-rich stars in the lower two panels of Figure 3 fall in distinct groups separated by the line - = 1.4, the C stars lying above this line. As with Figure 2, the - colors of the C-rich LSPVs in Figure 3 are smaller than those of the C-stars on sequence-1 which have high mass loss rates in spherical winds. The picture for the O-rich stars is less clear. On the one hand, there is a very large group of O-rich LSPVs with - 1.4 but red - colors which fall below the line of DUSTY models of increasing mass loss rate in spherical shells. This group of O-rich LSPVs seems to follow the sequence occupied by the RV Tauri stars with circumstellar disks. On the other hand, some sequence-1 Mira variables also follow this sequence while others have larger - values as suggested by the spherically symmetric models. It is not clear whether this diversity of behaviour is because the winds in Miras are not all spherically symmetric or if it is because the models are too simplistic333The O-rich models of Groenewegen (2006) follow the same general behaviour as the DUSTY models shown here but they tend to be 0.5 to 1 mag redder in - for the higher mass loss rates.. However, the reddest LSPVs with - 4 appear similar to the RV Tauri stars and they almost certainly have a non-spherically symmetric dust distribution. Overall, these results indicate that not only do the LSPVs produce more dust than equivalent SRVs without LSPs, but this dust appears to be in a non-spherical distribution about the star, possibly in a circumbinary disk.
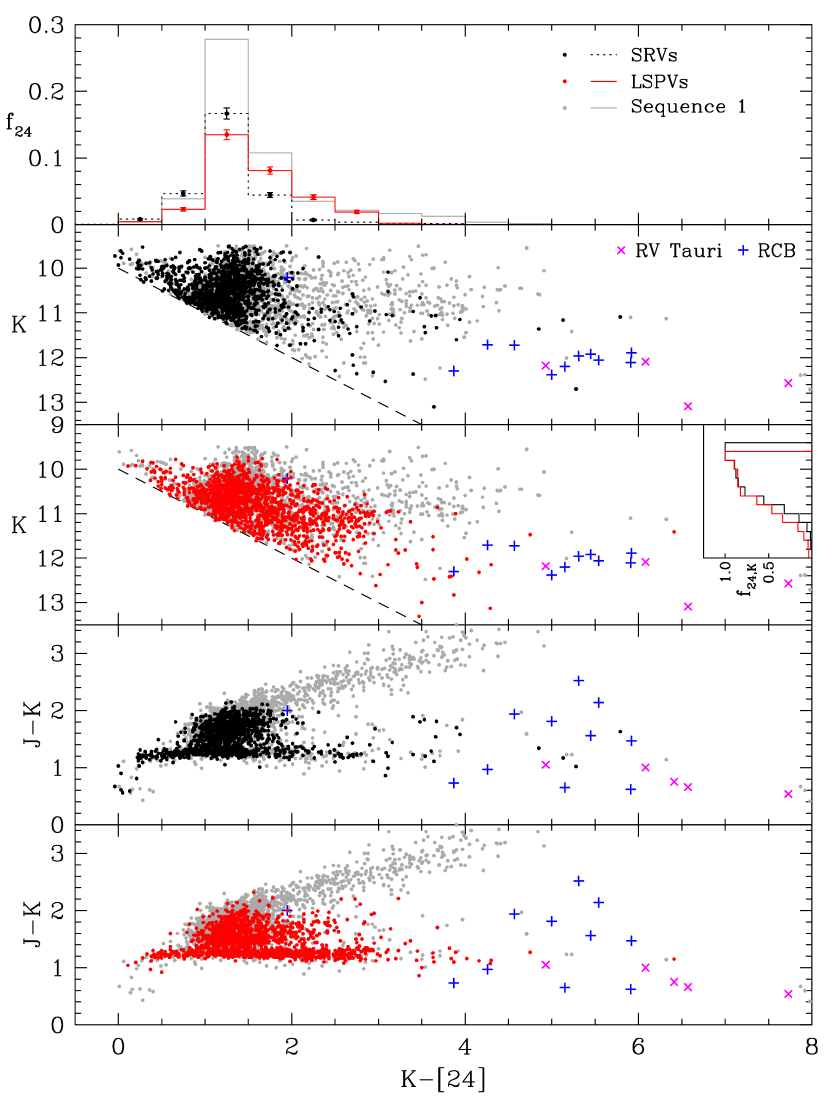
The numbers of stars in the P5 samples are moderate. However, the results shown above are confirmed by the larger number of stars in the complete samples, as shown in Figure 4. In the complete samples, for objects brighter than , 31% of LSPVs (1482 stars) and 28% of SRVs (1285 stars) were detected at 24 m. These fractions are similar to the detection fractions in the P5 samples.
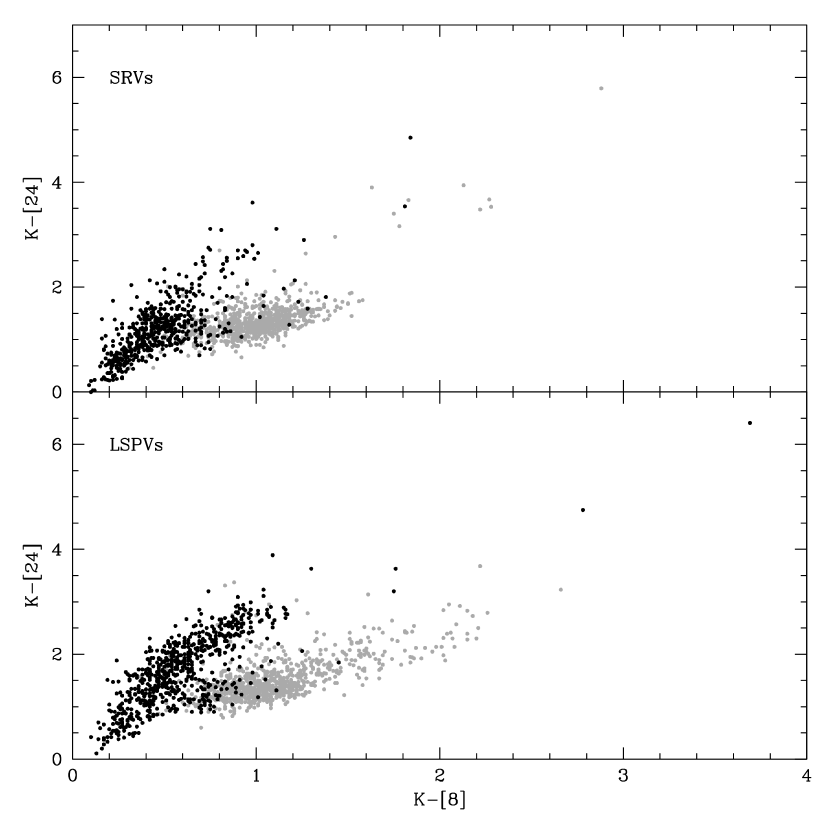
One question that arises is whether the stars that show a - excess are also the stars that show a - excess. We note that there are only 3 stars in the combined complete samples with a 24 m detection but not an 8 m detection, so that it is possible to compare the - excess with the - excess for essentially all stars. This is done in Figure 5 where - is plotted against - for all stars with in the complete samples. There are clearly two sequences in Figure 5, one for C stars and one for O-rich stars. Both sequences show a correlated increase in - color with - color. Thus stars with a - excess do also show a - excess. Note that the LSPVs have a higher fraction of red stars than the SRVs (as already demonstrated in Figures 2–4).
3.3. The effect of amplitude on - color
It has been shown above that the existence of a Long Secondary Period in a red giant seems to induce extra circumstellar dust formation. In this situation, it might be expected that the infrared excess caused by dust would depend on the light amplitude of the LSP. We now examine this suggestion.
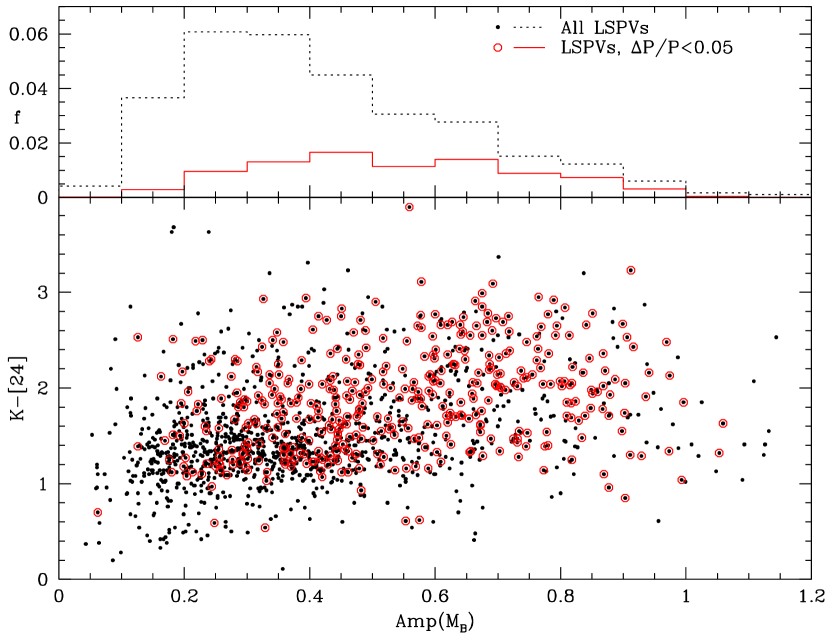
Figure 6 shows the - color plotted against the MACHO blue amplitude for LSPVs in the P5 and complete samples. We used the MACHO blue amplitude rather than the MACHO red amplitude as the phase coverage is generally better in blue than in red.
There is a slight increase of the - color with MACHO blue amplitude. A least squares fit gives for the complete sample and for the P5 sample. In both cases, the rms scatter of the - color about the fit is 0.50 magnitudes. Given this large scatter, a wide range in - color can be found at any given light amplitude. We conclude that the light amplitude does not seem to be an important factor in determining the amount of mass loss and the mid-IR excess of LSPVs.
The top panel of Figure 6 indicates that the LSPVs that are in the P5 sample have larger average amplitudes than those in the complete sample. This confirms our assertion in Section 2 .
It would be interesting to see if there was any correlation between the velocity amplitude of the LSP given in Nicholls et al. (2009) and the - color. Note that the radial velocity amplitude associated with the LSPs does not show any correlation with light amplitude (Nicholls et al., 2009). There are 16 LSPVs in the group of stars studied by Nicholls et al. (2009) that have - colors and 6 with - colors. A plot of the - and - colors against velocity amplitude for these small samples of stars did not show any particular correlation.
4. Summary and conclusions
We have shown that luminous red giant stars that exhibit Long Secondary Periods have larger mid-IR fluxes than similar stars without LSPs. This suggests that the LSP induces additional mass loss from the red giant, with consequent dust formation and an increase in the mid-IR flux. The mid-IR flux excess is only weakly dependent on the amplitude of the light variation of the LSP. A comparison of the near-IR - color with the mid-IR - and - colors indicates that the dust is not in a spherically symmetric distribution, and is perhaps in a disk.
Although dust is associated with the LSP phenomenon, it is still not clear what causes the LSP in the first place. In a binary model, where the velocity curves indicate predominantly eccentric orbits (Nicholls et al., 2009), mass transfer from the red giant near periastron could lead to a circumbinary disk. A non-radial pulsation mode of low degree could also produce non-spherical mass loss and a non-spherical dust distribution. The semi-periodic dust ejection events predicted by Winters et al. (1994) and Höfner et al. (1995) produce, and indeed require, circumstellar dust. However, this phenomenon has not been found to occur in theoretical models at the low luminosities where many of the LSPs are observed (even below the tip of the FGB). Furthermore, it is also not clear why the photospheric velocity should vary with the LSP for this purely circumstellar process.
One additional characteristic of LSPVs is that they have a chromosphere which varies with the LSP (Wood et al., 2004). It is likely that both the chromosphere and the excess circumstellar dust are manifestations of the influence of the LSP phenomenon on matter above the stellar photosphere. Magnetic effects are a possible source of the chromosphere, but a search for magnetic fields in two solar-vicinity LSPVs has put an upper limit of 100 Gauss on magnetic fields covering more than about 10% of the surface of these stars (Wood et al., 2009). Currently there is no evidence that magnetic fields are the source of the chromosphere.
In summary, we have shown here that the LSP phenomenon produces excess circumstellar dust compared to stars without LSPs. Unfortunately, since all the postulated models for the LSP are potentially capable of causing mass ejection, the present detection of excess dust around LSPVs does not help us distinguish between the various models.
References
- Alcock et al. (2001) Alcock, C. et al. 2001, ApJ, 554, 298
- Alcock et al. (1998) ——. 1998, AJ, 115, 1921
- Blum et al. (2006) Blum, R. D. et al. 2006, AJ, 132, 2034
- Cioni & Habing (2003) Cioni, M.-R. L., & Habing, H. J. 2003, A&A, 402, 133
- Clayton (1996) Clayton, G. C. 1996, PASP, 108, 225
- de Ruyter et al. (2005) de Ruyter, S., van Winckel, H., Dominik, C., Waters, L. B. F. M., & Dejonghe, H. 2005, A&A, 435, 161
- Derekas et al. (2006) Derekas, A., Kiss, L. L., Bedding, T. R., Kjeldsen, H., Lah, P., & Szabó, G. M. 2006, ApJ, 650, L55
- Fraser et al. (2008) Fraser, O. J., Hawley, S. L., & Cook, K. H. 2008, AJ, 136, 1242
- Groenewegen (2006) Groenewegen, M. A. T. 2006, A&A, 448, 181
- Groenewegen et al. (2007) Groenewegen, M. A. T. et al. 2007, MNRAS, 376, 313
- Hinkle et al. (2009) Hinkle, K. H., Fekel, F. C., & Joyce, R. R. 2009, ApJ, 692, 1360
- Hinkle et al. (2002) Hinkle, K. H., Lebzelter, T., Joyce, R. R., & Fekel, F. C. 2002, AJ, 123, 1002
- Höfner et al. (1995) Höfner, S., Feuchtinger, M. U., & Dorfi, E. A. 1995, A&A, 297, 815
- Ita et al. (2004) Ita, Y. et al. 2004, MNRAS, 347, 720
- Ivezić et al. (1999) Ivezić, Z., Nenkova, M., & Elitzur, M. 1999, User Manual for DUSTY, University of Kentucky Internal Report, accessible at http://www.pa.uky.edu/moshe/dusty
- Meixner et al. (2006) Meixner, M. et al. 2006, AJ, 132, 2268
- Nicholls et al. (2009) Nicholls, C. P., Wood, P. R., Cioni, M.-R. L., & Soszyński, I. 2009, MNRAS, in press, arXiv:astro-ph/0907.2975
- Olivier & Wood (2003) Olivier, E. A., & Wood, P. R. 2003, ApJ, 584, 1035
- Olofsson (2004) Olofsson, H. 2004, in Asymptotic Giant Branch Stars, ed. H. J. Habing & H. Olofsson, Astronomy and Astrophysics Library, 322–410
- Percy & Bakos (2003) Percy, J. R., & Bakos, A. G. 2003, in The Garrison Festschrift, ed. R. O. Gray, C. J. Corbally, & A. G. D. Philip, 49
- Soszyński (2007) Soszyński, I. 2007, ApJ, 660, 1486
- Soszyński et al. (2007) Soszyński, I. et al. 2007, Acta Astronomica, 57, 201
- Soszyński et al. (2004) ——. 2004, Acta Astronomica, 54, 347
- Stothers & Leung (1971) Stothers, R., & Leung, K. C. 1971, A&A, 10, 290
- Winters et al. (1994) Winters, J. M., Fleischer, A. J., Gauger, A., & Sedlmayr, E. 1994, A&A, 290, 623
- Wood (2003) Wood, P. R. 2003, in Astrophysics and Space Science Library, Vol. 283, Mass-Losing Pulsating Stars and their Circumstellar Matter, ed. Y. Nakada, M. Honma, & M. Seki, 3–10
- Wood et al. (1999) Wood, P. R. et al. 1999, in IAU Symposium, Vol. 191, Asymptotic Giant Branch Stars, ed. T. Le Bertre, A. Lebre, & C. Waelkens, 151–158
- Wood et al. (2009) Wood, P. R., Marsden, S., Waite, I., & Nicholls, C. P. 2009, in Stellar Pulsation: Challenges for Theory and Observation, ed. J. A. Guzik & P. Bradley, American Institute of Physics Conference Series, in press
- Wood et al. (2004) Wood, P. R., Olivier, E. A., & Kawaler, S. D. 2004, ApJ, 604, 800