Correlated X-ray and Very High Energy emission in the gamma-ray binary LS I +61 303 (catalog )
Abstract
The discovery of very high energy (VHE) gamma-ray emitting X-ray binaries has triggered an intense effort to better understand the particle acceleration, absorption, and emission mechanisms in compact binary systems, which provide variable conditions along eccentric orbits. Despite this, the nature of some of these systems, and of the accelerated particles producing the VHE emission, is unclear. To answer some of these open questions, we conducted a multiwavelength campaign of the VHE gamma-ray emitting X-ray binary LS I +61 303 (catalog ) including the MAGIC telescope, XMM-Newton, and Swift during 60% of an orbit in 2007 September. We detect a simultaneous outburst at X-ray and VHE bands, with the peak at phase 0.62 and a similar shape at both wavelengths. A linear fit to the simultaneous X-ray/VHE pairs obtained during the outburst yields a correlation coefficient of , while a linear fit to all simultaneous pairs provides . Since a variable absorption of the VHE emission towards the observer is not expected for the data reported here, the correlation found indicates a simultaneity in the emission processes. Assuming that they are dominated by a single particle population, either hadronic or leptonic, the X-ray/VHE flux ratio favors leptonic models. This fact, together with the detected photon indices, suggests that in LS I +61 303 (catalog ) the X-rays are the result of synchrotron radiation of the same electrons that produce VHE emission as a result of inverse Compton scattering of stellar photons.
Subject headings:
binaries: general — gamma rays: observations — stars: emission-line, Be — stars: individual (LS I +61 303 (catalog )) — X-rays: binaries — X-rays: individual (LS I +61 303 (catalog ))1 ETH Zurich, CH-8093 Switzerland \address2 INAF National Institute for Astrophysics, I-00136 Rome, Italy \address3 Universidad Complutense, E-28040 Madrid, Spain \address4 Technische Universität Dortmund, D-44221 Dortmund, Germany \address5 Universitat Autònoma de Barcelona, E-08193 Bellaterra, Spain \address6 Università di Padova and INFN, I-35131 Padova, Italy \address7 Inst. de Astrofísica de Canarias, E-38200 La Laguna, Tenerife, Spain \address8 University of Łódź, PL-90236 Lodz, Poland \address9 Deutsches Elektronen-Synchrotron (DESY), D-15738 Zeuthen, Germany \address10 Max-Planck-Institut für Physik, D-80805 München, Germany \address11 Università di Siena, and INFN Pisa, I-53100 Siena, Italy \address12 Universitat de Barcelona (ICC/IEEC), E-08028 Barcelona, Spain \address13 Universität Würzburg, D-97074 Würzburg, Germany \address14 IFAE, Edifici Cn., Campus UAB, E-08193 Bellaterra, Spain \address15 Depto. de Astrofísica, Universidad de La Laguna, E-38206 La Laguna, Tenerife, Spain \address16 Università di Udine, and INFN Trieste, I-33100 Udine, Italy \address17 Institut de Ciències de l’Espai (IEEC-CSIC), E-08193 Bellaterra, Spain \address18 Inst. de Astrofísica de Andalucía (CSIC), E-18080 Granada, Spain \address19 Rudjer Boskovic Institute, Bijenicka 54, HR-10000 Zagreb, Croatia \address20 University of California, Davis, CA 95616-8677, USA \address21 Tuorla Observatory, University of Turku, FI-21500 Piikkiö, Finland \address22 Inst. for Nucl. Research and Nucl. Energy, BG-1784 Sofia, Bulgaria \address23 INAF/Osservatorio Astronomico and INFN, I-34143 Trieste, Italy \address24 ICREA, E-08010 Barcelona, Spain \address25 Università di Pisa, and INFN Pisa, I-56126 Pisa, Italy \address26 Supported by INFN Padova \address27 Now at: Centro de Investigaciones Energéticas, Medioambientales y Tecnológicas (CIEMAT), Madrid, Spain \address28 Deceased \address29 Send offprint requests to T. Jogler jogler@mppmu.mpg.de, N. Puchades neus@ifae.es, M. Ribó mribo@am.ub.es \address30 Pennsylvania State University, PA 16802, USA \address31 NASA/Goddard Space Flight Center, Greenbelt, MD 20771, USA \address32 Special Astrophysical Observatory RAS, 369167, Russia \address33 National Radio Astronomy Observatory, Socorro, NM 87801, USA \address34 University of Crete, Heraklion, G-71110, Greece
1. Introduction
LS I +61 303 (catalog ) is one of the few X-ray binaries that have been detected in very high energy (VHE) gamma rays (see, e.g., Paredes 2008 for a recent review). It is a high-mass X-ray binary system located at a distance of 2.00.2 kpc (Frail & Hjellming, 1991). The system contains a rapidly rotating early type B0 Ve star with a persistent equatorial decretion disk and mass loss, and a compact object with a mass between 1 and 4 orbiting it every 26.5 d in an eccentric orbit (see Casares et al. 2005; Grundstrom et al. 2007; Aragona et al. 2009, and references therein). LS I +61 303 (catalog ) was classified as a microquasar based on structures detected from five to several tens of milliarcseconds with the European VLBI Network (EVN) and MERLIN (Massi et al. 2004, and references therein), although analysis of later EVN and MERLIN data sets does not reveal the presence of such structures (Dhawan et al., 2006; Albert et al., 2008a). Very Long Baseline Array (VLBA) images with a resolution of 1 mas (2 AU at the source distance) obtained during a full orbital cycle show an elongated structure that rotates as a function of the orbital phase (Dhawan et al., 2006). Later VLBA images show repeating structures at the same orbital phases, reinforcing the idea that the milliarcsecond structure depends on the orbital phase (Albert et al., 2008a). This may be consistent with a model based on the interaction between the relativistic wind of a young non-accreting pulsar and the wind/decretion disk of the stellar companion (Dubus, 2006a), as occurs in PSR B125963 (but confining the pulsar wind may be problematic; see Bogovalov et al. 2008).
LS I +61 303 (catalog ) shows periodic non-thermal radio outbursts on average every =26.49600.0028 d, with the peak of the radio emission shifting progressively from phase 0.45 to 0.95, using =JD 2,443,366.775, with a modulation period of 16678 d (Gregory, 2002). According to the most precise orbital parameters, the periastron takes place at phase 0.275 and the eccentricity of the orbit is (Aragona et al., 2009).
LS I +61 303 (catalog ) has been observed several times in X-rays (see Smith et al. 2009 and references therein). It generally displays quasi-periodic X-ray outbursts, with the maximum occurring between orbital phases 0.4 and 0.8 (Goldoni & Mereghetti, 1995; Taylor et al., 1996; Paredes et al., 1997; Harrison et al., 2000; Esposito et al., 2007), although the lack of a sensitive long-term monitoring has prevented to search for a super-orbital modulation. The source also shows short-term variability on timescales of hours (Sidoli et al., 2006).
At VHE gamma rays, LS I +61 303 (catalog ) has been clearly detected several times both by MAGIC (Albert et al., 2006, 2008a, 2009) and VERITAS (Acciari et al., 2008, 2009). The source also displays VHE gamma-ray periodicity, with minima taking place near periastron, where only upper limits were found in MAGIC observations, and maxima occurring on average at phase 0.6–0.7, although the source has also shown a second peak at phase 0.84 in one of the cycles (Albert et al., 2009). There are indications of correlated X-ray/VHE emission, based on non-simultaneous data taken more than 6 hr apart (Albert et al., 2009), and 1 d apart (Albert et al., 2008a).
The lack of a systematic behavior from cycle to cycle at X-ray and VHE bands, and the occurrence of short-term variability in the X-ray flux, has hampered the definitive detection of an X-ray/VHE correlation from the comparison of non-simultaneous data. We therefore conducted a multiwavelength campaign in 2007 September, covering the epoch of maximum VHE emission. Here, we report the first simultaneous VHE and X-ray observations of LS I +61 303 (catalog ) obtained with the MAGIC Cherenkov telescope and the XMM-Newton and Swift X-ray satellites that show correlated emission in both energy bands. We also briefly comment on radio and optical spectroscopic observations obtained during the campaign.
2. Observations and data analysis
2.1. VHE Gamma Rays
The VHE gamma-ray observations were performed from 2007 September 4 to 21 using the MAGIC telescope on the Canary Island of La Palma (N, W, 2225 m a.s.l.), from where LS I +61 303 (catalog ) is observable at zenith angles above . The essential parameters of MAGIC are a 17 m diameter segmented mirror of parabolic shape (currently the largest dish for an air Cherenkov telescope), an of 1.05, and an hexagonally shaped camera of 576 hemispherical photo multiplier tubes with a field of view of diameter. MAGIC can detect gamma rays from 60 GeV to several TeV, and with a special setup the trigger threshold can be reduced to 25 GeV (Aliu et al., 2008). Its energy resolution is % above energies of 200 GeV. The current sensitivity is 1.6% of the Crab Nebula flux for a detection in 50 hr of on-source time. The improvement compared to the previous sensitivity was achieved by installing new 2 GHz FADCs (Albert et al., 2008b).
The total observation time was 58.8 hr, including 39.6 hr in dark conditions and 19.2 hr under moonlight or twilight (Britzger et al., 2009). The range of zenith angles for these observations was , with 96% of the data having zenith angles below . The final effective total observation time is 54.2 hr. Table 1 gives the MJD, the effective observation time, and the orbital phase for each of the MAGIC observations. The observations were carried out in wobble mode (Fomin et al., 1994), i.e., by alternately tracking two positions at offset from the source position. This observing mode provides a reliable background estimate for point-like sources such as LS I +61 303 (catalog ).
| MJDa | Obs. Time | Phase Range | b |
|---|---|---|---|
| (minutes) | (10-12 cm-2 s-1) | ||
| 203.0 | 0.470–0.476 | ||
| 210.1 | 0.508–0.514 | ||
| 214.5 | 0.544–0.551 | ||
| 219.8 | 0.584–0.590 | ||
| 221.1 | 0.621–0.627 | ||
| 224.2 | 0.659–0.665 | ||
| 212.5 | 0.697–0.703 | ||
| 172.4 | 0.734–0.741 | ||
| 148.7 | 0.771–0.777 | ||
| 178.1 | 0.809–0.816 | ||
| 179.3 | 0.847–0.854 | ||
| 184.4 | 0.885–0.892 | ||
| 177.3 | 0.923–0.929 | ||
| 183.1 | 0.960–0.967 | ||
| 188.7 | 0.998–0.005 | ||
| 138.6 | 0.036–0.043 | ||
| 195.7 | 0.073–0.081 |
The data analysis was performed using the standard MAGIC analysis and reconstruction software (Albert et al., 2008c). The quality of the data was checked and data taken with anomalous event rates (very low atmospheric transmission, car light flashes, etc.) were rejected following the standard procedure, as previously done in Albert et al. (2009). From the remaining events, image parameters were calculated (Hillas, 1985). In addition, the time parameters described in Aliu et al. (2009) were calculated as well. For the /hadron separation, a multidimensional classification procedure based on the image and timing parameters with the Random Forest method was used (Albert et al., 2008d). We optimized the signal selection cuts with contemporaneous Crab Nebula data taken at the same zenith angle range. The energy of the primary -ray was reconstructed from the image parameters using also a Random Forest method. The differential energy spectrum was unfolded taking into account the full instrumental energy resolution (Albert et al., 2007). We estimate the systematic uncertainty to be about 30% for the derived integral flux values and 0.2 for the obtained photon index. For more details on the systematic uncertainties present in the MAGIC data, see Albert et al. (2008c).
2.2. X-rays
We observed LS I +61 303 (catalog ) with XMM-Newton during seven runs from 2007 September 4 to 11, lasting from 12 to 18 ks (see Table 2), amounting to a total observation time of 104.3 ks. The EPIC pn detector used the Large Window Mode, while the EPIC MOS detectors used the Small Window Mode. All detectors used the medium thickness optical blocking filter. Data were processed using version 8.0.0 of the XMM-Newton Science Analysis Software (SAS). Known hot or flickering pixels were removed using the standard SAS tasks. Further cleaning was necessary to remove from the data set periods of high background corresponding to soft proton flares, reducing the net good exposure durations to 67.0 and 92.6 ks for the pn and MOS detectors, respectively.
| Exposure Time | |||||||||||
| MJDa | Total | pn | MOS | Phase Range | b | (wabs) | / | d.o.f. | Variab./ | Signif. | |
| (ks) | (ks) | (ks) | ( erg cm-2 s-1) | ( cm-2) | (%)/ | () | |||||
| 12.4 | 10.8 | 12.4 | 0.434–0.440 | 446.2/ | 382 | 17.1/ | 22.5 | ||||
| 13.1 | 5.6 | 9.1 | 0.507–0.513 | 379.8/ | 352 | 16.8/ | 15.1 | ||||
| 18.3 | 10.5 | 17.1 | 0.546–0.554 | 536.5/ | 422 | 11.8/ | 13.8 | ||||
| 17.1 | 10.9 | 12.1 | 0.583–0.590 | 431.6/ | 400 | 12.1/ | 12.8 | ||||
| 14.7 | 5.8 | 13.2 | 0.621–0.627 | 496.7/ | 447 | 6.8/ | 5.9 | ||||
| 14.5 | 11.9 | 14.5 | 0.659–0.665 | 467.5/ | 429 | 5.9/ | 1.9 | ||||
| 14.2 | 11.5 | 14.2 | 0.696–0.702 | 439.5/ | 407 | 10.0/ | 8.0 | ||||
| 3.3 | … | … | 0.716–0.722 | 0.5 (fixed) | 5.38/ | 14 | 18.4/ | 1.1 | |||
| 2.7 | … | … | 0.754–0.759 | 0.5 (fixed) | 8.83/ | 15 | 10.7/ | 0.3 | |||
| 3.3 | … | … | 0.792–0.797 | 0.5 (fixed) | 9.83/ | 26 | 9.9/ | 0.4 | |||
| 3.3 | … | … | 0.830–0.835 | 0.5 (fixed) | 13.07/ | 20 | 15.3/ | 1.2 | |||
| 3.8 | … | … | 0.848–0.855 | 0.5 (fixed) | 20.46/ | 32 | 6.3/ | 0.1 | |||
| 5.3 | … | … | 0.911–0.926 | 0.5 (fixed) | 34.52/ | 50 | 12.7/ | 0.4 | |||
| 2.1 | … | … | 0.996–0.014 | 0.5 (fixed) | 5.45/ | 11 | 25.0/ | 1.7 | |||
| 2.5 | … | … | 0.034–0.042 | 0.5 (fixed) | 9.71/ | 13 | 9.3/ | 0.1 | |||
| 2.2 | … | … | 0.127–0.130 | 0.5 (fixed) | 10.14/ | 12 | 10.1/ | 0.5 | |||
Cleaned pn and MOS event files were extracted for spectral analysis. Source spectra were extracted from a radius circle centered on the source (point-spread function of ) while background spectra were taken from a number of source-free circles with radius (three for the pn detector, four for MOS1, and five for MOS2). The extracted spectra were analyzed with XSpec v12.3.1 (Arnaud, 1996). The spectra were binned so that a minimum of 20 counts per bin were present and energy resolution was not oversampled by more than a factor 3. An absorbed power-law function (wabs*powerlaw) yielded satisfactory fits for all observations. De-absorbed fluxes in the 0.3–10 keV range were computed from the spectral fits.
Additional observations of 2–5 ks each, consisting of several pointings of 0.2–1.0 ks, were obtained with the Swift/XRT from 2007 September 11 to 22. The total observation time was 28.5 ks. The Swift data were processed using the FTOOLS task xrtpipeline (ver. 0.12.1 under HEASoft 6.6). The spectral analysis procedures were the same as those used for the XMM-Newton data. Since the hydrogen column density was poorly constrained, with typical values of cm-2, we fixed it to cm-2, a typical value for LS I +61 303 (catalog ) also found in the XMM-Newton fits and close to the average value for the Swift fits.
To search for short-term X-ray variability, we also extracted 0.3–10 keV background-subtracted light curves for each observation, binned to 100 s for XMM-Newton and at half-time of the sparse 0.2–1.0 ks Swift pointings within each observation. For XMM-Newton, we considered the sum of the count rate in the three detectors. From these light curves, we computed the degree of variability as the standard deviation with respect to the mean of the count rate divided by this mean, and the significance of this variability computed from the probability of the count rate being constant. We also computed hardness ratios as the fraction between the count rates above and below 2 keV.
3. Results
3.1. VHE Gamma Rays
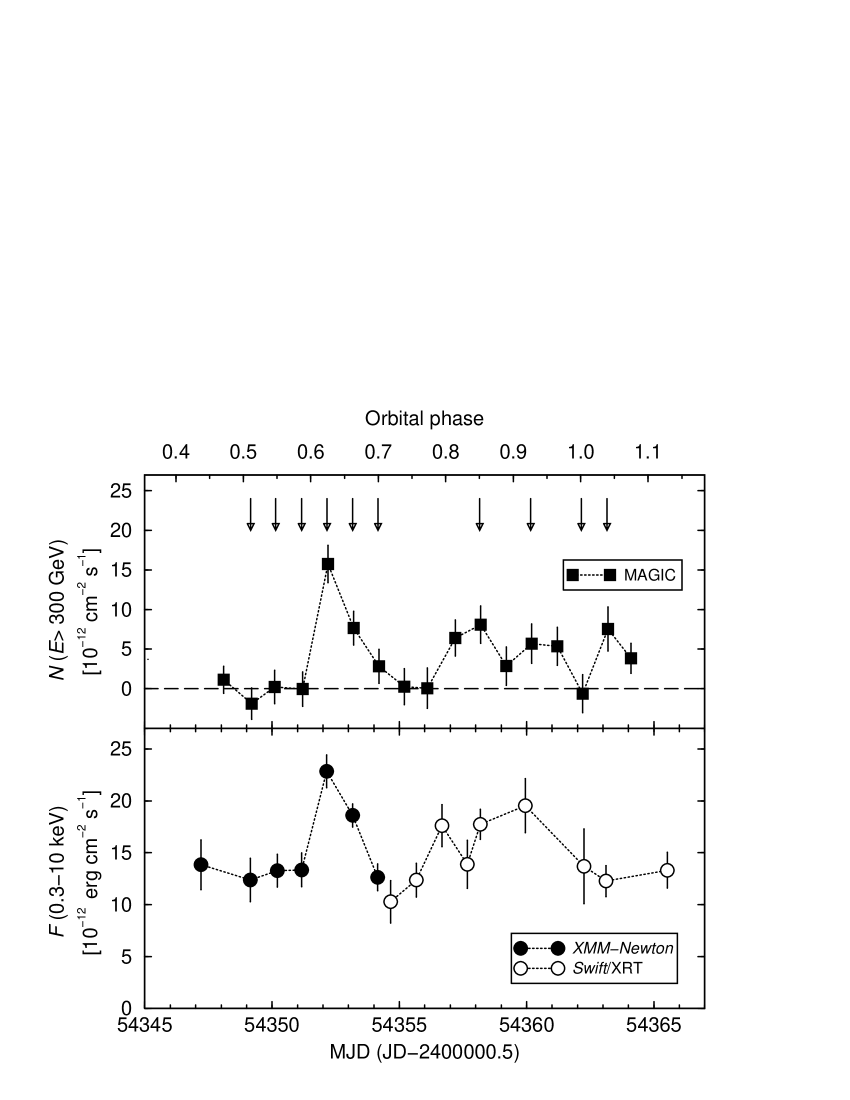
The measured fluxes of LS I +61 303 (catalog ) at energies above 300 GeV are listed in Table 1, and the corresponding light curve is shown in Figure 1 (top). The periodically modulated peak emission (Albert et al., 2009) is prominently seen as the highest flux value of these observations at phase 0.62 (followed by a smaller flux at phase 0.66). In addition to this established feature we measured, as in 2006 December, significant flux on a nightly basis at phase 0.85. We note that there is significant flux in the phase range 0.8–1.0 at the level of cm-2 s-1, which is compatible with the 2 upper limit we obtained for the shorter 2006 observations (Albert et al., 2009).
3.2. X-rays
We summarize in Table 2 the parameters of the spectral fits and variability obtained for both the XMM-Newton and Swift/XRT data sets. All X-ray fluxes quoted hereafter are de-absorbed. We note that there is no significant hardness ratio change within each of the observations, in contrast to what was found in the XMM-Newton observations reported by Sidoli et al. (2006). In principle this implies that, for each observation, the flux and corresponding uncertainty obtained from the spectral fit is a good estimate of the flux during the whole observation. However, moderate count-rate variability on timescales of ks is present in most observations, ranging from 6% to 17% for the XMM-Newton data and from 9% to 25% for the Swift data (see Table 2). The rms of this variability should be considered in addition to the statistical uncertainty when providing a flux measurement spanning several ks. We converted this count-rate variability into flux variability by multiplying the degree of variability defined in Section 2.2 with the fluxes coming from the spectral fits. Since no spectral change is detected within each observation, we added this flux variability in quadrature to the spectral fits flux errors. This procedure provides the more realistic total flux uncertainties quoted in parentheses in Table 2, and used hereafter.
We show in Figure 1 (bottom) the 0.3–10 keV light curve of LS I +61 303 (catalog ). The source displays a steady flux during the first four observations and shows a steep increase at phase 0.62, which is followed by a slower decay up to phase 0.69 (XMM-Newton) and probably up to phase 0.72 (Swift). The behavior is very similar to the one seen at VHE gamma rays, although at X-ray energies the baseline has a significant flux. Later on there is a significant increase of the X-ray flux up to phase 0.8. This high flux is detected with a sparse sampling up to phase 0.9, and the source goes back to its baseline flux at phase 1.0. This high X-ray flux between phases 0.8 and 1.0 occurs when the source is also detected at VHE gamma rays.
3.3. X-Ray/VHE Gamma-Ray Correlation
A clear correlation between the X-ray and VHE gamma-ray emissions is seen during the outburst, with a simultaneous peak at phase 0.62 (see Figure 1). To study the significance of this correlation, we selected the X-ray data sets that overlap with MAGIC observations. There are six overlapping MAGIC/XMM-Newton data sets, for which strictly simultaneous observations range from 3.3 to 3.9 hr. For the four overlapping MAGIC/Swift data sets, the strictly simultaneous observations range from 2.2 to 4.1 hr (although the Swift runs have gaps). We plot in Figure 2 the X-ray fluxes against the VHE fluxes (from Tables 1 and 2) for all 10 simultaneous pairs, which are marked with arrows in Figure 1. The linear correlation coefficient for the six simultaneous MAGIC/XMM-Newton pairs that trace the outburst is . For the ten simultaneous pairs, we find (a larger than that has a probability of about to be produced from independent X-ray and VHE fluxes). Minimizing we obtain for 8 degrees of freedom and the following relationship: (0.3–10 keV)/[10-12 erg cm-2 s(300 GeV)/[10-12 cm-2 s (non-Gaussian uncertainties). This fit is plotted as a solid line in Figure 2.
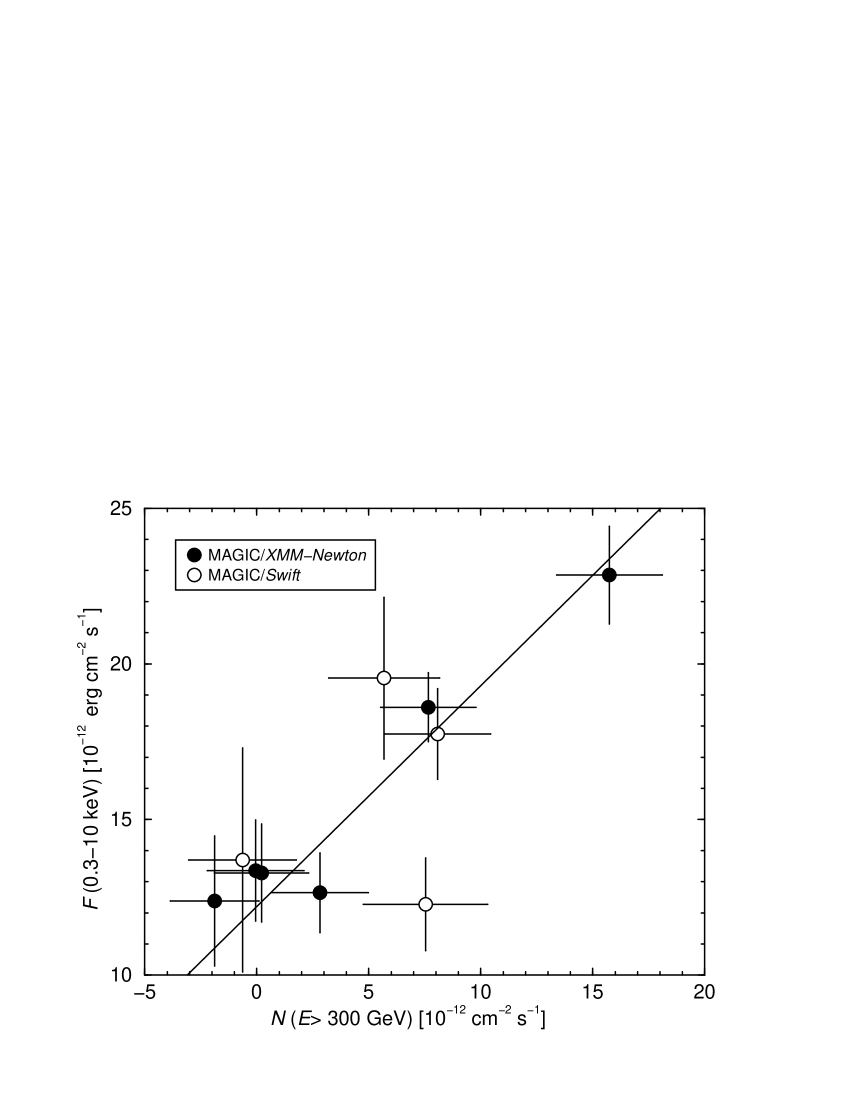
However, as can be seen in Figure 2, the flux uncertainties are relatively large. This calls for a test of the reliability of the correlation strength considering the errors of individual data points. To this end, we use the -Transformed Discrete Correlation Function (ZDCF), which determines 68% confidence level intervals for the correlation coefficient from unevenly sampled data (see, e.g., Edelson & Krolik 1988; Alexander 1997). The Fisher -transform of the linear correlation coefficient is used to estimate the 68% confidence level interval. Applying the ZDCF to the X-ray and VHE light curves reported here we obtain the following uncertainties for the linear correlation coefficient: . The sensitivity of the MAGIC telescope requires observation times of several hours to be able to get few-sigma detections for the VHE fluxes from LS I +61 303 (catalog ). During such long periods, the X-ray fluxes have quite large intrinsic variability (see Table 2). This results in quite large uncertainties on both the VHE and X-ray fluxes that restrict the ability to determine a possible correlation out of the outburst.
4. Discussion
We have discovered an X-ray/VHE gamma-ray correlation in the gamma-ray binary LS I +61 303 (catalog ) based on simultaneous multiwavelength data obtained with MAGIC, XMM-Newton, and Swift during a single orbital cycle. The correlation is mainly due to the very similar trends of the detected flux during the outburst around orbital phase 0.62, while the uncertainties prevent to be sure about the existence of the correlation outside the outburst. Given the variability in the X-ray flux (up to 25% on hour scales), it is necessary to program simultaneous observations to perform correlation studies in LS I +61 303 (catalog ). This conclusion has also been reached recently by the VERITAS Collaboration, when reporting the lack of X-ray/VHE correlation based on contemporaneous data with a VHE sampling that is not dense enough (Acciari et al., 2009). Although a similar X-ray/VHE correlation has been obtained for the VHE gamma-ray emitting X-ray binary LS 5039 (catalog ), this result was based on non-simultaneous data acquired years apart (Aharonian et al., 2005, 2006; Takahashi et al., 2009).
The VHE emission within a binary system can suffer photon–photon absorption via pair creation, mainly with the stellar optical/ultraviolet photons. In LS I +61 303 (catalog ), this absorption is only expected to be significant toward the observer for GeV just before periastron (Dubus, 2006b; Bednarek, 2006; Sierpowska-Bartosik & Torres, 2009), a phase range not explored here. In addition, the quoted X-ray fluxes are already de-absorbed (and the hydrogen column densities and the associated errors are low). Overall, there are no absorption effects to be considered. Therefore, the X-ray/VHE correlation we have found for LS I +61 303 (catalog ) cannot be an artifact due to variable absorption toward the source. This indicates that the emission processes at both wavelengths occur at the same time and are probably the result of a single physical mechanism. In this context, it is reasonable to assume that the X-ray and VHE emissions are produced by a single particle population.
It is interesting to note that the MAGIC spectrum in the 0.6–0.7 phase range yields erg cm-2 s-1 for GeV, while the X-ray flux is erg cm-2 s-1. Therefore, the total X-ray flux is approximately twice the VHE flux. However, if we subtract an apparent baseline X-ray flux of erg cm-2 s-1, the resulting X-ray flux is similar to the total VHE flux in the phase range 0.6–0.7. If the radiation mechanisms are dominated by a single particle population, the X-ray/VHE correlation and the smaller/similar VHE fluxes favor leptonic models. In hadronic models, the X-ray emitting and the VHE photons would come from the same protons (for reasonable values of the magnetic field), and the luminosity of the radiation should be that of VHE gamma-rays (see Figure 5 of Kelner et al. 2006 for reasonable proton energy distributions) unlike it is observed. In addition, the inverse Compton (IC) cooling channel is less efficient than the synchrotron channel to produce the detected X-ray emission for reasonable values of the magnetic field (see Takahashi et al. 2009 for a similar discussion for LS 5039 (catalog )). This clearly suggests that the X rays are the result of synchrotron radiation of the same electrons that produce VHE emission as a result of IC scattering of optical/ultraviolet stellar photons.
The observed photon indices of the simultaneous X-ray and VHE spectra are consistent with one population of electrons following a power-law energy distribution with index 2.1. These electrons would produce X-rays via synchrotron and VHE photons via IC with an interaction angle . We note that an electron index of 2.1 is too hard if synchrotron cooling dominates in the X-ray range, since it implies an injected electron index of 1.1. On the other hand, dominant adiabatic cooling implies an injection index of 2.1, a more reasonable value (see, for example, the discussion in Takahashi et al. 2009). Although small changes in the VHE spectrum would be expected due to variations in the IC interaction angle or the electron index (as seen in X-rays), at present they are not detectable due to the large uncertainties of the VHE photon index.
Finally, we note that contemporaneous radio light curves obtained with RATAN, VLBA images, and H spectroscopy are consistent with previous results (Gregory, 2002; Dhawan et al., 2006; Zamanov et al., 1999). Details on these observations will be reported elsewhere. Therefore, the X-ray/VHE correlation occurred when the source was showing a standard behavior in both its outflow (radio) and decretion disk (H line).
References
- Acciari et al. (2008) Acciari, V. A., et al. 2008, ApJ, 679, 1427
- Acciari et al. (2009) Acciari, V. A., et al. 2009, ApJ, 700, 1034
- Aharonian et al. (2005) Aharonian, F., et al. 2005, Science, 309, 746
- Aharonian et al. (2006) Aharonian, F., et al. 2006, A&A, 460, 743
- Albert et al. (2006) Albert, J., et al. 2006, Science, 312, 1771
- Albert et al. (2007) Albert, J., et al. 2007, Nucl. Instrum. Methods Phys. Res. A, 583, 494
- Albert et al. (2008a) Albert, J., et al. 2008a, ApJ, 684, 1351
- Albert et al. (2008b) Albert, J., et al. 2008b, Nucl. Instrum. Methods Phys. Res. A, 594, 407
- Albert et al. (2008c) Albert, J., et al. 2008c, ApJ, 674, 1037
- Albert et al. (2008d) Albert, J., et al. 2008d, Nucl. Instrum. Methods Phys. Res. A, 588, 424
- Albert et al. (2009) Albert, J., et al. 2009, ApJ, 693, 303
- Alexander (1997) Alexander, T. 1997, in Astronomical Time Series, ed. D. Maoz, A. Sternberg, & E. M. Leibowitz (Dordrecht, Kluwer) ,163
- Aliu et al. (2008) Aliu, E., et al. 2008, Science, 322, 1221
- Aliu et al. (2009) Aliu, E., et al. 2009, Astropart. Phys., 30, 293
- Aragona et al. (2009) Aragona, C., McSwain, M. V., Grundstrom, E. D., Marsh, A. N., Roettenbacher, R. M., Hessler, K. M., Boyajian, T. S., & Ray, P. S. 2009, ApJ, 698, 514
- Arnaud (1996) Arnaud, K. A. 1996, in ASP Conf. Ser. 101, Astronomical Data Analysis Software and Systems V, ed. G. Jacoby & J. Barnes (San Francisco, CA: ASP), 17
- Bednarek (2006) Bednarek, M. 2006, MNRAS, 368, 579
- Bogovalov et al. (2008) Bogovalov, S. V., Khangulyan, D. V., Koldoba, A. V., Ustyugova, G. V., & Aharonian, F. A. 2008, MNRAS, 387, 63
- Britzger et al. (2009) Britzger, D., et al. (MAGIC Collaboration) 2009, in Proc. 31st International Cosmic Ray Conference, Łódź, in press (arXiv:0907.0973)
- Casares et al. (2005) Casares, J., Ribas, I., Paredes, J. M., Martí, J., & Allende Prieto, C. 2005, MNRAS, 360, 1105
- Dhawan et al. (2006) Dhawan, V., Mioduszewski, A., & Rupen, M. 2006, in Proc. VI Microquasar Workshop: Microquasars and Beyond, ed. T. Belloni (Trieste: PoS), 52
- Dubus (2006a) Dubus, G. 2006a, A&A, 456, 801
- Dubus (2006b) Dubus, G. 2006b, A&A, 451, 9
- Edelson & Krolik (1988) Edelson, R. A., & Krolik, J. H. 1988, ApJ, 333, 646
- Esposito et al. (2007) Esposito, P., Caraveo, P. A., Pellizzoni, A., de Luca, A., Gehrels, N., & Marelli, M. A. 2007, A&A, 474, 575
- Fomin et al. (1994) Fomin, V. P., Stepanian, A. A., Lamb, R. C., Lewis, D. A., Punch, M., & Weekes, T. C. 1994, Astropart. Phys., 2, 137
- Frail & Hjellming (1991) Frail, D. A., & Hjellming, R. M. 1991, AJ, 101, 2126
- Goldoni & Mereghetti (1995) Goldoni, P., & Mereghetti, S. 1995, A&A, 299, 751
- Gregory (2002) Gregory, P. C. 2002, ApJ, 575, 427
- Grundstrom et al. (2007) Grundstrom, E. D., et al. 2007, ApJ, 656, 437
- Harrison et al. (2000) Harrison, F. A., Ray, P. S., Leahy, D. A., Waltman, E. B., & Pooley, G. G. 2000, ApJ, 528, 454
- Hillas (1985) Hillas, A. M. 1985, in Proc. 19th International Cosmic Ray Conference, La Jolla, 3, 445
- Kelner et al. (2006) Kelner, S. R., Aharonian, F. A., & Bugayov, V. V. 2006, Phys. Rev. D, 74, 034018
- Massi et al. (2004) Massi, M., Ribó, M., Paredes, J. M., Garrington, S. T., Peracaula, M., Martí, J. 2004, A&A, 414, L1
- Paredes (2008) Paredes, J. M. 2008, in AIP Conf. Ser. 1085, (Melville, NY: AIP), 157
- Paredes et al. (1997) Paredes, J. M., Martí, J., Peracaula, M., & Ribó, M. 1997, A&A, 320, L25
- Sidoli et al. (2006) Sidoli, L., Pellizzoni, A., Vercellone, S., Moroni, M., Mereghetti, S., & Tavani, M. 2006, A&A, 459, 901
- Sierpowska-Bartosik & Torres (2009) Sierpowska-Bartosik, A., & Torres, D. F. 2009, ApJ, 693, 1462
- Smith et al. (2009) Smith, A., Kaaret, P., Holder, J., Falcone, A., Maier, G., Pandel, D., & Stroh, M. 2009, ApJ, 693, 1621
- Takahashi et al. (2009) Takahashi, T., et al. 2009, ApJ, 697, 535
- Taylor et al. (1996) Taylor, A. R., Young, G., Peracaula, M., Kenny, H. T., & Gregory, P. C. 1996, A&A, 305, 817
- Zamanov et al. (1999) Zamanov, R. K., Martí, J., Paredes, J. M., Fabregat, J., Ribó, M., & Tarasov, A. E. 1999, A&A, 351, 543