Top quark properties measurement with the detector
Abstract
One of the main goals of the Tevatron RunII is to look for any hints for new physics. At D0, the range of searches for new physics signals is large and one of the places we look for hints for new physics is by measuring the top quark properties. A few of these measurements are discussed in this paper.
I Introduction
Tevatron, a collider with center of mass energy of about 2 TeV, is currently world’s highest energy collider in operation. It has been running quite efficiently for the last many years delivering more than integrated luminosity in RunII so far. The D0 detector has also been performing excellently. The motivation to accumulate as much luminosity as possible is not only to find Higgs and do precision measurements but also to look for new physics signals and rule out as many physics models as one can. The top quark is by far the heaviest fermion in the standard model, and thus has the strongest coupling to the Higgs boson of all standard model fermions. This makes the top quark and its interactions an ideal place to look for new physics related to electroweak symmetry breaking. In this paper, we present three analyzes which look for new physics signals in the top quark sector.
II Measurement of CKM matrix element
Within the standard model the top quark decays to a W boson and a down-type quark q (q = d; s; b) with a rate proportional to the squared Cabibbo-Kobayashi- Maskawa (CKM) matrix element CKM . Under the assumption of three fermion families and a unitary CKM matrix, the elements are severely constrained CKM2 . However, in the presence of new physics CKM submatrix may not be a 3X3 unitary matrix and in that case elements can significantly deviate from their standard model values. This would affect, among other things, the ratio R of the top quark branching fractions, which can be expressed in terms of the CKM matrix elements as
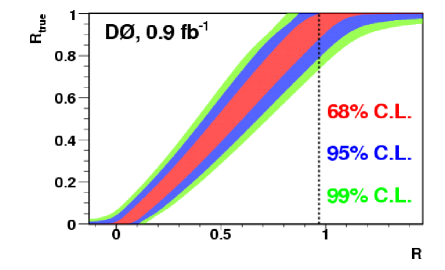
Thus by measuring R precisely we can set limit on the ratio of to the off-diagonal matrix elements without any assumptions on the unitarity of the CKM matrix. The analysis presented here is based on data collected with the D0 detector run2det between August 2002 and December 2005 at the Fermilab Tevatron collider at = 1.96 TeV, corresponding to an integrated luminosity of about . The analysis uses the top quark pair production. Within standard model top quarks decay to a boson and a quark almost 100% of the time. For this analysis we only consider events in which one of the bosons decays into two quarks, and the other one into an electron or muon and a neutrino.
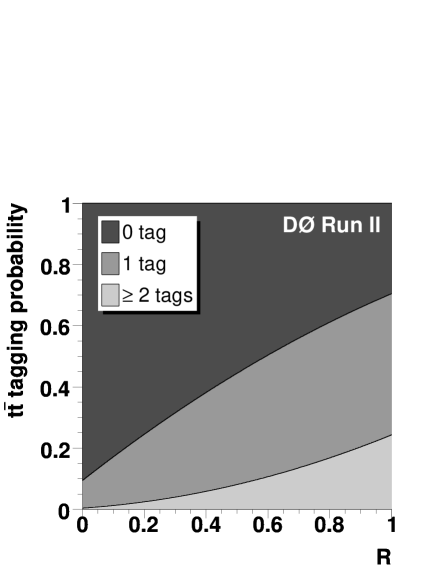
We identify -jets using a neural-network tagging algorithm. We split the selected sample into subsamples according to the lepton flavor ( or ), jet multiplicity (3 or jets) and number of identified -jets (0, 1 or ), thus obtaining 12 disjoint data sets. Since the probability to tag a event depends on the flavor of the jets, it depends on . We estimate the acceptance and tagging probabilities for each of the three decay modes , and . Figure 1 shows tagging probabilities as a function of for events with jets and 0, 1 and tags.
III Anomalous couplings
Anomalous couplings modify the angular correlations of the top quark decay products and change the single top quark production cross section. In this paper we also present the first study of couplings that combines helicity measurements in top quark decay with anomalous coupling searches in the single top quark final state.
The effective Lagrangian describing the interaction including operators up to dimension five is:
| (1) | |||||
where is the mass of the boson, is its four-momentum, is the Cabibbo-Kobayashi-Maskawa matrix element, and () is the left-handed (right-handed) projection operator. In the standard model, the coupling is purely left-handed, and the values of the coupling form factors are , . For this analysis we assume real coupling form factors, implying conservation, and a spin- top quark which decays predominantly to .
We investigate one pair of coupling form factors at a time and consider three cases, pairing the left-handed vector coupling form factor with each of the other three form factors. We refer to these as , , and . For each pair under investigation we assume that the other two have the standard model values.
In this analysis we combine information from our measurement of the boson helicity fractions in events Whel-d0 with information from single top quark production. We have set direct limits on anomalous top quark coupling before Wtb-prl but those limits are based on single top quark final states only. This new measurement is based on a sample of 0.9 fb -1 of single top candidate events and up to 2.7 fb -1 of candidates collected by the D0 detector.
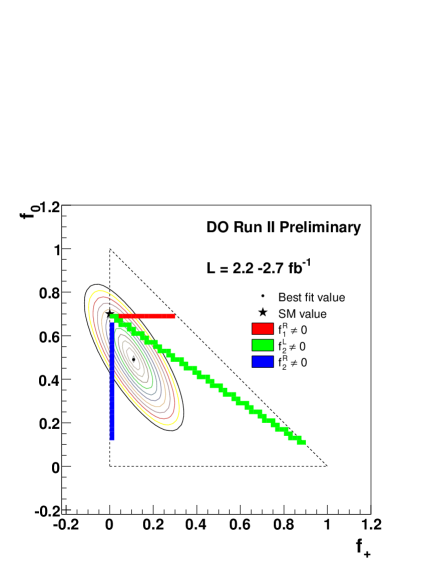
The W boson helicity measurement, described in Ref. Whel-d0 , uses events in both the +jets and dilepton final states, and is extracted form the distribution of , the angle between the down-type fermion and top quark momenta in the W boson rest frame. For each pair of form factors a likelihood distribution is extracted from the W helicity measurement of the decay angle distribution in top quark decays. We vary both the longitudinal and right-handed helicity fractions f0 and f+ in the fit and find the relative likelihood of any set of helicity fractions being consistent with the data. The result is presented in Fig. 3, which also demonstrates how non-SM values for the coupling form factors alter the W helicity fractions.
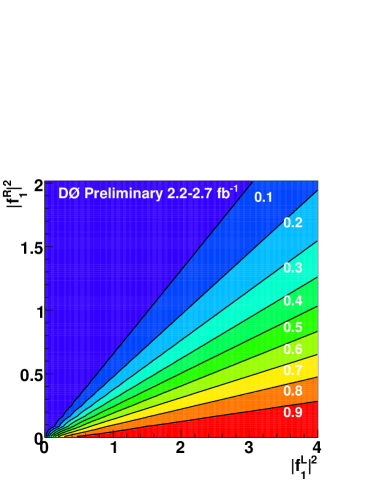
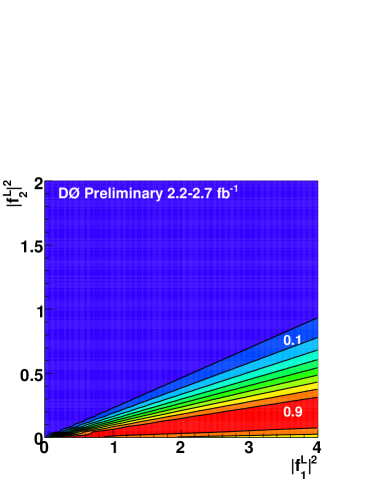
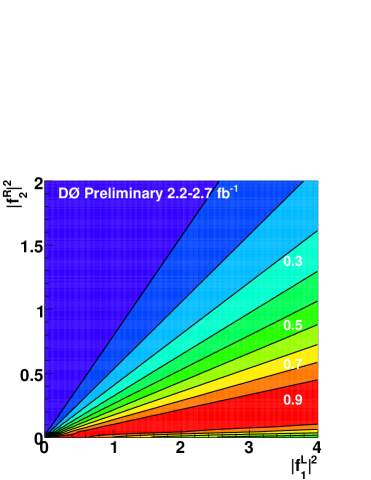
This likelihood from the W helicity analysis is then used as a prior in a Bayesian statistical analysis for the anomalous coupling search in single top quark production and decay channels, yielding a two dimensional posterior probability density as a function of both form factors. We extract limits on , , and by projecting the two-dimensional posterior onto the corresponding form factor axis. The W boson helicity measurement is described in Ref. Whel-d0 and the helecity priors are shown in Fig. 4.
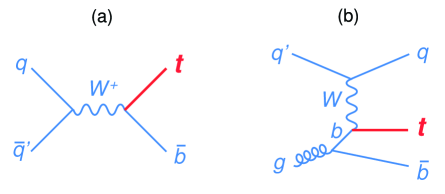
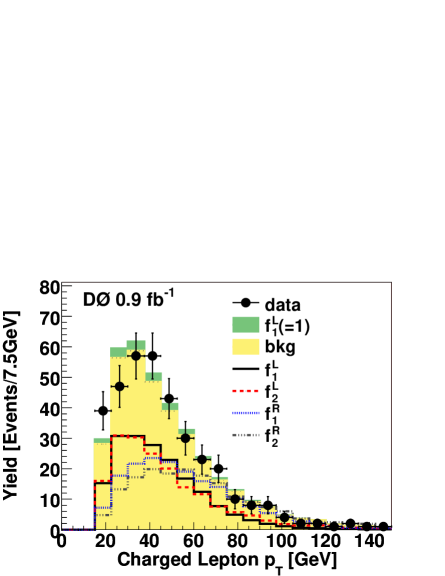
The dominant tree level Feynman diagrams for single top quark production in collisions are illustrated in Fig. 5. In this analysis we combine both these production modes and assume that single top quark production proceeds exclusively through boson exchange. The presence of anomalous couplings can change angular distributions and event kinematics as demonstrated by the spectrum of the charged lepton from the decay of the top quark in Fig. 6. Such differences can be used to distinguish these couplings. We use boosted decision trees to discriminate between the single top quark signal and background.
We use Bayesian statistics to compare the output distribution of the decision trees from data to expectations for single top quark production. For any pair of values of the two couplings that are considered non-zero, we compute the expected output distribution by superimposing the distributions from the two signal samples with the non-standard coupling and from the background samples in the appropriate proportions. In case of the scenario, the two amplitudes interfere, and we use a superposition of three signal samples, one with left-handed vector couplings, one with the left-handed tensor coupling only set to one, and one with both couplings set to one to take into account the effect of the interference. We then compute a likelihood as a product over all bins and channels. Here we use twelve channels defined by lepton flavor, tag multiplicity, and jet multiplicity (2, 3, or 4).
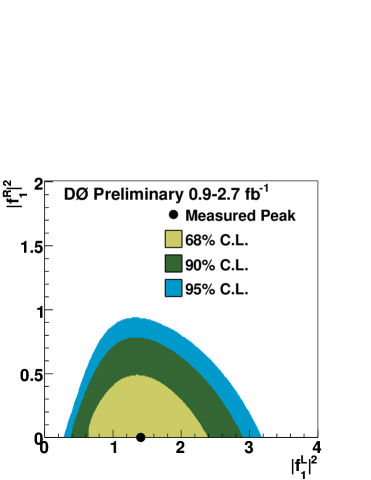
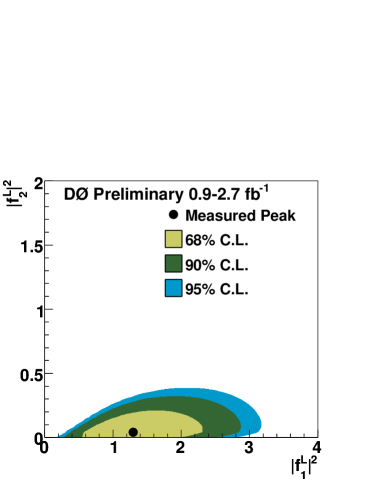
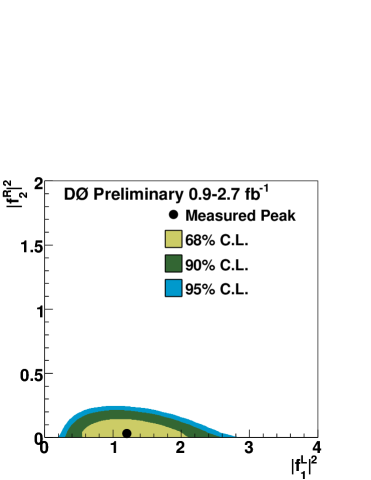
The two-dimensional posterior probability density is computed as a function of and , where is , , or . These probability distributions are shown in Fig. 7. In all three scenarios we measure approximately zero for the anomalous coupling form factors and favor the left-handed vector hypothesis over the alternative hypothesis. We compute 95% Confidence Level (C.L.) upper limits on these form factors by integrating out the left-handed vector coupling form factor to get a one-dimensional posterior probability density. The measured values are given in Table 1.
| Scenario | Coupling | Coupling limit if |
|---|---|---|
| () | ||
| () | ||
| () | ||
IV Top- antitop spin correlations
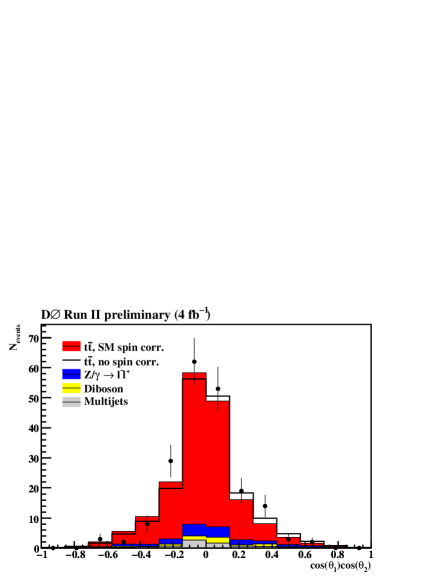
Top quark physics plays an important role in testing the atandard model and its possible extensions. One of the most important properties of the top quark, the spin, has not been carefully explored. While the top quarks and antiquarks produced at hadron colliders are unpolarized, their spins are correlated. Since at the Tevatron top pair production is dominated by scattering, a different spin correlation is analyzed compared to the LHC where top pair production is dominated by scattering. The standard model predicts that the top quark decays before its spin flips, in contrast with the lighter quarks, which are depolarized by QCD interactions long before they fragment. The spin of the top quark is therefore reflected by its decay products. In this analysis it is assumed that top quarks decay exactly as predicted by the standard model. Then the charged lepton from a leptonic top quark decay has a spin analyzing power of 1 at the tree level. Therefore, the dilepton final states have the highest sensitivity to measure the correlation between the spins of pair-produced top and anti-top quarks. The observation of spin correlations would result in an upper limit on the lifetime of the top quark. This can be translated into a lower limit on the Kobayashi-Maskawa matrix element without making assumptions about the number of quark generations. Moreover, many scenarios beyond the standard model predict different production and decay dynamics of the top quark, which could affect the observed spin correlation. In the analysis presented here, the double differential angular distribution is used. The double differential distribution for a measurement of spin correlations between top and and antitop quark can be expressed as:
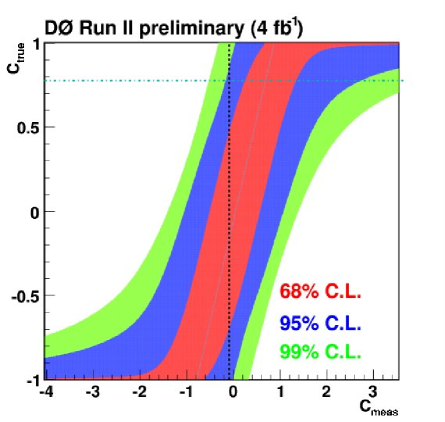
where denotes the cross section of the channel under consideration and is a free parameter between -1 and 1 that depends on the choice of the spin basis. For this analysis the beam axis was chosen to be the spin quantization axis for which the value for the coefficient constant including NLO QCD corrections is . For this measurement, we analyze the dileptonic decay channels where the W bosons from the top and antitop quark decay into an electron and an electron neutrino or into a muon and a muon neutrino. The channel with 1.1 fb -1, the channel with 4.2 fb -1 and the channel with 1.1 fb -1 of integrated luminosity are analyzed separately and are then combined. The distribution for the full sample is shown in Fig. 8. A likelihood fit for data gives a measured value for the spin correlation parameter (stat + syst). The calibrated spin correlation coefficient (stat + syst) has been measured using Feldman-Cousins procedure and is shown shown in Fig. 9. This agrees with the standard model prediction for a spin 1/2 top quark of in NLO QCD within 2 standard deviations.
For analysis details please see Ref. SC .
Acknowledgements.
We thank the staffs at Fermilab and collaborating institutions, and acknowledge support from the DOE and NSF (USA); CEA and CNRS/IN2P3 (France); FASI, Rosatom and RFBR (Russia); CNPq, FAPERJ, FAPESP and FUNDUNESP (Brazil); DAE and DST (India); Colciencias (Colombia); CONACyT (Mexico); KRF and KOSEF (Korea); CONICET and UBACyT (Argentina); FOM (The Netherlands); STFC and the Royal Society (United Kingdom); MSMT and GACR (Czech Republic); CRC Program, CFI, NSERC and WestGrid Project (Canada); BMBF and DFG (Germany); SFI (Ireland); The Swedish Research Council (Sweden); and CAS and CNSF (China).References
- (1) N. Cabbibo, Phys. Rev. Lett. 10, 531 (1961); M. Kobayashi and T. Maskawa, Prog. Theor. Phys. 49, 652 (1973).
- (2) W.-M. Yao et al., Journal of Physics G 33, 1 (2006).
- (3) D0 Collaboration, V. Abazov et al., Nucl. Instrum. and Methods A 565, 463 (2006).
- (4) D0 Collaboration, V. Abazov et al., Phys. Rev. Lett. 100 , 192003 (2008) and refernces therin.
- (5) D0 Collaboration, V.M. Abazov et al. D0 Conference Note 5722-CONF (2008) and refrences therein.
- (6) PRL 102, 092002 (2009) D0 Collaboration, V. M. Abazov et al., PRL 102, 2209, pp.092002, and D0 Conference Note 5838-CONF, and refrences therein.
- (7) D0 Collaboration, V.M. Abazov et al. D0 Conference Note 5950-CONF (2009) and refrences therein.