]http://www.phys.au.dk/ philip/
Electron-phonon coupling in potassium-doped graphene: Angle-resolved photoemission spectroscopy
Abstract
The electron-phonon coupling in potassium-doped graphene on Ir(111) is studied via the renormalization of the band near the Fermi level, using angle-resolved photoemission spectroscopy. The renormalization is found to be fairly weak and almost isotropic, with a mass enhancement parameter of 0.28(6) for both the and the direction. These results are found to agree well with recent first principles calculations.
pacs:
73.22.Pr,79.60.-i,71.38.Cn,73.20.AtMany-body effects in graphene have recently attracted considerable attention, mainly because of graphene’s perceived role as a future electronics material, but also because graphene is highly suited as a fundamental test case for the investigation of many body effects Bostwick et al. (2009); Bostwick et al. (2007a, b); McChesney et al. (2007, 2008); Basko and Aleiner (2008); Lazzeri et al. (2008); Park et al. (2008, 2009). In particular, the structural and electronic simplicity of graphene seems to imply that it is accessible to both first-principles calculations and angle-resolved photoemission (ARPES). Other advantages are that high-quality graphene can be prepared and doped by an electric field or by adsorption.
This paper is concerned with the electron-phonon interaction in electron-doped graphene. Despite the above-mentioned apparent advantages of graphene to study many-body interactions, there has been considerable dispute on the strength of the electron-phonon coupling in both experimental and theoretical studies. From the experimental side, there are several possible causes for this. First of all, experiments have not been performed on free-standing graphene and it is not easy to evaluate the role of the substrate. More importantly, determining the electron-phonon self-energy from the dispersion’s renormalization is not simple, after all, since the unrenormalized (bare) dispersion is also influenced by many-body effects at higher energies Bostwick et al. (2007a, b). The usual approach of using a linear bare dispersion fails for graphene Park et al. (2008), a fact which has lead to unrealistic results in early studies McChesney et al. (2007). Temperature-dependent studies, usually a stable alternative to determine the coupling strength in the form of the electron-phonon mass enhancement parameter , are of limited value because of graphene’s exceptionally high Debye temperature. At this point, rather different experimental results for the size of and its variation over the Fermi surface have been reported for graphene and graphite intercalation compounds McChesney et al. (2007, 2008); Valla et al. (2009); Gruneis et al. (2009a).
Theoretical results generally point towards a rather weak coupling but the absolute values of vary greatly between different calculations Calandra and Mauri (2007); Park et al. (2008). Moreover, it has been pointed out that the local density approximation might not be able to predict the electron-phonon coupling correctly Basko and Aleiner (2008); Lazzeri et al. (2008). On the positive side, a very recent calculation of the expected linewidth in ARPES, including both electron-electron and electron-phonon scattering effects gives good agreement with experimental data for doped graphene on SiC, at least in the direction for states near the Fermi energy () Park et al. (2009).
In this paper, we analyze the electron-phonon coupling strength for electron-doped graphene grown on Ir(111). This approach has the potential advantage of starting with a graphene layer which is relatively well decoupled from the substrate and only very weakly doped when clean. We use a stable method to determine despite the unknown bare dispersion. We find a moderate value which varies little over the Fermi surface, a scenario that agrees well with a recent theoretical prediction Park et al. (2008). We compare our results to other works using graphene on SiC as a starting material McChesney et al. (2007); Bostwick et al. (2007a, b) as well as the KC8 and CaC6 intercalation compounds Valla et al. (2009); Gruneis et al. (2009a). In KC8, and probably also in CaC6, the graphene sheets are effectively decoupled because of the increased distance between them after alkali intercalationGruneis et al. (2009b).
Experiments were performed at the SGM3 beamline of the ASTRID synchrotron radiation facility at Århus University Hoffmann et al. (2004). The endstation is equipped with a 150 mm hemispherical electron energy analyzer (Specs). The data were taken with a photon energy of 45 eV, and at a sample temperature of 70 K. The total energy and resolution amounted to 28 meV and 0.01 Å-1, respectively.
The graphene film was prepared on Ir(111) using a standard recipe Pletikosic et al. (2009); Lacovig et al. (2009). The cleanness of the Ir substrate before graphene formation was monitored using the 4 surface core level shift, and the quality of the graphene film was checked by means of Low Energy Electron Diffraction (LEED) and ARPES, which showed the characteristic mini-gaps close to the point Pletikosic et al. (2009). Potassium was evaporated from a commercial getter source (SAES). The data reported here were taken in a situation in which LEED showed a superstructure. This corresponds to the KC8 phase in an alkali metal / graphite intercalation compound. At this doping level, the Dirac point is shifted to a binding energy of 1.29 eV and the electron concentration is cm-2 or, equivalently, the doping level is 0.054 extra electrons per graphene unit cell.
An area of two-dimensional reciprocal space around was sampled and a resulting dispersion and the Fermi contour are shown in Fig. 1 (a) and (b), respectively. Detailed dispersions along the and directions were extracted and shown in Fig. 1(c) and (d), respectively. The dispersion along the direction in (c) is a sum of four parallel, closely spaced slices. Along only a single cut has been used. Averaging over several parallel cuts in this direction gives rise to broadening, as expected because of the sharp corner of the Fermi surface in this direction. The dispersions along and both show a pronounced renormalization of the bands, as evident from the kink in the dispersions around a binding energy of meV. The apparent strength of the kink is greater in the direction than in the direction. Qualitatively, these results are in good agreement with previous findings in similar systems McChesney et al. (2007, 2008); Valla et al. (2009); Gruneis et al. (2009a).
Due to the three-fold symmetry of the Fermi surface, several equivalent cuts can be made. For the following analysis we have focused on the directions with the highest signal to noise ratio and smallest contribution of the underlying Ir surface states. The results from other directions are consistent with the reported findings and have been used to estimate the uncertainty of the obtained coupling strengths.
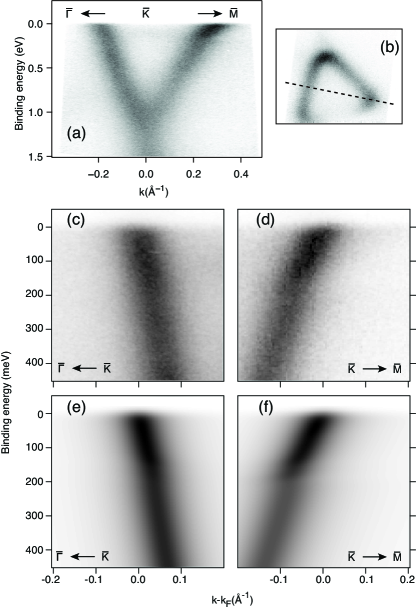
The detailed renormalized dispersions were extracted by fitting Lorentzian lines with a linear background to the momentum distribution curves (MDCs), i.e. to constant energy profiles. The fits were of good quality even though, strictly spoken, MDC cuts through the spectral function can only be described by Lorentzian lines in the case of a linear dispersion. This procedure also gives the energy-dependent full width at half maximum (FWHM) of the MDC peaks.
In the next step of the analysis, the self-energy has to be extracted from the data. is a complex quantity and its real and imaginary parts are related via a Kramers-Kronig transformation. The measured spectral function contains information about both the real part and the imaginary part of the self-energy via the size of the renormalization and the linewidth of the MDCs, respectively Hofmann et al. (in press). Extracting from the MDC width suffers from the problem that the width is usually rather noisy and that, strictly, can only be determined in the case of a linear bare dispersion. Using the renormalized dispersion to extract , on the other hand, requires the knowledge of the bare dispersion. In the present case, both restrictions pose formidable problems but several approaches have been suggested in order to overcome them, such as measuring the dispersion at high temperatures Kirkegaard et al. (2005) or using a self-consistent procedure to extract Kordyuk et al. (2005). We employ a procedure which is similar to the latter approach.
In the first step of this analysis, a model for the measured spectral function is calculated from initial guesses for the bare dispersion and . The bare dispersion is assumed to be a second order polynomial. is calculated from an Eliashberg coupling function , consisting of the contributions of 5 Einstein oscillators with energies that are evenly distributed over the energy range from 21 meV to meV. The oscillators, with energy and a coupling strength value , have a width of 1 meV. From , it is straightforward to calculate (and thus also ) through
| (1) |
where and are Bose and Fermi functions, respectively. Note that the simple, discrete character of the Eliashberg function has only a minor effect on . Indeed, reasonable fits of can sometimes be achieved with even simpler models Valla et al. (2009). Adding further Einstein oscillators in the present case would render them redundant in view of the experimental energy resolution.
We add an offset to in order to account for energy-independent defect scattering. As we are only concerned with a small energy window close to , we ignore the effect of electron-electron scattering altogether. The model thus contains 9 variable parameters: 3 governing the bare-particle dispersion, 5 values of and one offset for . Using these, the spectral function can be calculated from the bare dispersion and . The result is multiplied with a Fermi function and convoluted with the experimental energy and resolution functions.
In a second step, the MDC position and width are extracted from this simulated spectral function in the same way as from the experiment. The MDC peak positions and widths of experiment and simulation are compared using a combined for position and width. The model parameters are then optimized using a steepest-descent algorithm.
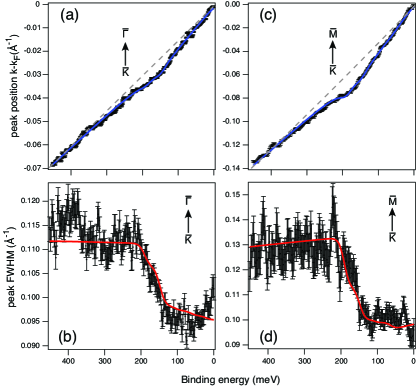
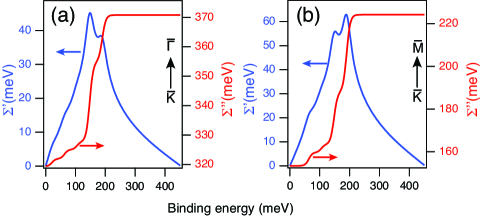
The results of this fitting procedure are given in Fig. 2 and 3. Fig. 2 shows the agreement between data and simulation as well as the bare dispersion obtained from the fit. Fig. 3 gives the resulting . The level of agreement in Fig. 2 is clearly satisfactory given the simplicity of the model. The self-energy obtained from the procedure reveals the expected contributions caused primarily by the high energy optical phonon modes and, less strongly, lower-lying modes, consistent with the literature McChesney et al. (2007, 2008); Valla et al. (2009); Gruneis et al. (2009a). The mass enhancement parameter can now be calculated as the first reciprocal moment of . We find the same value of 0.28(6) for the and directions.
It is quite remarkable that the obtained values are so similar for the two directions despite of the apparently stronger renormalization along . The reason is the downward curvature of the band in this direction as it approaches the van Hove singularity, as noted earlier Park et al. (2008). This curvature also leads to counter-intuitive slight increase of the linewidth upon approaching the Fermi level, best observed between 450 and 200 meV in Fig. 2(d) and also reported for similar compounds Valla et al. (2009). An energy dependence of the linewidth in regions with a rapidly changing density of states is, of course, expected and has been found for other systems Gayone et al. (2003). The similarity of the values can already be guessed from inspecting alone. The absolute value of the two curves in Fig. 3 is different but the increase in due to electron-phonon coupling is very similar. Note that there is no a priori reason to assume anisotropic values. If the coupling to very low-energy acoustic phonons (i.e., with vectors significantly shorter than the size of the Fermi contour) were relevant, one could expect shorter lifetimes around the direction, as more states with similar energy are close by. But as coupling to high energy optical phonons is obviously dominant and intervalley scattering is thought to be important for electron-doped graphene Valla et al. (2009); Gruneis et al. (2009a), this simple argument does not hold.
We note that the outlined approach for determining and has several advantages over other methods. First of all, it does not rely on any knowledge of the bare dispersion, as long as it is locally parabolic. In the case of graphene, this is crucial, because the strong non-linearity in the bare dispersion close to the van Hove singularity does not only upset a simple determination of , it also makes it impossible to relate the MDC linewidth to through the usual relation that , where is the group velocity of the state and FWHM the MDC full width at half-maximum. As mentioned before, this effect is most pronounced along .
The data analysis approach also has the advantage of built-in consistency between and at the expense of assuming particle-hole symmetry for the transformation from to . Also, it permits sufficient variation of , while describing the system with a manageable number of parameters. Indeed, the idea of using an Eliashberg function constructed with a small number of Einstein oscillators is simple and stable and one might wonder why it works so well. The reason is that one does not fit the actual Eliashberg function but , or rather the observed dispersion, which contains only a temperature-broadened integral over the . Details in the latter become insignificant but the determination of the coupling strength is stable. Finally, the procedure includes the band distortion caused by the finite resolution of the spectrometer. In particularly the energy resolution is well-known to distort the dispersion close to , leading to an error in the band slope Kirkegaard et al. (2005). For the determination of this is obviously very significant because for , is equal to the slope of at .
We compare our results to values obtained for graphene and graphite with similar electron doping. For KC8 it has been recently shown that the very intercalation of K atoms also leads to an effective reduction of the system’s dimensions from three to two, caused by the larger distance between the graphene sheets, such that a direct comparison to graphene is possible Gruneis et al. (2009a).
The analysis of the electron-phonon coupling for electron-doped graphene grown epitaxially on SiC has given rather similar values as reported here McChesney et al. (2007); Bostwick et al. (2007a, b). An early study had reported a rather large anisotropy, especially at even higher doping levels, which was most probably caused by the unrealistic assumption of a linear bare dispersion Park et al. (2008). On KC8, on the other hand, was found to be rather anisotropic and also stronger than here Gruneis et al. (2009a). The reason for this is unclear and could lie in the different approach to data analysis or in the fact that having K atoms in between graphene sheets leads to markedly different phonon dispersion, even though the electronic properties of the individual graphene sheets are similar to free graphene. Our results agree well with a recent first principles calculations of the electron-phonon coupling in electron-doped graphene Park et al. (2008, 2009) which predicts an almost isotropic electron-phonon coupling of similar strength.
Finally we compare the absolute MDC linewidth close to the Fermi level to that in similar systems in order to assess the role of defect scattering in this system. The linewidth found here is roughly 0.095 Å-1 which is quite similar to data from KC8Gruneis et al. (2009a) but significantly broader than for alkali-doped graphene on SiC Bostwick et al. (2007a). It has to be noted, however, that the graphene/SiC data in Ref. Bostwick et al. (2007a) have been taken at lower doping levels and MDCs taken for the highest coverages suggest that there is an increase of linewidth in this regime. A plausible explanation for an increased linewidth for graphene on Ir(111) is the fact that the resulting superstructure is incommensurate N’Diaye et al. (2008), implying a loss of translational symmetry for the combined system and a presumably increased scattering rate, even if the coupling between substrate and graphene is small. We also note that the adsorption of alkali metals on graphene/SiC and graphene/Ir(111) appears to be different. On SiC it is possible to continuously vary the doping level whereas this cannot be done for Ir(111). Here the potassium adsorbates assemble in islands with periodicity and at lower coverages two bands are observed, one similar to the doped case reported here and one similar to clean graphene on Ir(111) Bianchi and et al. . Finally, it is questionable if a comparison of the coupling strengths and linewidths for different doping levels is at all meaningful. Valla et al. have evoked a dynamical intervalley nesting effect to explain the observed coupling on CaC6 and this effect implies a strong doping dependence of the coupling Valla et al. (2009).
In conclusion, we have determined the electron-phonon coupling strength for a layer of alkali-doped graphene on Ir(111) in the and directions. We find an almost isotropic scattering strength consistent with recent first-principles calculations. The approach used here takes the non-linearity of the bare dispersion and the finite experimental resolution into account and uses a simple model for the Eliashberg function which allows a stable, reliable and self-consistent analysis of the measured spectral function.
We thank Marko Kralj for stimulating disussions. This work has been supported by Lundbeck foundation, the Danish National Research Council and the University of Trieste. MB acknowledges financial support from the University of Trieste within the program of Student International Mobility 2007/2008.
References
- Bostwick et al. (2007a) A. Bostwick et al., Nature Physics 3, 36 (2007a).
- Bostwick et al. (2007b) A. Bostwick et al., Solid State Communications 143, 63 (2007b).
- Park et al. (2008) C.-H. Park et al., Phys. Rev. B 77, 113410 (2008).
- McChesney et al. (2007) J. L. McChesney et al., arXiv:0705.3264v1 (2007).
- McChesney et al. (2008) J. L. McChesney et al., arXiv:0809.4046v1 (2008).
- Park et al. (2009) C.-H. Park et al., Phys. Rev. Lett. 102, 076803 (2009).
- Bostwick et al. (2009) A. Bostwick et al., Phys. Rev. Lett. 103, 056404 (2009).
- Basko and Aleiner (2008) D. M. Basko and I. L. Aleiner, Phys. Rev. B 77, 041409 (2008).
- Lazzeri et al. (2008) M. Lazzeri et al., Phys. Rev. B 78, 081406 (2008).
- Valla et al. (2009) T. Valla et al., Phys. Rev. Lett. 102, 107007 (2009).
- Gruneis et al. (2009a) A. Gruneis et al., Phys. Rev. B 79, 205106 (2009a).
- Calandra and Mauri (2007) M. Calandra and F. Mauri, Phys. Rev. B 76, 205411 (2007).
- Gruneis et al. (2009b) A. Gruneis et al., Phys. Rev. B 80, 075431 (2009b).
- Hoffmann et al. (2004) S. V. Hoffmann et al., Nuclear Inst. and Methods in Physics Research, A 523, 441 (2004).
- Pletikosic et al. (2009) I. Pletikosic et al., Phys. Rev. Lett. 102, 056808 (2009).
- Lacovig et al. (2009) P. Lacovig et al., Phys. Rev. Lett. 103, 166101 (2009).
- Hofmann et al. (in press) Ph. Hofmann et al., New Journal of Physics 11, 125005 (2009).
- Kirkegaard et al. (2005) C. Kirkegaard, T. K. Kim, and P. Hofmann, New Journal of Physics 7, 99 (2005).
- Kordyuk et al. (2005) A. A. Kordyuk et al., Phys. Rev. B 71, 214513 (2005).
- Gayone et al. (2003) J. E. Gayone et al., Phys. Rev. Lett. 91, 127601 (2003).
- N’Diaye et al. (2008) A. T. N’Diaye et al., New Journal of Physics 10, 043033 (2008).
- (22) M. Bianchi et al., to be published.