ACCESS: NIR Luminosity Function and Stellar Mass Function of Galaxies in the Shapley Supercluster Environment111Based on observations collected at UKIRT with the WFCAM
Abstract
We present the near-infrared luminosity and stellar mass functions of galaxies in the core of the Shapley supercluster at =0.048, based on new -band observations carried out at the United Kingdom Infra-Red Telescope with the Wide Field Infrared Camera in conjunction with - and -band photometry from the Shapley Optical Survey, and including a subsample (650 galaxies) of spectroscopically confirmed supercluster members. These data sets allow us to investigate the supercluster galaxy population down to M+6 and =108.75M⊙. For the overall 3 deg2 field the -band luminosity function (LF) is described by a Schechter function with M=–24.960.10 and =–1.420.03, a significantly steeper faint-end slope than that observed in field regions. We investigate the effect of environment by deriving the LF in three regions selected according to the local galaxy density, and observe a significant () increase in the faint-end slope going from the high- (=–1.33) to the low-density (=–1.49) environments, while a faint-end upturn at M–21 becomes increasingly apparent in the lower density regions. The galaxy stellar mass function (SMF) is fitted well by a Schechter function with log10()=11.160.04 and =–1.20. The SMF of supercluster galaxies is also characterised by an excess of massive galaxies that are associated to the brightest cluster galaxies. While the value of depends on environment increasing by 0.2 dex from low- to high-density regions, the slope of the galaxy SMF does not vary with the environment. By comparing our findings with cosmological simulations, we conclude that the environmental dependences of the LF are not primary due to variations in the merging histories, but to processes which are not treated in the semi-analytical models, such as tidal stripping or harassment. In field regions the SMF shows a sharp upturn below =109M⊙, close to our mass limit, suggesting that the upturns seen in our -band LFs, but not in the SMF, are due to this dwarf population. The environmental variations seen in the faint-end of the -band LF suggests that these dwarf galaxies, which are easier to strip than their more massive counterparts, are affected by tidal/gas stripping upon entering the supercluster environment.
keywords:
Galaxies: clusters: general — Galaxies: clusters: individual: Shapley supercluster — Galaxies: photometry — Galaxies: luminosity function, mass function — Galaxies: stellar content.1 Introduction
The properties and evolution of galaxies are strongly related to their environment (e.g. Blanton et al. 2005a; Rines et al. 2005; Baldry et al. 2006), through the mass and merging histories of their host dark matter halos, and the impact of different physical mechanisms (e.g. Treu et al. 2003) that are linked in various ways to the local galaxy density and the properties of the intergalactic medium. In the local Universe this environmental dependence has been investigated and observed in the distribution of galaxy luminosities and stellar masses, providing constraints on the assembly of galaxies over cosmic time (see below).
Since the NIR light is dominated by established old stellar populations rather than by recent star-formation activity, the NIR LF can be considered as reliable estimator of the stellar mass function (SMF, Gavazzi et al. 1996; Bell & de Jong 2001) and the shape of the NIR LF constrains the scenarios of galaxy formation (e.g. Benson et al. 2003), with different energetic feedback processes from supernovae and AGN required to simultaneously fit the LFs at the faint and bright ends respectively (Bower et al., 2006). Early versions of the hierarchical galaxy formation model predicted a decrease of the abundance of massive galaxies with redshift (Kauffmann & Charlot 1998) which have continued forming until recent times through processes of merging and accretion, and a steep mass function due to the presence of a large number of faint dwarf galaxies witnessing the small dark halo formation in the early universe (e.g. Kauffmann et al. 1993).
The NIR LFs observed at different redshifts turn out to be well described by Schechter functions, although there is some evidence for an excess of bright galaxies with respect to the best fitting Schechter function (e.g. Jones et al. 2006), while a faint-end upturn has also been observed in some cases (e.g. De Propris & Pritchet 1998; Balogh et al. 2001; Jenkins et al. 2007). The results supporting the hierarchical scenario (e.g. Kauffmann & Charlot 1998) are contrasted by other works that bring it into question (Kodama & Bower 2003; De Propris et al. 1999; 2007) or cannot interpret univocally their findings (e.g. Drory et al. 2003). For instance, there is a consensus that the evolution of the characteristic absolute luminosity M⋆ for both field and cluster galaxies can be described by a passively evolving population formed in a single burst at redshift =1.5-2 (e.g. Lin et al. 2006; Wake et al. 2006; De Propris et al. 1999; 2007). On the other hand, Drory et al. (2003) attribute the observed evolution in the -band LF of cluster galaxies, either to a change in the mass-to-light ratio alone (i.e. passive evolution), or to a combination of changes in M/L and stellar mass which could be due to star formation and/or to merging or accretion. Recent semi-analytic models incorporating AGN feedback have been able to reproduce well the evolution of the SMF over (Bower et al. 2006), predicting the observed population of massive galaxies at . However, in order to properly use the NIR, LF to disentangle between possible scenarios of galaxy evolution, one has to consider the dependence of the LF on environment, galaxy colour, spectral type and morphology.
The LF of field galaxies at NIR wavebands has been primarily investigated through the Two Micron All Sky Survey222http://www.ipac.caltech.edu/2mass/ (2MASS) often complemented by either optical photometry from the Sloan Digital Sky Survey333http://www.sdss.org/ (SDSS) or wide-field spectroscopic surveys such as the 2dF Galaxy Redshift Survey444http://www.mso.anu.edu.au/2dFGRS/ (2dFGRS). These works (e.g. Kochanek et al. 2001; Cole et al. 2001) agree in describing the NIR LFs with Schechter functions characterised by a rather flat faint-end slope from –0.77 to –0.96 and which are independent of the morphological type (Kochanek et al. 2001), in contrast with that found in optical surveys where the faint-end slope is steeper for late-type galaxies. On the contrary, Bell et al. (2003) found that NIR LF has a brighter characteristic luminosity and shallower slope for early-type galaxies with respect to the later types. More recently, Jones et al. (2006), using the 6dF Galaxy Redshift Survey555http://www.aao.gov.au/local/www/6df/ (6dFGRS, Jones et al. 2004) derived NIR LFs for field galaxies 1-2 mag deeper in absolute magnitude with respect to the previous works. They found that the Schechter function is not ideal to reproduce the data since it cannot match the bright- and faint-end simultaneously, due to an excess of galaxies at magnitudes brighter than M⋆.
Balogh et al. (2001) investigated the dependence of the infrared galaxy luminosity function and the associated galaxy SMF on environment and spectral type by means of 2MASS and Las Campanas Redshift Survey (LCRS, Shectman et al. 1996) for galaxies brighter that MJ=–19 mag. In field environments the LF of galaxies with emission lines turns out to have a much steeper faint-end slope (=–1.39) compared to that of galaxies without emission lines (=–0.59). On the other hand, in the cluster environment, even the non-emission line galaxies have a steep faint-end LF (=–1.22). This difference is almost entirely due to the non-emission line galaxies which dominate the cluster population, and present a slope close to that of the overall field. Thus, they suggested that the cluster population is built up by accreting field galaxies with little effect other than the cessation of star formation. Differences in the shape of the LF for late- and early-type cluster galaxies has been found by Huang et al. (2003): the late-type galaxies having a systematically fainter M* and steeper faint-end slope. A possible faint-end upturn in the -band LF was already suggested by De Propris et al. (1998, see also Andreon & Pelló 2000) for the Coma cluster outlining the steep trend of dwarf galaxies down to M*+5, even if they did not provide a precise estimate of the faint-end slope because of possible field contaminations. An increase of the faint-end slope of Coma was recently observed at 3.6 m by Jenkins et al. (2007) indicating a large number of faint red galaxies. However, Rines & Geller (2008) found no such upturn for Virgo, based on a fully spectroscopically confirmed sample, and suggested that many of the photometrically-selected red sequence galaxies which contribute to the upturns seen in other clusters are background galaxies.
Finally, the tight correlation between the total galaxy NIR luminosity and the cluster binding mass (Lin et al. 2003, 2004; Ramella et al. 2004) allows to probe that the global cluster -band mass-to-light ratio decreases with cluster radius (Rines et al. 2004) showing that the environment affects the shape of the LF also within the clusters.
We note that most of the previous works are based on the 2MASS data which has a detection sensitivity (10) of =13.1 mag for extended sources (Cole et al. 2001, =13.57 mag according to Bell et al. 2003), limiting studies of the environmental impact on the NIR LF to only a sample of local clusters (e.g. Virgo), or limiting to magnitudes M⋆+2 (e.g. Rines et al. 2004). However, the dominant processes that quench star-formation, and therefore transform galaxies, depend crucially on the galaxy mass (e.g. Haines et al. 2006a; 2007), and the strong bimodality in the properties of galaxies about a characteristic stellar mass of ( M*+1, Kauffmann et al. 2003) implies fundamental differences in the formation and evolution of giant and dwarf galaxies (e.g. Dekel & Birnboim 2006; Kereŝ et al. 2005). This issue needs data-sets reaching much fainter luminosities than those of 2MASS to be investigated in order to obtain, in general, an overall picture of galaxy evolution and, in particular, to establish the contribution of the dwarf galaxy population to the total stellar mass in the local universe and the physical origin of the claimed faint-end upturn. The recent development of wide-field NIR imagers on 4-m class telescopes such as UKIRT/WFCAM and KPNO/NEWFIRM has opened the possibility of NIR surveys to be more sensitive covering many square degrees (e.g. UKIDSS), allowing the -band LF of nearby clusters to be obtained covering not only the cluster cores, but the entire virialized regions.
In this context we study the -band LF of the Shapley supercluster core (SSC) down to the dwarf regime (reaching M⋆+6) with the aim of i) quantifying the environmental impact on the shape of the NIR LF; ii) deriving the stellar masses of the supercluster galaxies; iii) investigating the mechanisms driving galaxy evolution as function of galaxy mass. This work is carried out in the framework of the joint research programme ACCESS aimed at determining the importance of cluster assembly processes in driving the evolution of galaxies as a function of galaxy mass and environment within the Shapley supercluster (see Sect. 2). In Sect. 3, we describe the data-sets. In Sect. 4, we derive the NIR galaxy luminosity functions obtained through background subtraction in the whole observed field and we study the ongoing effects of environment by comparing the LFs of galaxies in three different regions of the supercluster, characterized by high-, intermediate- and low-density, we also compare NIR and optical LFs. The galaxy stellar mass function is presented in Sect. 5. The results are discussed in Sect. 6 and the summary and conclusions of this work is given in Sect. 7.
Throughout the paper we adopt a cosmology with =0.3, = 0.7, and H0=70 km s-1Mpc-1. According to this cosmology 1 arcmin corresponds to 60 kpc at =0.048 and the distance modulus is 36.66.
2 The ACCESS project
ACCESS666http://www.oacn.inaf.it/ACCESS (A Complete Census of Star-formation and nuclear activity in the Shapley supercluster, PI: P. Merluzzi) is a project whose aim is to distinguish among the mechanisms which drive galaxy evolution across different ranges of mass examining how, when and where the properties of galaxies are transformed by their interaction with the environment. Since the most dramatic effects of environment on galaxy evolution should occur in superclusters, where the infall and encounter velocities of galaxies are greatest (1000 km s-1), groups and clusters are still merging, and significant numbers of galaxies will be encountering the dense intra-cluster medium (ICM) of the cluster environment for the first time, we choose to study the core region of the Shapley supercluster (Shapley 1930). The Shapley supercluster core is the richest and most dynamically active region in the local Universe and hence represents a unique laboratory for studying the effects of the hierarchical assembly of structures on galaxy evolution.
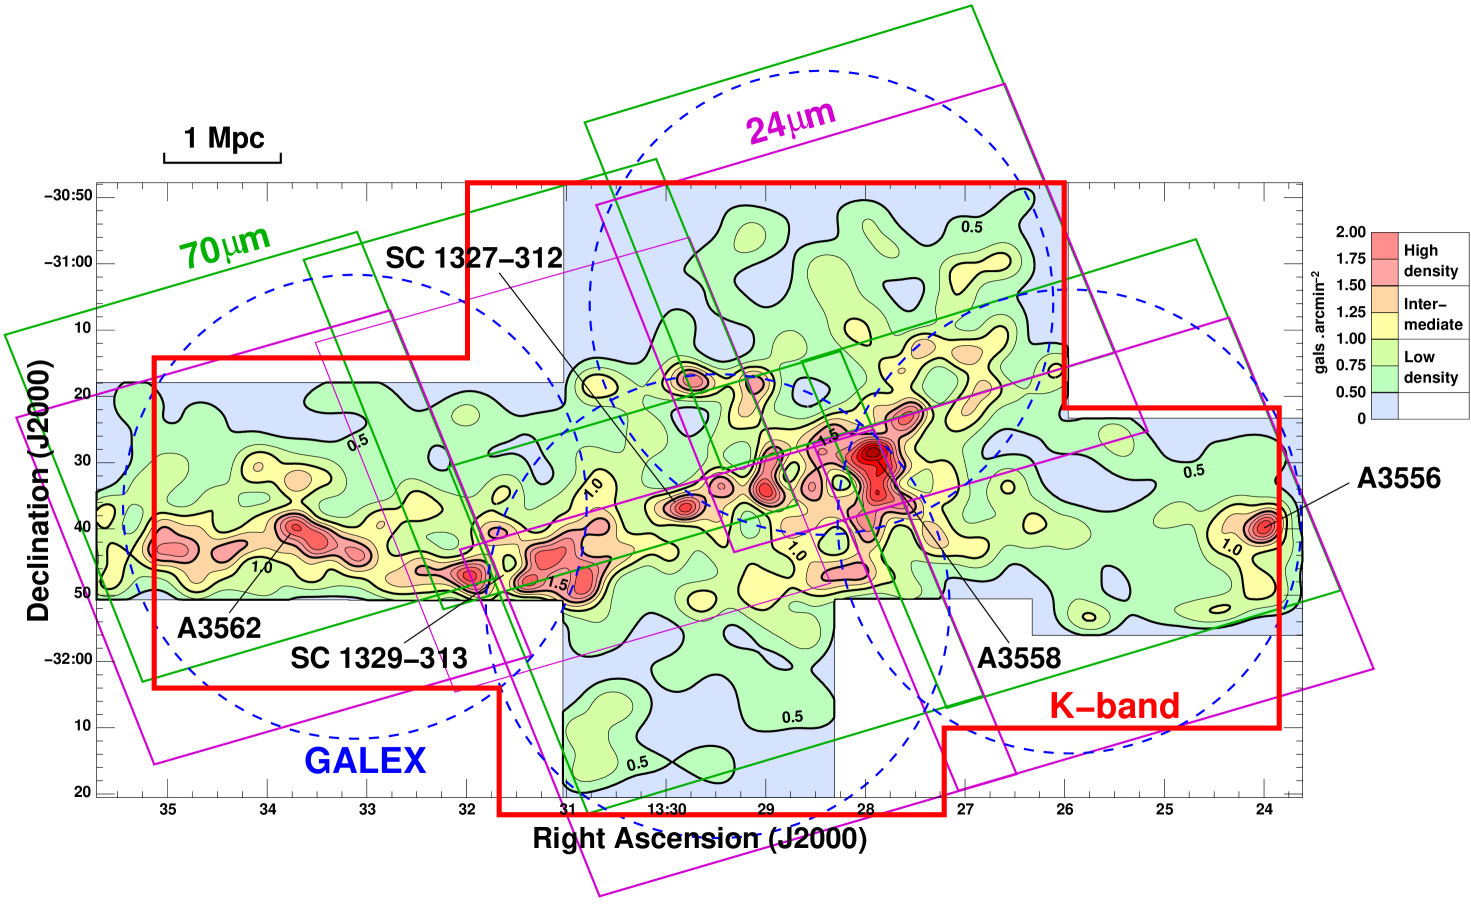
The multi-wavelength data-set available for this project includes panoramic imaging in UV [Galaxy Evolution Explorer (GALEX); PI: R.J. Smith], optical [European Southern Observatory (ESO) WideField Imager (WFI) archive data], near-infrared (UKIRT/WFCAM, PI: R.J. Smith), mid-infrared (Spitzer, PI: C.P. Haines) all of which cover at least a 2 deg2 area of the SSC (see Fig. 1). Furthermore, high-S/N medium-resolution optical spectroscopy (AAOmega, PI: R.J. Smith) was obtained for a sample of 541 galaxies in the SSC field (Smith, Lucey & Hudson 2007; 2009), of which 448 are supercluster members (). For this sample 371 galaxies have , and photometry. The spectroscopic sample is enlarged to 650 galaxies with published data, NASA Extragalactic Database for bright objects, and 6dF data. New medium-resolution integral-field spectroscopy will be provided by the Wide Field Spectrograph (WiFeS, Dopita et al. 2007) at the Australian National University 2.3 m telescope. A large programme of WiFeS observations (PI: M. Dopita & P. Merluzzi) started in April 2009. Finally, archive X-ray and radio data are also available. The depth (e.g. =22.5 mag, =22 mag, =18 mag) and high-S/N of the data allows the investigation of the photometric and spectroscopic properties of supercluster galaxies well into the dwarf regime (e.g. Mercurio et al. 2006; Gargiulo et al. 2009).
The main scientific goals of ACCESS are: searching for the ram pressure effects; probing galaxy merging and galaxy harassment and “suffocation”; determining the frequency and the radial distribution of cluster AGN; obtaining a statistical census of obscured star-formation in cluster galaxies; correlate obscured star formation with hierarchical cluster assembly; compare mid-IR, optical, radio and UV star-formation indicators; investigating the fundamental plane of low mass early-type galaxies. Partners of this collaboration are the Universities of Durham and Birmingham (UK), the Italian National Institute of Astrophysics with the Observatory of Capodimonte and the Australian National University (FP7-PEOPLE-IRSES-2008, Grant agreement No. 230634).
3 The data
The new near-infrared data analysed in this paper are complemented by panoramic - and -band imaging from the Shapley Optical Survey (SOS, Mercurio et al. 2006 and Haines et al. 2006b, hereafter MMH06 and HMM06, respectively). In Fig. 1 the optical and NIR survey are superimposed. In the following we describe the two surveys and their data products.
3.1 The Shapley Optical Survey
The SOS comprises wide-field - and -band imaging covering a 2.0 deg2 region towards the clusters A3562, A3558 and A3556 which form the core of the Shapley supercluster at z 0.05.
The observations were carried out with the Wide Field Imager (WFI) camera, a mosaic of eight 2046 4098 pixels CCDs giving a field of view of 34′ 33′, and mounted on the Cassegrain focus of the 2.2m MPG/ESO telescope at La Silla. The survey is made up of eight contiguous fields, each with total exposure times of 1500 s in band and 1200 s in band, and typical FWHMs of 0.7-1.0 arcsec. The data were retrieved from the ESO archive and reduced using the ALAMBIC pipeline (version 1.0, Vandame 2004) and calibrated to the Johnson-Kron-Cousins photometric system using observations of Landolt (1992) standard stars. The sources are then extracted and classified using SExtractor (Bertin & Arnouts 1996), resulting in galaxy catalogues which are both complete and reliable (i.e. free of stars) to =22.0 mag and =22.5 mag. Full description of the observations, data reduction, and the production of the galaxy catalogues are described in MMH06.
3.2 The -band survey
The -band survey of the Shapley supercluster core was carried out at the United Kingdom Infra-Red Telescope (UKIRT) with the Wide Field Infrared Camera (WFCAM) in April 2007. The WFCAM instrument consists of four 2048 2048 Rockwell detectors with a pixel scale of 0.4 arcsec. The four detectors are spaced by 94% of their active area. A single exposure covers an equivalent area of 0.19 deg2 and four interleaved exposures are required to achieve a filled tile of 0.865 deg on a side (0.78 deg2). We observed a mosaic of five complete tiles, covering a 3.043 deg2 (of which 2 deg2 overlap with the SOS) region centred on the SSC, which comprises three Abell clusters A3556, A3558 and A3562 and two poor clusters SC 1327-312 and SC 1329-314, as shown in Fig. 1. The total exposure time for each field is 300 s, reaching =19.5 mag at 5, with typical FWHMs of 0.9-1.2 arcsec.
The data were pipeline processed at WFCAM Science Archive (WSA)/Cambridge Astronomy Survey Unit (CASU), reducing the frames and performing astrometric and photometric calibration with respect to 2MASS (Irwin et al. 2004). Zero-point uncertainty is 0.015 mag and astrometry accuracy is 0.1 arcsec (Irwin et al. 2004).
For each frame, a photometric catalogue was derived by using SExtractor (Bertin & Arnouts 1996). We measured magnitudes within a fixed aperture of 17 arcsec diameter, corresponding to 8 kpc at , and Kron (Kron 1980) magnitudes, for which we used an adaptive aperture with diameter , where is the Kron radius and is a constant. We chose = 2.5, yielding 94% of the total source flux within the adaptive aperture (Bertin & Arnouts 1996). We measured the Kron magnitude for all the objects in the catalogue and adopted it as the total magnitude. Luminosity functions were computed by means of Kron magnitudes, while aperture magnitudes were used for measuring galaxy colours. Since we derive galaxy colours using the same apertures both at optical and NIR wavelengths, we checked the effects of seeing variations among the wavebands by degrading the -band image to the seeing of the -band image. Comparing the aperture magnitudes in the original and the degraded image we find a difference which is an order of magnitude lower than the photometric error, as expected since the aperture is large compared to the seeing.
Particular care is needed to avoid stellar contamination due to the high number density of both stars and galaxies in this field (the Galactic latitude of this field is +30∘) which increases the frequency of star-star and star-galaxy blends that can be misclassified as a single galaxy. For the star/galaxy classification we make use of the optical photometry when available in the sense that objects observed in both and bands were classified as stars and galaxies according to the -band classification777The -band WFI mosaic is the deepest and highest resolution data obtained for this project, reaching M⋆+7, and is therefore generally used as reference for our multi-wavelengths surveys.. As shown in Tab. 3 of MMH06, at mag, only 2% of the stars were misclassified as galaxies. According to the typical colour of early-type galaxies at (Poggianti 1997), this magnitude range corresponds to mag. The contamination of misclassified stars is taken into account in the galaxy LF determination. For those objects observed in the -band having no optical magnitude measurement, we use the distribution of sources in the stellarity index (SI) parameter of SExtractor versus Kron magnitude () diagram to separate stars and galaxies. We classified as stars those objects whose SI value is larger than a given threshold: SImin=0.8. This value of SImin has been chosen by adding simulated stars and galaxies to the -band images, and measuring their SI and parameters by means of SExtractor, in the same way as for real sources. Simulated stars and galaxies were randomly generated in a magnitude range of =12-20 mag using the software 2DPHOT (La Barbera et al. 2008).
The completeness of the -band catalogue was estimated by measuring the percentage of simulated galaxies and stars which are recovered by SExtractor as a function of -band magnitude. The completeness function was found to be strongly dependent on the source density and therefore is different for each -band frame. In fact, in high density regions the catalogue is 65% and 50% complete at =17.5 mag and =18.0 mag, respectively, while in low density regions it is 100% and 80% complete at =17.5 mag and =18.0 mag, respectively. We correct galaxy counts using a different completeness function for each -band frame, i.e. by taking both the crowdedness and magnitude effects fully into account for each galaxy, when determining its contribution to the counts in a given magnitude bin. By weighting each galaxy by the locally estimated completeness of the survey, we are able to obtain unbiased comparisons of the galaxy counts in different environments. Since in the high density region the completeness is less than 50% beyond =18.0 mag, we adopted this conservative limit as the magnitude to which catalogues can be reliably corrected for incompleteness when determining the galaxy LF. At this limiting magnitude the accuracy of the completeness functions is better by 5% and is taken into account in the error budget of each galaxies. The final catalogues consist of 18,534 galaxies with 18 mag.
4 NIR Luminosity Functions
The -band galaxy LF of the SSC has been derived down to the magnitude limit =18 mag accounting for interlopers by the statistical subtraction of the background contamination. We chose this approach since we do not have spectroscopic information complete for whole the galaxy sample in the considered magnitude range (being 90% complete for 16 mag or 13.5) and the available photometry (, and band) does not allow us to derive accurate photometric redshifts. The number counts in the supercluster field has been obtained by weighting each galaxy’s contribution to a given magnitude bin according to its completeness. We also correct for the contamination of the misclassified stars. Absolute magnitudes were determined using the k- and evolutionary corrections for early-type galaxies at 0.05 from Poggianti (1997). The large observed area and the depth of the survey are suitable to investigate the effects of environment within the supercluster.
4.1 Background galaxy subtraction
Since the area covered by the SSC observations lies completely within the overdensity corresponding to the core complex, it is not possible to use the outer regions of the survey to estimate the background/foreground contribution to the galaxy counts. Therefore, we performed the statistical subtraction of field galaxies by means of a control field observed with the same instrument at a suitable depth. A similar or larger area is necessary in order to reduce the effects of field-to-field variance and small number statistics.

To this aim we chose the UKIRT Infrared Deep Sky Survey (UKIDSS) Deep Extragalactic Survey (DXS) (Lawrence et al. 2007) which aims to map 35 deg2 of sky to a magnitude limit of =20.8 mag at 5. Since our -band photometry is 50% complete down to =18.0 mag, the UKIDSS DXS data are suitable to estimate field galaxy counts.
The background contamination was estimated from three control fields from the UKIDSS DXS 3rd data release (Warren et al., in preparation) reaching the required depth. In particular, we considered 24 multiframes of 0.19 deg2 , covering a total area of 4.55 deg2 over three regions of sky (Tab. 1), with exposure times of 360 s in . We note that this area is significantly larger than that covered by any published table of galaxy counts reaching or deeper, the surveys of Väisänen et al. (2000) and Kümmel & Wagner (2001) limited to areas of deg2, and reaching just 17-17.5. The -band catalogues were obtained from the WFCAM Science Archive (WSA, Hambly et al. 2008) selecting from the dxsDetection table the isolated (pperrbits1) objects with non-stellar morphologies (class=1).
Since we have accounted statistically for the incompleteness affects in the -band survey (see Sect. 3.2), we can subtract the control field counts from those obtained in the Shapley area in order to obtain supercluster member counts. In this case, following Bernstein et al. (1995) the background counts are estimated as the mean of the control field counts corrected for the ratio between the observed areas (Eq. 1 of Bernstein et al. 1995) and errors on the background counts are estimated through an empirical approach as the rms of the counts in each control field with respect to the mean estimated over the whole area (Eq. 2 of Bernstein et al. 1995). For the background counts, scaling the rms value to the whole area, we obtain an uncertainty on the mean counts of 11% at 13.5 mag where small number statistics dominates, and less than 3% at =18 mag. For a Gaussian distribution, the standard deviation estimated from three samples is within a factor of two from the true value, in 80% of trials. Since each field is smaller than the -band survey, we overestimate the field-to-field variance among larger fields, taking into account that the fluctuations due to galaxy clustering are smaller for wider fields. Following Ellis & Bland-Hawthorn (2007) we estimate that the field-to-field variance is overestimated of about the 15%. Using this method the error on background counts accounts for the Poissonian fluctuations and the field-to-field variance. We also include the error related to the photometric uncertainties which is estimated by means of 100,000 Monte-Carlo simulations, changing the galaxy luminosities according to the photometric error and re-computing the number counts in each magnitude bin.
These galaxy number counts were found to be consistent with field galaxy counts from the Calar Alto Deep Imaging Survey (CADIS, see Huang et al. 2003), a medium deep -band survey with a total area of 0.2 deg2 and a completeness magnitude of 19.75 mag (see Fig. 2). We also agree with the counts of the Advanced Large Homogeneous Area Medium-Band Redshift Astronomical (ALHAMBRA) survey given by Cristóbal-Hornillos et al. (2009) covering a 0.44 deg2 and reaching KS=19.5 mag. We note that Ellis & Bland-Hawthorn (2007) who have combined numerous published galaxy number counts over a wide range of pass-bands and magnitudes, obtain galaxy counts in the range that are 10-15% higher than ours, but are based on small patches of sky ( deg2) and show significant variations from one magnitude bin to another as surveys fall out of the sample.
The counts of SSC galaxies were defined as the difference between the counts detected in the supercluster fields and those estimated for the background (Eq. 3 of Bernstein et al. 1995). Then, the uncertainties were measured as the sum in quadrature of fluctuations in the background and in the supercluster counts (Eq. 4 of Bernstein et al. 1995).
4.2 The total luminosity function
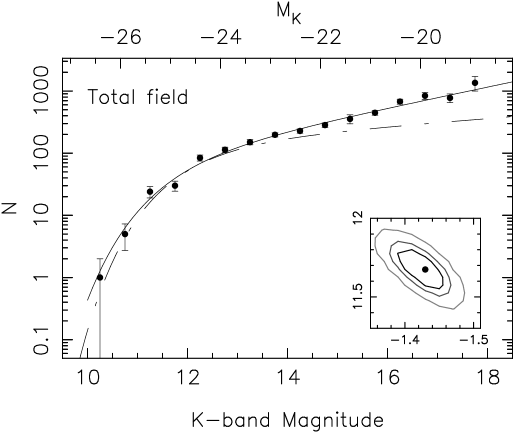
Figure 3 shows the Shapley LF over the whole -band survey covering the SSC (Fig. 1), and the fit with a single Schechter function. The error bars on number counts take into account Poissonian uncertainties, field-to-field variance (see Sect. 4.1), photometric uncertainties and, in the last bin, the percentage of misclassified stars (see Sect. 3.2).
The LF fit was obtained with a minimization routine, accounting for the finite size of magnitude bins by integrating the Schechter function over each magnitude bin. The Schechter function fit, whose parameters are the faint-end slope, , the characteristic magnitude, M∗, and the luminosity density , according to the statistics, provides an acceptable description of cluster galaxy counts. The best-fitting values of the -band Schechter function parameters are and . The confidence contours on and m∗ are shown in the small panel in Fig. 3 and were derived by randomly shifting galaxy number counts according to their uncertainties, and re-computing the best-fitting Schechter function for each realization. The fit parameters and associated statistics are listed in Tab. 2.
The NIR LF trend derived in the 3 deg2 area of the SSC agrees with the results of Mobasher Trentham (1998) who found =–1.41 in the magnitude range –19.5–16.5, although they studied only a 41.1 arcmin2 region of the Coma cluster core corresponding to about 10 arcmin2 at Shapley redshift.
In Fig. 3 we plot for comparison the field -band LF by Jones et al. (2006) who found M and . The two LFs appear consistent down to , but the faint-end slope for the SSC is steeper than that measured in the field at level. The field value of is also not consistent with that obtained for the SSC with a single Schecter function, with being brighter for the SSC than for the field, at the level according to the confidence contours in Fig. 10 of Jones et al. (2006).
4.3 The effect of environment
Balogh et al. (2001), using 2MASS data, were the first to detect environmental variances in the NIR LF. This environmental effect was then questioned by Rines et al. (2004) who found that the cluster LFs derived in the virial regions and in the infall regions are very similar, although both poorly fitted by a Schechter function. However, in their work, which is also based on the 2MASS survey, they noted that at magnitudes fainter than the completeness limit the LF in the infall regions may indicate a steeper faint-end slope which should be investigated by means of deeper data-sets.
In order to investigate the effects of the environment we derived and compared the LFs in three different regions of the supercluster, characterised by high-, intermediate- and low-densities of galaxies (see Fig. 1) where galaxy densities are 1.5, 1.01.5 and 0.51.0 gals arcmin-2, respectively. The local density of mag galaxies, , was determined across the -band WFI mosaic (i.e. in a 2 deg2 area, see Fig. 1). We derive by using an adaptive kernel estimator (Pisani 1993; 1996), in which each galaxy is represented by a Gaussian kernel, , whose width is proportional to thus matching the resolution locally to the density (see MMH06 for more details).
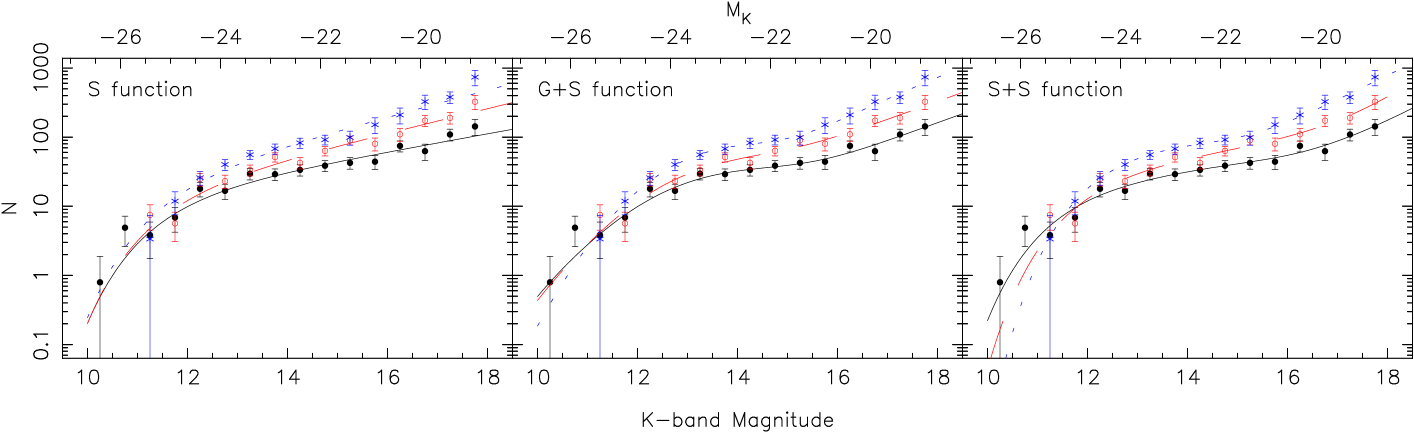
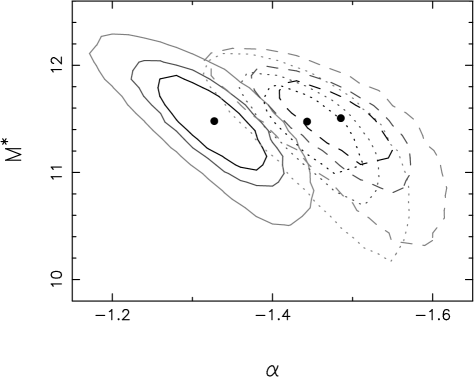
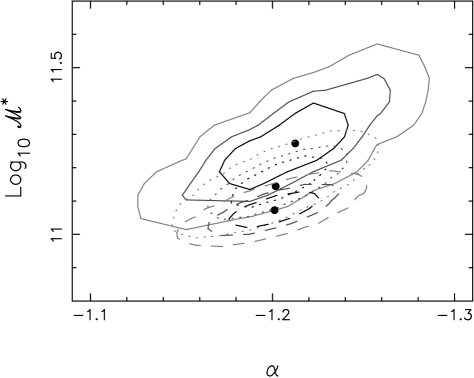
In left-hand panel in Fig. 4, left panel, we show the -band LFs of galaxies in the high- (filled circles), intermediate- (open circles) and low-density (crosses) regions covering areas (in the SOS/-band survey overlap) of 0.115, 0.330 and 1.062 deg2, respectively, together with their fits with a Schechter function (continuous, long-dashed and short-dashed lines, respectively). The background subtraction was performed as for the total LF simply scaling the counts with the area values because of the complex geometry of the three density regions. Figure 5 shows the confidence contours of the best fitting Schechter function for the three density regions. The faint-end slope becomes steeper from high- to low-density environments varying from –1.33 to –1.49, being inconsistent at the 2 confidence level (c.l.) between high- and low-density regions. We note that in this investigation the results are also more robust than those obtained for the total LF against variations in background galaxy counts, since we are considering denser supercluster regions and, furthermore the control field is significantly larger than the regions of different environments.
This result seems to be in contradiction with previous works (e.g. Balogh et al. 2001; Croton et al. 2005) which found a LF trend that varies smoothly with local density and/or environment. It should be note that these studies are based on the 2MASS survey which allows to investigate the luminosity distribution only down to about M⋆+2 at the redshift of Shapley, while we are considering a much fainter galaxy population which is more likely affected by environmental related processes (e.g. Haines et al. 2007).
It is also worth pointing out that comparing the flat NIR LF measured for field galaxies by recent surveys (e.g. 6dF Galaxy Survey, Jones et al. 2006) with our slope in the low-density environment, one has to take into account that, since we are still in the cluster environment, this region can be suitably associated to the infall region rather than to the field. On the other hand, the LF slopes obtained by CAIRNS (Cluster And Infall Region Nearby Survey; Rines et al. 2004) in both cluster virial and infall regions are consistent with the value derived for the overall SSC with a single Schechter function.
According to the statistics, in all the three environments the fit with a single Schechter function cannot be rejected, but there is some “structure” evident in the residuals: the fit systematically under- and over-predicts the observed counts as a function of magnitude. The LFs suggest instead a bimodal behaviour due to the presence of an upturn for faint galaxies, that cannot be described by using a single Schechter function. To successfully model these changes in slope and to compare our results with our optical LFs (see Sect. 4.4), we fit our data with a composite Gaussian + Schechter (G+S) LF (Fig. 4, central panel) and the sum of two Schechter (S+S) functions (Fig. 4, right panel). Looking at Fig. 4 and Tab. 2 we note that the G+S and S+S fits significantly improve the data description, particularly in the low-density region, where according the reduced the probability of the fit is P() 99.6% and 99.8% for the G+S and S+S functions against P() 46% for the single Schechter function. Since the function fitting the faint-end is poorly constrained by the data (the faint component dominates only in the last three magnitude bins), in order to estimate the uncertainties on the parameters characterizing the LF at fainter luminosities, m and , we proceed as follows. Fixing all the best fit parameters except m or , we randomly shift galaxy number counts according to their uncertainties, and then re-compute the best-fitting functions obtaining a range of values for m and . The faint-end slope becomes steeper from high-/intermediate- to low-density environments varying from –1.65 to –1.74 with the G+S fit.
4.4 Comparison with Optical LFs
In order to investigate the processes responsible for changing the shape of the galaxy LF, we compare the trends observed for the optical and the NIR LFs. Since the NIR LF is expected to approximate the SMF, while the optical LFs are more sensitive to the galaxy star-formation history, both are needed for investigating the nature of galaxies which dominate the faint-end. For instance, a steep optical LF can be compatible with a flat stellar mass function if dwarf galaxies have their luminosities boosted by starbursts, a scenario which can be probed by comparison to the NIR LF.
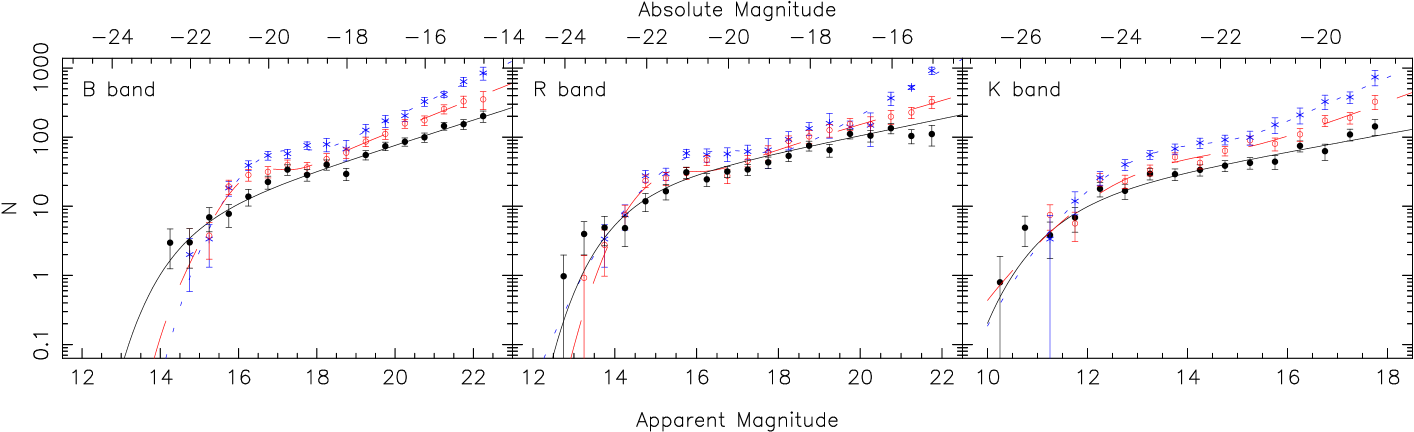
The optical LF of the SSC derived in the SOS (see MMH06) cannot be described by a single Schechter function due to the dips apparent at M⋆+2 both in and bands and the clear upturn in the counts for galaxies fainter than and 18 mag. Instead the sum of a Gaussian and a Schechter function, for bright and faint galaxies, respectively, is a suitable representation of the data. Furthermore, we observed significant environmental trends in the form of a dip which becomes deeper, and a faint-end slope which becomes steeper, with decreasing density. In particular, the slope values becomes significantly steeper from high- to low-density environments varying from –1.46 to –1.66 in band and from –1.30 to –1.80 in band, being inconsistent at more than 3 c.l. in both bands. Such a marked luminosity segregation is related to the behaviour of the red galaxy population: while red sequence counts are very similar to those obtained for the global galaxy population, the blue galaxy LFs are well described by single Schechter functions and do not vary with the density. We explained these results in terms of the galaxy harassment scenario, in which the late-type spirals that represent the dominant population at M⋆+2 are transformed by galaxy harassment into passively-evolving dwarf spheroids, and in the process become 1-2 magnitudes fainter due to mass loss and an ageing stellar population without new star formation. The observed changes in the shape of the LF can be considered as reflecting the changes in the mixture of galaxy morphological types with environment described by the morphology-density relation, from late-type dominant (and hence a steep faint-end to the LF) in low-density regions to early-type dominant (with a shallower faint-end to the LF), in the cluster cores (Binggeli, Sandage & Tammann 1988; de Lapparent 2003).
In Fig. 6 we compare the shape of the composite G+S (left panel), (central panel) LFs, derived in MMH06, with the relative -band LFs (right panel) in the three density regions. Both LFs (optical and NIR) are steeper in the low-density regions. However, the NIR LFs only marginally indicate an absence of M⋆+2 galaxies in low-density environment.
The study of the optical LFs showed that it is the red galaxy populations that turn out to contribute to the change of the LF trend with environment, in particular to the steepening of the faint-end slope. This is at odds with what is found in the field where the faint-end is populated by galaxies of smaller masses, later morphologies, bluer colours, later spectral types, and stronger line emission (e.g. Balogh et al. 2001; Madgwick et al. 2002). On the other hand, in clusters the LF of early-type galaxies is found to be steeper than in the field (De Propris et al. 2003). We should also take into account that at least part of the red galaxies contributing the Shapley LFs in different supercluster environments may not be passive: Haines et al. (2008) studying a volume-limited sample (0.0050.037) of local galaxies found that 30 of red sequence galaxies in the optical colour-magnitude diagram show signs of ongoing star-formation from their spectra and this contamination is greater at faint magnitudes (M–19 mag).
5 The galaxy stellar mass function
The combined optical and NIR data allow us to derive the distribution of galaxy stellar masses. The sample we analysed is in the magnitude range 1018 and refers to the 2 deg2 area covered by both the SOS and our -band imaging. We note that although the area of the NIR survey is slightly different from that of the SOS, both surveys map the same kinds of environment from the low- to the high-density (see the isodensity contours in Fig. 1).
One of the main concerns in deriving the stellar mass function of SSC galaxies is the foreground/background contamination that has to be estimated and corrected for. There exists already a wealth of spectroscopic data in the region covered by optical and NIR photometry, comprising about 650 galaxy redshifts (see Sect. 2) corresponding to 90 % of 16 mag galaxies. In order to extend the magnitude range and improve the statistics, we need to adopt a complementary approach for those galaxies without spectroscopic information. We use the probability that galaxies are supercluster members as derived by HMM06 following Kodama & Bower (2001). We consider separately the three cluster environments as well as the remaining galaxies in the SOS, and construct two-dimensional histograms with bins of width 0.4 mag in and 0.2 mag in to properly map the galaxy colour-magnitude distribution. The number counts in each bin are then compared with those expected for a suitable field region, normalized to have the same overall area. For this purpose we used a 4.3 deg2 region of deep imaging from the Deep Lens Survey (Wittman et al. 2002). The probability that a randomly selected SOS galaxy belongs to the supercluster is then determined from the ratio of the number counts obtained for that bin from the SOS and DLS (Eq. 1 of HMM06). For those galaxies with available redshifts the probability is set to 1 for 888The redshift range is derived from the redshift distribution of galaxies in the SOS field with available spectroscopy. or 0 otherwise.
The stellar masses of galaxies belonging to the Shapley supercluster, according to the previous criteria, contribute to the galaxy stellar mass function according to their likelihood of belonging to the Shapley supercluster.
5.1 Derivation of stellar masses
The stellar masses of galaxies belonging to the Shapley supercluster are estimated by means of stellar population models constrained by the observed optical and infrared colours. It is well known that stellar masses estimated using the fit to the multicolour spectral energy distribution (SED) are model dependent and subject to various degeneracies. In order to reduce such degeneracies we have used a large grid of complex stellar population models by Maraston (2005) with a Salpeter initial mass function covering a wide range of parameters. We use SEDs with the star-formation history (SFH) parameterised as , with between 1.0 and 20.0 Gyr, ages between 0.001 and 14 Gyr and metallicities in the range 0.5-2.0 Z⊙. We note that the metallicity of low-mass galaxies can be lower (e.g. Smith et al. 2009), but at present complex stellar population models do not explore such a low metallicity range. The synthetic spectra are shifted to the galaxy spectroscopic redshift, if known, or at the median supercluster redshift =0.05. Then for each of them we compute the , and magnitudes by adopting the Calzetti (2001) extinction. Since in the photometric calibration of the band the colour term () is not negligible, as discussed in MMH06, we use the WFI filter in order to compute magnitudes999Our B-band photometry agrees within the zero-point uncertainties (0.03 mag) with that obtained by the WIde-field Nearby Galaxy cluster Survey (WINGS; Varela et al. 2009) using independent WFI B-band observations for a subset of the SOS field. from the models.

The most appropriate evolutionary history is selected by fitting the optical + NIR photometry, and the mass is estimated by normalising the best-fit SED to the observed -band magnitude. This choice of model grid parameters yields a fairly uniform coverage of colour space and well represents the SEDs of the galaxies in the sample. The uncertainty on the resultant stellar mass was estimated by performing Monte Carlo simulations, shifting the galaxy colours according to their corresponding uncertainties, and re-computing each time the mass. Further sources of uncertainty in the fitting technique are the error on redshift, which is fixed at =0.05 for those galaxies without available spectroscopic redshift. We perform Monte-Carlo simulations by randomly shifting SEDs in the redshift range 0.0350.056 adopted to select spectroscopic confirmed supercluster members. This contribution to the mass uncertainty is negligible, since it is at least one order on magnitude lower than that due to the photometric errors. Besides of this, the main source of uncertainty is the adopted IMF (see Bell & de Jong 2001). Bell et al. (2003) found that, using the simple stellar populations with different IMF, stellar masses can be systematically increased by 0.1 dex or decreased by 0.45 dex, thus resulting in a overall rescaling of the stellar mass. A zero-point shift to the stellar mass scale would not affect any of our environment analyses, which are explicitly differential.
The average error on the mass evaluation is 20% and turns out to be 10-15% and 30-35% for galaxies with probabilities greater and less than 0.5 of being supercluster members, respectively.
5.2 Galaxy Stellar Mass Function
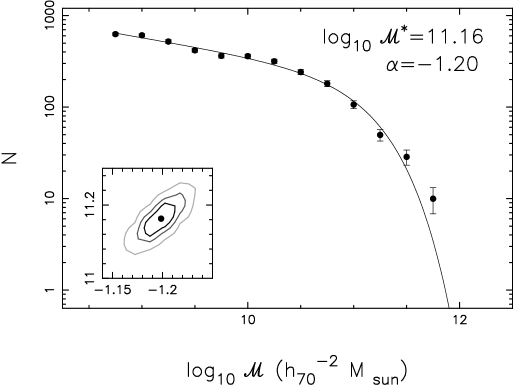
Figure 7 shows the stellar mass function of galaxies with M⊙ 1012 M⊙. Based on our -band completeness limit of , we conservatively derive the SMF down to =108.75M⊙, which corresponds to the estimated stellar mass of the quiescent galaxy population at our -band limit. Fitting a single Schechter function, the recovered parameters are log10()=11.16 and =–1.20 whose uncertainties are given by the confidence contours in Fig. 7.
We check the robustness of our result against possible completeness issues of the galaxy sample used in deriving the SMF. According to their location in the vs. colour-magnitude diagram, only 5% of the galaxies in the band catalogue which are possible supercluster members (i.e. which lie along or below the red sequence) do not have available estimates of probability. These galaxies are uniformly distributed in the magnitude bins, and mostly lack optical data (and hence probabilities) due to their location near bright stars, which produce large ghosts in the optical data. We note also that the low-mass galaxies we may have lost would contribute to increase the low-mass-end slope of the SMF.
For what concerns the observed trend of the galaxy SMF, the slope is in agreement with previous works concerning the SMF of field galaxies (Cole et al. 2001, in the mass range – M⊙; Panter et al. 2004, in the mass range – M⊙). On the other hand the faint-end slope of the SSC turns out to be shallower than the value given by Balogh et al. (2001) for the local mass function of cluster galaxies [2MASS/ Las Campanas Redshift Survey (LCRS)] although the latter is affected by a large uncertainty (0.1 at 1). The value of is higher than that observed in the field (e.g. Bell et al. 2003), as expected for cluster environment. The SMF of supercluster galaxies is characterised by an excess of massive galaxies that is associated to the cluster BCGs.
In Fig. 8 we show the SMF for the different supercluster environments. Unlikely in the case of the LF no environmental trend is seen in the slope of the SMFs (see Fig. 9). On the other hand, the increase from low- to high-density regions and the excess of high-mass galaxies remains dependent on the environment. We remark that the uncertainty due to the adopted IMF (see Sect. 5.1) does not affect our analysis since the stellar masses at a fixed epoch will be all changed by the same amount.
6 Discussion
6.1 The faint-end upturn in the -band LFs
We observed a steep faint-end slope for the Shapley supercluster -band LF (Fig. 3) obtaining =–1.42, similarly to values observed for the cluster LFs of Mobasher & Trentham (1998) and Andreon & Pelló (2000). De Propris et al. (1998) observed a steeper slope of =–1.7 deriving the NIR LF for a wider area (29′.222′.5) of the Coma cluster (corresponding to 15′11′ at z0.05) down to =16 mag (15.7), but the authors conservatively consider this result as an indication of a steep LF for dwarf galaxies rather than a precise estimate of the slope. On the other hand, other studies found a less steep or flat faint-end slope in the NIR LF for cluster galaxies (e.g. Lin et al. 2004).
The steep slope of the cluster LF has been discussed considering the otherwise flat LF of field galaxies (e.g. Cole et al. 2001) and how the environmental effects could shape the galaxy LF. Balogh et al. (2001; see also Croton et al. 2005) demonstrated that there is a statistical difference between the cluster and field galaxy NIR LFs, with a brighter M⋆ and a steeper faint-end slope for clusters with respect to the field. An interpretation can be inferred from the trends observed for the LFs of early- and late-type field galaxies. Huang et al. (2003) found that the later type galaxies have a fainter M⋆ and a steeper slope with respect to the early-type galaxies in the field. Their faint-end slope for late-type galaxies is equal to the value we obtained for the SSC (–1.42), although for a brighter sample. This suggests a scenario whereby the faint-end upturn in the cluster LF is due to late-type objects accreted from the field. This scenario is further supported by the result of Harsono & De Propris (2007) who did not detect the up-turn in two intermediate redshift clusters indicating that this feature has recent origins.
By considering the LFs of the Shapley supercluster in different density environments, we found a steepening of the faint-end slope which changes from =–1.33 to =–1.49, being inconsistent at 2 c.l. between high- and low-density regions. Moreover, the general shape of the LFs in the low-density region turns out to be better reproduced using the combination of G+S functions. This observed bimodality in the LF and its variation with environment suggest a scenario where bright and faint galaxy populations have followed different evolution histories and indicate that an environmental effect such as galaxy harassment and/or ram pressure stripping could be responsible for shaping the LF. This entails that the environment is responsible of the final mixture of the galaxy types, in particular for the faint/low-mass galaxies.
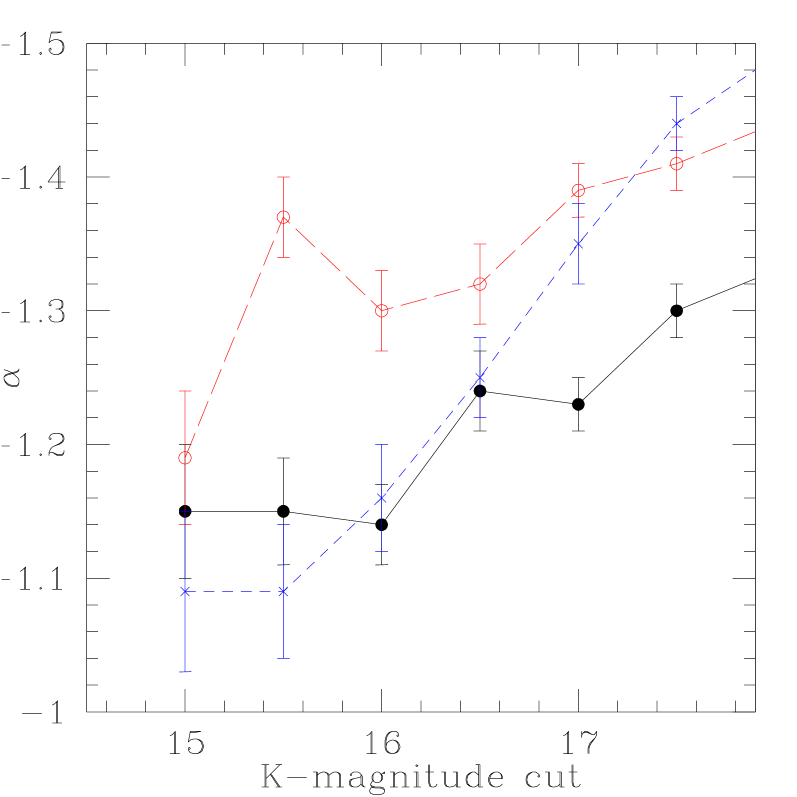
The stellar and/or field contamination can artificially produce the faint-end upturn. We checked carefully the issues of the stellar contamination (see Sec. 3.2) and we chose a control field characterized by a deeper limiting magnitude and a larger area respect to the Shapley -band survey in order to rely on the star/galaxy classification and to account for the field-to-field variance. Assuming the trend we observed to be real, we make a simple exercise to understand how the survey depth can affect the measured shape of the LF. In Fig. 10 we show that the slope of the faint-end becomes clearly steeper as the depth of the sample is increased in all the supercluster environments, demonstrating the need for such deep data-sets to understand the role of environment on galaxy evolution.
The observed trend with environment is more dramatic for the Shapley optical LFs obtained by MMH06. In particular, the faint-end slope becomes steeper at significance level from high- ( =–1.46, =–1.30) to low-density environments ( =–1.66, =–1.80) in and bands. Also the bimodality of the galaxy LF, commonly observed for rich clusters (e.g., Yagi et al. 2002; Mercurio et al. 2003), turns out to be more evident in the optical bands. We note that the SOS is about 1.5 magnitude deeper in band respect to the band considering =2.6.
6.2 The galaxy stellar mass function
The stellar mass functions derived for the supercluster galaxies are in general agreement with those obtained by Baldry et al. (2006) who using SDSS data did not find changes in the slope of the SMF with environment, except for changes in the characteristic mass which increases with the local density. We do find a steeper slope: =–1.200.02, instead of –1 of Baldry et al. (2006) who did not quote error estimates. This discrepancy might be due to systematic uncertainties in the mass derivation: in fact, using the MOPED algorithm, Panter et al. (2004) obtained for the SDSS data =–1.1590.008 which is consistent within the errors with our findings. Another source of discrepancy can be due to the use of the -band data to estimate the galaxy stellar masses, but the slope obtained by Bell et al. (2003) combining 2MASS and SDSS data-sets is significantly lower (=–0.86) respect to those of SSC in all environments. As shown by Bell et al. (2003) the difference here may be due to the fact that 2MASS misses low surface brightness galaxies. They estimated the -band flux and stellar masses from the optical photometry for the galaxies not detected in -band and produced a -band derived stellar mass function with =–1.10.
Baldry et al. (2008) found a strong low-mass upturn below M⊙ analysing the NYU-VAGC101010New York University Value-Added Galaxy Catalog (Blanton et al. 2005a, 2005b), their SMF being fitted by a S+S function with, in the low-mass end, =–1.580.02. An upturn in the SMF was also shown by Jenkins et al. (2007) for the Coma cluster by means of Spitzer InfraRed Array Camera (IRAC) observations. They observed a steep increase in two different Coma regions below M⊙ with –2 (but they did not quantify the trend with a fit of the data).
The fact that we do not observe any upturn in the SMF of the Shapley supercluster can be related to the different mass range or to environmental differences. Jenkins et al. (2007) and Baldry et al. (2008) extend their analysis to =107.5M⊙ and =108M⊙, respectively, with the faint-end upturn becoming evident at 109M⊙, very close to our mass limit is =108.75M⊙. This suggest that the reason why we see an upturn in the -band LF, but not in the SMF, is that the galaxies which cause the faint-end upturn are star-forming galaxies with low stellar mass-to-light ratios and stellar masses in the range 10109M⊙. This would be consistent with Bolzonella et al. (2009) who found that the upturn was due to late-type galaxies, but inconsistent with the finding of MMH06 in which the upturn appeared due to red sequence galaxies.
Jenkins et al. (2007) analysed two regions of the Coma cluster: one in the cluster centre (0.733 deg2 corresponding to 2.1 Mpc2) and one off-centre region (0.555 deg2 corresponding to 1.6 Mpc2) located 1.7 Mpc southwest. The area of the SSC covered both by the SOS and the -band survey is 30 Mpc2. Therefore, we are studying a much larger area that comprises infall regions as well as cluster cores. Dynamical analysis indicates that at least a region of radius 11 Mpc centred on the central cluster A 3558, and possibly the entire supercluster, is past turnaround and is collapsing (Reisenegger et al. 2000), while the core complex itself is in the final stages of collapse, with infall velocities reaching 2000 km s-1. This differences in the environments may be responsible of differences in the stellar mass function for the two cosmic structures. Another, possible issue can be related to the background subtraction (see Rines & Geller 2008).
Investigating the environmental effect on the SMF in the SSC, we find that both and the excess of galaxies at the bright-end increase as foreseen by the hierarchical models where the most massive galaxies formed in the density peaks. On the other hand the faint-end slope does not change in the different supercluster environments suggesting that the mechanism that is acting in shaping the LF (see Sect. 4.3) does not significantly affect the galaxy stellar masses.
6.3 Comparison with the simulations
We should expect changes in the -band luminosity function with environment to reflect two processes: (i) the effect of the diverse merging histories of galaxies in different environments within the context of the hierarchical merging scenario, in which cluster galaxies are likely to have formed earlier and had a more active merger history than field galaxies that form in the smoother low-density regions; and (ii) the later impact of environmental processes such as tidal stripping, which may drastically reduce the stellar mass of galaxies in high-density regions. While it is very difficult to quantify the latter’s contribution to the galaxy luminosity/mass function, we can attempt to measure the former contribution by comparison to the cosmological numerical simulations.
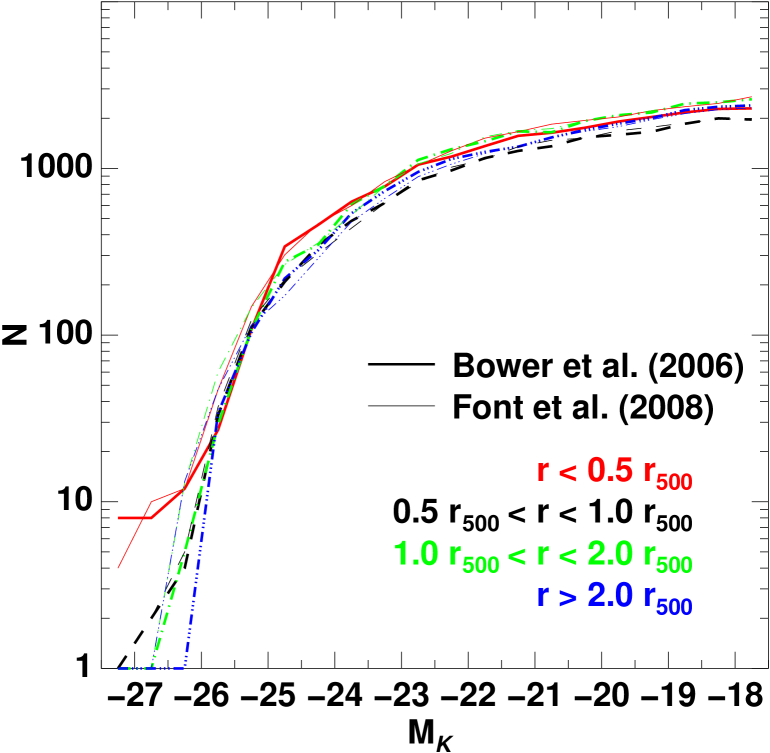
To this aim, we extracted galaxy catalogues in the vicinity of the 20 most massive dark matter halos from the Millennium simulation (Springel et al. 2005), corresponding to galaxy clusters with masses 7–2M⊙ and velocity dispersions ( km s-1). These simulations cover a (500Mpc)3 volume, producing DM halo and galaxy catalogues based on the semi-analytic models (SAMs) of Bower et al. (2006) and Font et al. (2008) for which positions, peculiar velocities, absolute magnitudes and halo masses are all provided at 63 snapshots to , allowing the orbit of each galaxy with respect to the cluster centre to be followed. We select member galaxies from these twenty clusters that have , and lie within 5 Mpc of the cluster centre, and show in Fig. 11 the stacked -band cluster luminosity functions of galaxies as a function of projected cluster-centric distance, scaled by the value of each cluster’s DM halo. We show the LFs obtained from both the Bower et al. 2006 (thick lines) and Font et al. 2008 (thin lines) SAM galaxy catalogues, and the four different curves correspond to , , and . For comparison, the values for the clusters in the SSC derived from Chandra X-ray observations (Sanderson et al. 2006; Haines et al. 2009) are 1.29 Mpc (22.9 arcmin at ) for A 3558, 0.91 Mpc (16.1 arcmin) for A 3562 and SC 1327-312 and 0.76 Mpc (13.5 arcmin) for SC 1329-317. By inspection of Fig. 1, our high-, intermediate- and low-density regions correspond approximately to the , and radial bins respectively.
It is immediately apparent from Fig. 11 that there is little if any environmental dependence of the -band luminosity function, except at the very bright end (), while equally there are no significant differences between the two semi-analytic models. This is confirmed if we compare the derived best-fitting single Schechter functions to the SAM LFs, with , for and , for . Similarly, if we select just those galaxies which have already passed through the cluster core (based on following their orbits), and hence are most likely to correspond to the red sequence population, we find no significant variation in the LFs with cluster-centric radius. There is also no sign of an upturn at faint magnitudes, although we note the SAM galaxy catalogues start to become incomplete at due to the limited mass resolution in the Millennium simulation (Bower et al. 2006). The only clear difference among the LFs is the excess at the extreme bright end () in the inner cluster region, due to the BCG population. Moreover, the test gives a probability of 0% that the observed and SAM LFs are drawn by the same parent distribution.
Although the merging history of galaxies at the faint-end () may not be fully resolved by the semi-analytic models, we may expect at least their stellar masses (and hence -band luminosities) to be reasonably robust (Bower et al. 2006). In previous works discussing the presence of a dip in the galaxy luminosity function, it has been suggested the merging of galaxies as a possible pathway to form the dip. However the consistency of the luminosity functions with cluster-centric radius, suggests that the variations observed in the Shapley supercluster (Fig. 6) are not primarily due to variations in the merging histories of galaxies, this being a process that should be well described by the semi-analytic models. Instead processes such as tidal stripping or harassment of infalling spiral galaxies, which are not yet included in the semi-analytic models seem more plausible pathways to produce the observed variations in the galaxy LFs.
7 Summary and conclusions
It is well known that the NIR luminosities provide a more reliable estimate of the stellar masses compared to the optical ones due to the fact that the mass-to-light ratios in the NIR vary by at most a factor 2 across a wide range of star formation histories (Bell & de Jong 2001) in comparison to the much larger variations of the M/L ratios (up to a factor 10) observed at optical wavelengths. In addition the effects of the extinction are much weaker at infrared wavelengths that in the optical ones, and k-corrections for infrared colours are only weakly dependent on the Hubble type and vary slowly with redshift (e.g. Poggianti 1997). In our study we exploit new deep (=18 mag) -band imaging of the SSC complemented by the deep optical imaging down to =22.5 mag and =22 mag from the SOS, and a spectroscopically confirmed supercluster sample of 650 galaxies across the same field which is 90% complete at 16 mag. We present an analysis of the -band LF of galaxies as a function environment and we derive the galaxy SMF in order to constrain the physical mechanisms that transform galaxies in different environments as function of galaxy mass.
Our results are summarized as follows.
- -
-
The -band LF can be fitted by a single Schechter function, with and in agreement with previous works of comparable depth.
- -
-
The -band LF faint-end slope becomes steeper from high- to low-density environments varying from –1.33 to –1.49, being inconsistent at the 2 c.l. (see Tab 2), indicating that the faint galaxy population increases in low-density environments. Such an environmental dependence confirms our finding for the optical LFs derived in the same supercluster regions although the changes in slope are less dramatic at NIR wavebands.
- -
-
The observed trend of the galaxy SMF presents a slope in agreement with previous works concerning the SMF of field galaxies (Cole et al. 2001; Panter et al. 2004). The value of is higher with respect to that observed in the field (e.g. Bell et al. 2003), as expected for cluster environment. The SMF of supercluster galaxies is characterised by an excess of massive galaxies that is associated to the cluster BCGs. Discrepancies with previous work that observed a strong faint-end upturn (Baldry et al. 2008 and Jenkins et al. 2007) can be related to the different mass ranges investigated and/or environmental differences in the analysed structures.
- -
-
Differently from the LF no environment effect is found in the slope of the SMFs. On the other hand, the increase from low- to high-density regions and the excess of galaxies at the bright-end is also dependent on the environment. This trend is in general agreement with the results of Baldry et al. (2006).
In order to interpret our findings, we use the Millennium simulation which produce DM halo and galaxy catalogues based on SAMs. The cluster NIR LFs obtained using the simulated catalogues do not show any significant variation with cluster-centric radius, thus suggesting that the variations observed in the LFs of the Shapley supercluster are not driven by variations in the merging histories of the galaxies, but are likely related to processes such as tidal stripping or harassment of infalling galaxies.
By comparing the effect of environment at optical and NIR wavebands in shaping the LFs and taking into account that the slope of the galaxy SMF is invariant with respect to the environment, it seems that the physical mechanism responsible for the transformation of galaxies properties in different environment are related to the quenching of the star formation rather than mass-loss.
This suggests that the mechanism responsible for shaping the LF and SMF is partially related to the mass loss due to tidal stripping or galaxy harassment, but gas stripping by the ICM can also affect the galaxy population removing the cold gas supply and thus rapidly terminating ongoing star-formation. These mechanisms all require a dense ICM and so their evolutionary effects on massive galaxies are limited to the cores of clusters, but can extend to poorer environments for dwarf galaxies which are easier to strip. The infalling galaxies are probably late-type (see MMH06) that are affected by gas stripping entering in the supercluster. On the other hand, the depth of the NIR survey could affect the present results by not allowing us to detect an upturn of the SMF which can be detected at a mass range lower than reached here (see Jenkins et al. 2007). In order to identify the mechanisms which drive galaxy evolution in the supercluster environment we are undertaking a survey with the integral field spectrograph WiFeS which will provide a unique data set to investigate in details the stellar populations and kinematics for a subsample of the Shapley galaxies.
Acknowledgements
This work was carried out in the framework of the collaboration of the FP7-PEOPLE-IRSES-2008 project ACCESS. AM acknowledges financial support from INAF - Osservatorio di Capodimonte. CPH acknowledges financial support from STFC. RJS was supported under STFC rolling grant PP/C501568/1 “Extragalactic Astronomy and Cosmology at Durham 2005-2010”. The authors wish to thank the staff at UKIRT, CASU and WFAU for making the observations and processing the data, and the UKIDSS project and archive which has been used for computing the field galaxy counts (3rd data release). The authors thank the anonymous referee for helping to improve this work.
References
- Andreon & Pelló (2000) Andreon S., Pelló R., 2000, A&A, 353, 479
- Baldry et al. (2006) Baldry I. K., Balogh M. L., Bower R. G., Glazebrook K., Nichol R. C., Bamford S. P., Budavari T., 2006, MNRAS, 373, 469
- Baldry et al. (2008) Baldry I. K., Glazebrook K., Driver S. P., 2008, MNRAS, 388, 945
- Balogh et al. (2001) Balogh M. L., Christlein D., Zabludoff A. I., Zaritsky D., 2001, ApJ, 557, 117
- Bell & de Jong (2001) Bell E. F., de Jong R. S., 2001, ApJ, 550, 212
- Bell et al. (2003) Bell E. F., McIntosh D. H., Katz N., Weinberg M. D., 2003, ApJSS, 149, 289
- Benson et al. (2003) Benson A. J., Bower R. G., Frenk C. S., Lacey C. G., Baugh C. M., Cole S., 2003, ApJ, 599, 38
- Bernstein et al. (1995) Bernstein G. M., Nichol R. C., Tyson J. A., Ulmer M. P., Wittman D., 1995, AJ, 110, 1507
- Bertin & Arnouts (1996) Bertin E., Arnouts S., 1996, A&AS, 331, 439
- Binggeli, Sandage & Tammann (1988) Binggeli B., Sandage A., Tammann G. A., 1988, ARA&A, 26, 509
- Blanton et al. (2003) Blanton M. R., Hogg D. W., Bahcall N. A., et al., 2003, ApJ, 594, 186
- Blanton et al. (2005a) Blanton M. R., Lupton R. H., Schlegel D. J., Strauss M. A., Brinkmann J., Fukugita M., Loveday J., 2005, ApJ, 631, 208
- Blanton et al. (2005b) Blanton M. R., Schlegel D. J., Strauss M. A. et al., 2005, AJ, 129, 2562
- Bolzonella et al. (2009) Bolzonella M., Kovaĉ K., Pozzetti L., et al., 2009, A&A, submitted, arXiv0907.0013
- Bower et al. (2006) Bower R. G., Benson A. J., Malbon R., Helly J. C., Frenk C. S., Baugh C. M., Cole S., Lacey C. G., 2006, MNRAS, 370, 645
- Calzetti (2001) Calzetti D., 2001, PASP, 113, 1449
- Cole et al. (2001) Cole S., Norberg P., Baugh C. M. et al., 2001, MNRAS, 326, 255
- Cristóbal-Hornillos et. (2009) Cristóbal-Hornillos D., Aguerri J. A. L., Moles M., et al., 2009, ApJ, 696, 1554
- Croton et al. (2005) Croton D. J., Farrar G. S., Norberg P., et al., 2005, MNRAS, 356, 1155
- Dekel & Birnboim (2006) Dekel A., Birnboim Y., 2006, MNRAS, 368, 2
- De Propris & Pritchet (1998) De Propris R., Pritchet C. J., 1998, AJ, 116, 1118
- De Propris et al. (1998) De Propris R., Eisenhardt P. R., Stanford S. A., Dickinson M., 1998, ApJ, 503, L45
- De Propris et al. (1999) De Propris R., Stanford S. A., Eisenhardt P. R., Dickinson M., Elston R., 1999, AJ, 118, 719
- De Propris et al. (2003) De Propris R., Colless M., Driver S. P., et al., 2003, MNRAS, 342, 725
- De Propris et al. (2007) De Propris R., Stanford S. A., Eisenhardt P. R., Holden B. P. M., Rosati P., 2007, AJ, 133, 2209
- Dopita et al. (2007) Dopita M., Hart J., McGregor P., Oates P., Bloxham G. Jones D., 2007, Ap&SS, 310, 255
- Drory et al. (2003) Drory N., Bender R., Feulner G., Hopp U., Maraston, Snigula J., Hill G.J, 2003, ApJ, 595, 698
- Ellis & Bland-Hawthorn (2007) Ellis S. C., Bland-Hawthorn J., 2007, MNRAS, 377, 815
- Font et al. (2008) Font A., Bower R. G., McCarthy I. G., Benson A. J., Frenk C. S., Helly J. C., Lacey C. G., Baugh C. M., Cole S., 2008, MNRAS, 389, 1619
- Gargiulo et al. (2009) Gargiulo A., Haines C. P., Merluzzi P., et al., 2009, MNRAS, 2009, MNRAS, 397, 75
- Gavazzi et al. (1996) Gavazzi G., Pierini D., Boselli A., 1996, A&A, 312, 397
- Haines et al. (2006a) Haines C. P., La Barbera F., Mercurio A., Merluzzi P., Busarello G., 2006a, ApJ, 647, L21
- Haines et al. (2006b) Haines C. P., Merluzzi P., Mercurio A., Gargiulo A., Krusanova N., Busarello G., La Barbera F., Capaccioli M., 2006b, MNRAS, 371, 55
- Haines et al. (2007) Haines C. P., Gargiulo A., La Barbera F., Mercurio A., Merluzzi P., Busarello G., 2007, MNRAS, 381, 7
- Haines et al. (2008) Haines C. P., Gargiulo A., Merluzzi P., 2008, 385, 1201
- Haines et al. (2009) Haines C. P., Smith G. P., Egami E., et al., ApJ, 704, 126
- Hambly et al. (2008) Hambly N. C., Collins R. S., Cross N. J. G., et al., 2008, MNRAS, 384, 637
- Harsono & De Propris (2007) Harsono D. S., De Propris R., 2007, MNRAS, 380, 1036
- Huang et al. (2003) Huang J.-S., Glazebrook K., Cowie L. L., Tinney C., 2003, ApJ, 584, 203
- Jenkins et al. (2007) Jenkins L. P., Hornschemeier A. E., Mobasher B., Alexander D. M., Bauer F.E., 2007, AJ, 666, 846
- Jones et al. (2004) Jones D.H., Saunders W., Colless M., et al., 2004, MNRAS, 355, 747
- Jones et al. (2006) Jones D.H., Peterson B.A., Colless M., Saunders W., 2006, MNRAS, 369, 25
- Kauffmann et al. (1993) Kauffmann G., White S.D.M., Guidaroni B., 1993, MNRAS, 264, 201
- Kauffmann & Charlot (1998) Kauffmann G., Charlot S., 1998, MNRAS, 293, L23
- Kauffmann et al. (2003) Kauffmann G., Heckman T. M., White S. D. M., et al., 2003, MNRAS, 341, 54
- Keres et al. (2005) Keres D., Katz N., Weinberg D. H., Davé R., 2005, MNRAS, 363, 2
- Kochanek et al. (2001) Kochanek A. S., Pahre M. A., Falco E. E., Huchra J. P., Mader J., 2001, AJ, 560, 566
- Kodama & Bower (2001) Kodama T., Bower R., 2001, MNRAS, 321, 18
- Kodama & Bower (2003) Kodama T., Bower R., 2003, MNRAS, 346, 1
- Kron (1980) Kron R. G., 1980, ApJS, 43, 305
- Kümmel & Wagner (2001) Kümmel M. W., Wagner S. J., 2001, A&A, 370, 384
- Irwin et al. (2004) Irwin M. J., Lewis J., Hodgkin S., Bunclark P., Evans D., McMahon R., Emerson J. P., Stewart M., Beard S., 2004, SPIE, 5493, 411
- La Barbera et al. (2008) La Barbera F., de Carvalho R. R., Kohl-Moreira J. L., Gal R. R., Soares-Santos M., Capaccioli M., Santos R., Sant’anna N., 2008, PASP, 120, 681
- Landolt (1992) Landolt A. U., 1992, AJ, 104, 340
- de Lapparent (2003) de Lapparent V., 2003, A&A, 408, 845
- Lawrence et al. (2007) Lawrence A., Warren S. J., Almaini O., et al., 2007, MNRAS, 379, 1599
- Lin et al. (2003) Lin Y-T., Mohr J. J., Stanford S. A., 2003, ApJ, 591, 749
- Lin et al. (2004) Lin Y-T., Mohr J. J., Stanford S. A., 2004, ApJ, 610, 745
- Lin et al. (2006) Lin Y., Mohr J. J., Gonzalez A. H., Stanford S. A., 2006, AJ 650, L99
- Madgwick et al. (2002) Madgwick D. S., Lahav O., Baldry I. K., et al., 2002, MNRAS, 333, 133
- Maraston (2005) Maraston C., 2005, MNRAS, 362, 799
- Mercurio et al. (2003) Mercurio A., Massarotti M., Merluzzi P., Girardi M., La Barbera F., Busarello G., 2003, A&A, 408, 57
- Mercurio et al. (2006) Mercurio A., Merluzzi P., Haines C. P., et al., 2006, MNRAS, 368, 109
- Mobasher & Trentham (1998) Mobasher B., Trentham N. D., 1998, MNRAS, 293, 315XS
- Panter et al. (2004) Panter B., Heavens A. F., Jimenez R., 2004, MNRAS, 355, 764
- Pisani (1993) Pisani A., 1993, MNRAS, 265, 706
- Pisani (1996) Pisani A., 1996, MNRAS, 278, 697
- Poggiant (1997) Poggianti B. M., 1997, A&AS, 122, 399
- Ramella et al. (2004) Ramella M., Boschin W., Geller M. J., Mahdavi A., Rines K., 2004, AJ, 128, 2022
- Reisenegger et al. (2000) Reisenegger A., Quintana H., Carrasco E. R., Maze J., 2000, AJ, 120, 523
- Rines et al. (2004) Rines K., Geller M. J., Diaferio A., Kurtz M. J., Jarrett T. H., 2004, AJ, 128, 1078
- Rines et al. (2005) Rines K., Geller M. J., Kurtz M. J., Diaferio A., 2005, AJ, 130,1482
- Rines & Geller (2008) Rines K., Geller M. J., 2008, AJ, 135, 1837
- Sanderson et al. (2006) Sanderson A. J. R., Ponman T. J., O’Sullivan E., 2006, MNRAS, 372, 1496
- Shapley (1930) Shapley H., 1930, Bull. Harvard Obs., 874, 9
- Shectman et al. (1996) Shectman S. A., Landy S. D., Oemler A., Tucker D. L., Lin H., Kirshner R. P., Schechter P. L., 1996, ApJ, 470, 172
- Smith et al. (2007) Smith R. J., Lucey J. R., Hudson M. J., 2007, MNRAS, 381, 1035
- Smith et al. (2009) Smith R. J., Lucey J. R., Hudson M. J., 2007, MNRAS, in press
- Smith et al. (2009) Smith R. J., Lucey J. R., Hudson M. J., Allanson S. P., Bridges T. J., Hornschemeier A. E., Marzke R. O., Miller N. A., 2009, MNRAS, 392, 1265
- Springel et al. (2005) Springel V., White S. D. M., Jenkins A., et al., 2005, Nature, 435, 629
- Treu et al. (2003) Treu T., Ellis R. S., Kneib J-P., Dressler Alan, Smail I., Czoske O., Oemler A., Natarajan P., 2003, ApJ, 591, 53
- Väisänen et al. (2000) Väisänen P., Tollestrup E. V., Willner S. P., Cohen M., 2000, ApJ, 540, 593
- Vandame (2004) Vandame B., 2004, Nice University, PhD thesis
- Varela et al. (2009) Varela J., D’Onofrio M., Marmo C., et al., 2009, A&A, 497, 667
- Wake et al. (2006) Wake D. A., Nichol R. C., Eisenstein D. J., et al., 2006, MNRAS, 372, 537
- Wittman et al. (2002) Wittman D. M., Tyson J. A., Dell’Antonio I. P., et al., 2002, SPIE, 4836, 73
- Yagi et al. (2002) Yagi, M., Kashikawa, N., Sekiguchi, M.,Doi M., Yasuda N., Shimasaku K., Okamura S., 2002, AJ, 123, 87