New searches for H i 21-cm in damped Lyman- absorption systems
Abstract
We present the results of three separate searches for H i 21-cm absorption in a total of twelve damped Lyman- absorption systems (DLAs) and sub-DLAs over the redshift range . We find no absorption in the five systems for which we obtain reasonable sensitivities and add the results to those of other recent surveys in order to investigate factors which could have an effect on the detection rate: We provide evidence that the mix of spin temperature/covering factor ratios seen at low redshift may also exist at high redshift, with a correlation between the 21-cm line strength and the total neutral hydrogen column density, indicating a roughly constant spin temperature/covering factor ratio for all of the DLAs searched. Also, by considering the geometry of a flat expanding Universe together with the projected sizes of the background radio emission regions, we find, for the detections, that the 21-cm line strength is correlated with the size of the absorber. For the non-detections it is apparent that larger absorbers (covering factors) are required in order to exhibit 21-cm absorption, particularly if these DLAs do not arise in spiral galaxies. We also suggest that the recent detection towards TXS 0311+430 arises in a spiral galaxy, but on the basis of a large absorption cross-section and high metallicity, rather than a low spin temperature (York et al., 2007).
keywords:
quasars: absorption lines – cosmology: observations – galaxies: high redshift – galaxies: ISM – radio lines: galaxies1 Introduction
Damped Lyman- absorption systems (DLAs) are believed to be the precursors of modern day galaxies, containing at least 80% of the neutral gas mass density of the Universe (Prochaska et al., 2005). As the name suggests, DLAs are identified through their heavily damped absorption features, due to the large columns of neutral hydrogen ( ) through which the background quasar is viewed. The 21-cm spin-flip transition is of interest since it traces the cool component of the gas, with the comparison of the 21-cm absorption strength to the total neutral hydrogen column giving the gas spin temperature () for a fully absorbed emission region () [see Equ. 1, Sect. 3.1]. Searches for 21-cm absorption in DLAs exhibit a detection rate, the detections occuring predominately at low redshift (), suggesting an increase in the ratio with redshift, which could be due to higher spin temperatures and/or lower covering factors.
In order to shed light on which is the predominant factor, we have undertaken searches with the Green Bank (GBT) and Giant Metrewave Radio (GMRT) Telescopes. In particular, we aim to:
-
1.
Test the hypothesis of Curran et al. (2005) that 21-cm absorption should be readily detectable at high redshift, despite the large ratios, by searching for 21-cm absorption in DLAs which lie towards compact radio sources.
-
2.
Test the hypothesis of Curran et al. (2007b) that the spin temperature does not continue to increase with redshift, by searching in previously unsearched high redshift () DLAs.
-
3.
Test the line strength–metallicity correlation ( – [M/H] anti-correlation) of Curran et al. (2007b), which suggests that several, currently undetected, DLAs should be readily detectable in 21-cm absorption.
We have observed a dozen DLAs and sub-DLAs and in this paper we present and discuss the results in the context of the above issues.
2 Sample Selection and Observations
2.1 GBT 2006 observations
2.1.1 Motivation
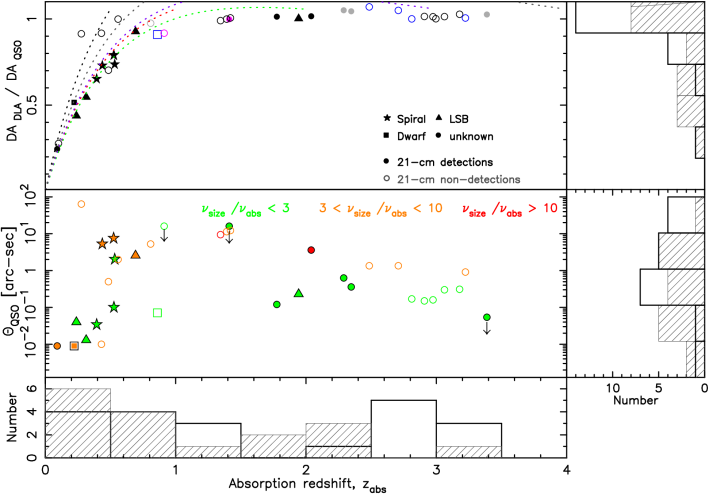
Prior to the recent high redshift detections (Kanekar et al. 2006; Kanekar et al. 2007; York et al. 2007, discussed below), all of the DLAs detected in 21-cm absorption were at redshifts of , where there is also an approximately equal number of non-detections. Kanekar & Chengalur (2003), interpreted this as the low redshift DLAs having a mix of spin temperatures, whereas the high redshift absorbers have exclusively high spin temperatures. However, all of the absorbers have large DLA-to-QSO angular diameter distance ratios (), whereas the absorbers have a mix of ratios, due to the geometry effects of a flat expanding Universe (Curran & Webb, 2006): Those with low ratios are almost always detected in 21-cm absorption, whereas those with high ratios tend not to be detected, which is how the “spin temperature” distribution of Kanekar & Chengalur (2003) is segregated. This strongly suggests, on the grounds of geometry alone and not allowing for various absorber and emitter sizes, that the covering factor, rather than the spin temperature, is the crucial criterion in determining the detectability of 21-cm absorption, where an absorber at high redshift will always cover the background quasar much less effectively than an equivalent absorber–quasar system at low redshift. Furthermore, Curran et al. (2005) had previously suggested that the non-detections at high redshift could be due to low covering factors, as opposed to elevated spin temperatures, and so 21-cm absorption should be readily detectable in high redshift DLAs towards very compact radio sources.
With the Green Bank Telescope we therefore embarked upon a survey for H i 21-cm absorption in the known radio-illuminated DLAs yet to be searched, prioritised by a small radio source size. For this we used the Sloan Digital Sky Survey Damped Ly Survey Data Release 1 (Prochaska & Herbert-Fort, 2004) combined with the previously unsearched systems (Curran et al., 2002), giving 57 DLAs occulting radio-loud ( Jy) quasars. We then short-listed the DLAs and sub-DLAs in which the 21-cm transition was redshifted into the Prime Focus 342 and 450 MHz bands and which were located towards the four most compact radio sources – B3 0758+475 (SDSS J080137.67+472528.2), PKS 1402+044, PKS B1418–064 and PKS 2136+141 (Table 1, where we also give the radio source sizes for the other objects searched).
| QSO | [arc-sec] | [GHz] | Reference |
|---|---|---|---|
| 0454+039 | 2.3 | Beasley et al. (2002) | |
| 0528–250 | 0.010 | 5.0 | Fomalont et al. (2000) |
| 0758+475 | 1.4 | FIRST | |
| J0816+4823 | 1.4 | FIRST | |
| 0957+561A | 11.36 | 5.0 | Harvanek et al. (1997) |
| 1402+044 | 1.35 | 1.4 | FIRST |
| 1418–064 | 1.27 | 1.4 | FIRST |
| 2136+141 | 0.002 | 5.0 | Gurvits et al. (1999) |
FIRST: The Very Large Array’s Faint Images of the Radio Sky at Twenty Centimetres.
2.1.2 Observations and data reduction
The observations were performed with the GBT PF1 342 and 450 MHz receivers in position switching mode (level-3 sampling, one spectral window and dual polarisation). The backend was either the GBT spectrometer using 32 768 lags over a 12.5 MHz band, giving a channel spacing of 381.47 Hz, or when RFI appeared to be particularly bad, the spectral processor, using 1024 lags over a 10 MHz band, giving a channel spacing of 9.766 kHz.
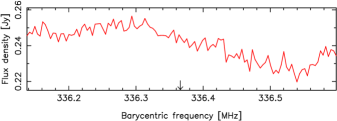
0758+475 was observed on the 1st of December 2006 for a total of 7 hours. At a central frequency of 336 MHz, the channel spacing of the GBT spectrometer gave a resolution of 0.34 . The system temperature was typically K and RFI was not
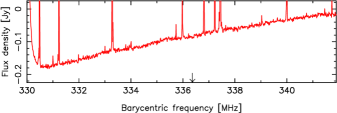
too severe, allowing 6.0 hours of data to be retained. Although most spectral baselines were flat with the odd intermittent spike, the measured fluxes were found to vary considerably between scans (from to Jy), not permitting us to determine the flux density of this source (Fig. 1).
1402+044 was observed at a central frequency of 385 MHz on the 30th of November and 1st of December 2006, for a total of 1.7 hours. As per previous WSRT observations towards this object (described in Curran et al. 2007b), the relatively wide band of the GBT spectrometer could cover the (385.14 MHz) and (382.55 MHz) candidate sub-DLAs of Turnshek et al. (1989), as well as the DLA (383.07 MHz). At 385 MHz, the GBT spectrometer gives a spectral resolution of 0.30 .
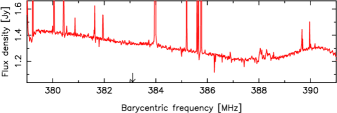
Typically, the system temperatures were K and the removal of RFI dominated scans left a total observing time of 1.4 hours (Fig. 2).
The absorber was observed using the spectral processor, tuned to a central frequency of 408 MHz, on the 6th and 8th of January
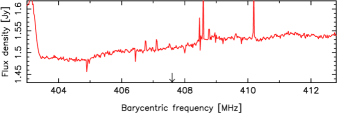
2007 for a total of 7.2 hours, of which 6.1 hours were retained ( K). The channel width was 9.766 kHz, giving a spectral resolution of 7.2 at 408 MHz (Fig. 3).
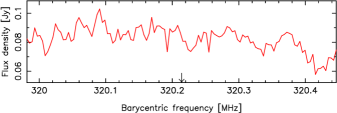
1418–064 was observed using the spectral processor, tuned to a central frequency of 320 MHz, on the 22nd of March 2007 for a total of 2.4 hours, of which 1.9 were retained ( K). As
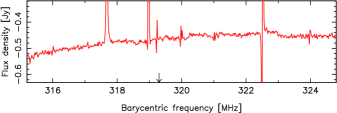
per 0758+475, although the bandpasses were flat, the measured flux density varied considerably between scans not permitting us to determine a value for this (Fig. 4). The spectral resolution was 9.2 at 319 MHz.
2136+141 was observed using the spectral processor, tuned to a central frequency of 454 MHz, on the 5th and 7th of January 2007. Originally, 12 hours were planned to search for 21-cm absorption in the two (admittedly weak, Table 2) absorbers towards this compact
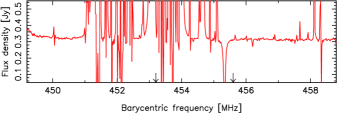
quasar (Table 1), but due to severe RFI over most of this band, we only observed for 2.0 hours (where K). At redshifts of and , the 10 MHz band centered on 454 MHz covered both 455.6 and 453.2 MHz at a resolution of 6.5 , with the RFI dominating 451 to 455 MHz. This allowed us to only obtain a limit for the lower redshift sub-DLA, which itself may not be reliable (Fig. 5).
All of the data were reduced using the gbtidl package. After flagging, both polarisations were combined, linear (1st order) baselines removed and the resulting data Gaussian smoothed, via the gsmooth task, to a resolution of . The results are summarised in Table 2.
2.2 GMRT 2008 observations
2.2.1 Motivation
For the GMRT sample the intent was to find new high redshift “end points” with which to verify the flattening off of at K at (Curran et al., 2007b). To this end, we trawled the Sloan Digital Sky Survey Damped Ly Survey Data Releases 1–3 (Prochaska et al., 2005) for DLAs occulting radio-loud quasars yet to be searched for 21-cm absorption. This yielded two DLAs occulting quasars with flux densities in excess of mJy at 1.4 GHz, J080137.6+472528.2 and J081618.9+482328.4.
2.2.2 Observations and data reduction
For all of the observations, all 30 antennae were used with the 325 MHz receiver, where for an antenna gain of 0.32 Ky Jy-1 we expected to reach an r.m.s. of mJy per channel in each of the two polarisations. For the backend we used a correlator bandwidth of 0.5 MHz, giving a velocity resolution of and a coverage of ().
J0801+472 (which is 0758+475, Sect. 2.1) was observed at a central frequency of 336.366 MHz on the 7th and 8th January 2008. 3C 147 was used for the bandpass calibration and 0834+555 was observed every 0.6 hours to correct for delays. In general, RFI was minimal and the data were excellent with all 30 antennae operating, although pairs involving antennae 13 & 28 were flagged due to poor phase stability. On the first night, the target was observed for a total of 7.54 hours, of which only 0.14 hours required flagging and 350 good baseline pairs were retained. On
the second night, the target was observed for a total of 7.78 hours of which 7.64 hours were kept. Again the data were of high quality, giving 400 good baseline pairs. After analysing each polarisation of each night separately, a combined image was produced using the invert task in miriad. The source was unresolved by the beam.
J0816+4823 was observed at a central frequency of 320.214 MHz for a total of 7.8 hours on 16th March 2008. 3C 48 was used for the bandpass calibration and again the phase calibrator 0834+555 was observed every 0.6 hours during the observation. After flagging the non-operating antennae, 8 & 28, as well as antenna 6, on which the phase stability was poor, RFI appeared minimal and only a little time dependent interference had to be removed (leaving 7.65 hours of data). However, perhaps due to its low flux density, an accurate image of the quasar could not be produced. We therefore flagged noisy antenna pairs until the averaged visibilities gave an r.m.s. noise level close to the mJy expected.
Averaging the remaining baselines in each of the polarisations, gave a similar flux density to extracting this from the cube, i.e. mJy at 0.32 MHz, which compares well with the mJy at 1.4 GHz from the The Very Large Array’s Faint Images of the Radio Sky at Twenty Centimetres (FIRST). Again, the results are summarised in Table 2.
2.3 GBT 2008 observations
2.3.1 Motivation
According to the 21-cm line strength–metallicity correlation ( – [M/H] anti-correlation, Curran et al. 2007b), there are three previously searched DLAs (PKS 0454+039, PKS 0528–250 & [HB89] 0957+561) for which the spin temperature/covering factor ratio should be K, with the previous limits possibly being close to those required to detect 21-cm absorption. We therefore applied for Green Bank Telescope time in order to improve these limits to the point where 21-cm absorption would be detected, although a significant improvement was only managed for 0528–250 (see Sects. 3.1 & 4.2).
2.3.2 Observations and data reduction
As per the 2006 run, we used the GBT Prime Focus Receivers in position switching mode, with the GBT spectrometer split into 32 768 lags over a 12.5 MHz band, giving a channel spacing of 763 Hz, in dual polarisation.
0454+039 was observed for a total of 2.9 hours over several runs from 28th August to 13th September 2008, at a central frequency of 763.8 MHz, giving a spectral resolution of 0.3 . System temperatures ranged from to 40 K over these dates and the overall RFI was minimal, except over the frequency range of interest, 763.6 to 763.8 MHz, where a blooming great spike appeared in most of the spectra. This led to significant flagging, leaving 1.2 hours of
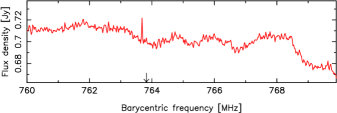
good data, of which the average spectrum is shown in Fig. 8.
0528–250 was observed 2nd and 18th February 2008 for a total of 7.4 hours. At a central frequency of 327.7 MHz, giving a spectral resolution of 0.7 . The system temperature was typically K and RFI was only severe over 0.64 hours of the observations. However, besides this there were intermittent RFI spikes over the whole band, which only
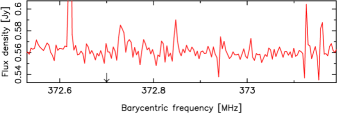
permit r.m.s. estimates over the intervening clean regions. Therefore the limit quoted in Table 2 is for 372.53 to 373.20 MHz (), close to that expected from the redshift of the DLA (Fig. 9).
0957+561A was observed for a total of 3.6 hours over several runs from 7th August to 8th November 2008, at a central frequency of 594 MHz, giving a spectral resolution of 0.4 . System temperatures ranged from to 60 K over these dates and RFI was severe. This led to extensive flagging of bad data, leaving only 14 minutes of “good data”, of which the average spectrum is shown in Fig. 10.
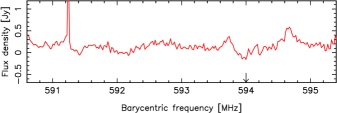
Although this flagging removed all of the spikes close to 594 MHz, a strong ringing was still present in the unsmoothed data and, as seen from the spectrum, no reasonable limit can be obtained from these observations111Note that the unflagged data give a flux density of Jy, although the spectrum is plagued by RFI spikes close to the target frequency..
3 Results
3.1 Observational results
Typically the illumination of the optical (Lyman-) and radio (21-cm) absorbers arise from quite different sources sizes, these being pc for the former, but in excess of 100 pc for the latter222Even over 10 kpc in some cases (see figure 4 of Curran et al. 2005). (Wolfe et al. 2005 and references therein). Thus, it is possible that the optical and radio observations could trace different sight-lines (as is probably the case for 1622+238, Curran et al. 2007a). However, if the 21-cm and Lyman- absorption do arise in the same cloud complexes (Dickey & Lockman, 1990), the column density [] of the absorbing gas in a homogeneous cloud is related to the velocity integrated optical depth, where , of the 21-cm line via (Wolfe & Burbidge, 1975):
| (1) |
where [K] is the mean harmonic spin temperature of the gas, is the depth of the line (or r.m.s. noise in the case of a non-detection) and & the flux density and covering factor of the background continuum source, respectively. In the optically thin regime (), Equ. 1 reduces to , which we apply to the entries in Table 2, where we summarise the results for the three sets of observations.
| QSO | [MHz] | run | [Jy] | [mJy] | Ref. | FWHM | [K] | ||||
|---|---|---|---|---|---|---|---|---|---|---|---|
| 0454+039 | 0.8596 | 763.8 | GBT08 | 0.70 | 3.0 | 20.7 | S95 | 19 | |||
| 0528–250 | 2.811 | 372.7 | GBT08 | 0.561 | 3.0 | 21.3 | L96 | 40 | |||
| J0801+4725∗ | 3.2228 | 336.4 | GBT06 | — | 3.0 | — | 20.7 | P05 | — | — | |
| … | … | … | GMRT | 0.24 | 3.5 | … | … | 20† | |||
| J0816+4823 | 3.4358 | 320.2 | GMRT | 0.08 | 3.7 | 20.8 | P05 | 20† | |||
| 0957+561A | 1.391 | 594.0 | GBT08 | — | — | — | — | 20.3 | T93 | 30 | — |
| 1402+044 | 2.713 | 382.5 | GBT06 | 1.41 | 3.0 | — | T89 | — | — | ||
| … | 2.708 | 383.1 | GBT06 | 1.41 | 3.0 | 20.9 | P04 | 20† | |||
| … | 2.688 | 385.1 | GBT06 | 1.37 | 3.0 | — | T89 | — | — | ||
| … | 2.485 | 407.6 | GBT06 | 1.51 | 7.2 | 20.2 | T89 | 20† | |||
| 1418–064 | 3.449 | 319.3 | GBT06 | 9.2 | 20.4 | E01 | 25 | ||||
| 2136+141 | 2.134 | 453.2 | GBT06 | — | — | — | — | 19.8 | T89 | — | — |
| … | 2.118 | 455.6 | GBT06 | 0.320 | 6.4 | 19.8 | T89 | 20† |
Notes: ∗0758+475 – observed with both the GBT and GMRT (Sects. 2.1 & 2.2). †No Mg ii equivalent width or metallicities found, so assumed. aOver 372.53 to 373.20 MHz (). bDouble the sensitivity reached with the WSRT observations (Curran et al., 2007b), so we adopt this limit. cSubject to an RFI spike from 385.17 to 385.23 MHz (). dFlux density could not be determined from our observations and so have adopted value for TXS 1418–064 at 0.374 Jy (Douglas et al., 1996), although this is from PKS B1418-064 (for which Jy & Jy) it is within the Texas survey beam.
For our and the previous non-detections we have no knowledge of what the FWHM of the 21-cm profile should be, thus hampering the determination of a lower limit for . Previously (Curran et al., 2005, 2007b), we have used the mean of the detections to derive velocity integrated optical depth limits for the non-detections. An alternative to this is to estimate the FWHMs from the spin temperature, via the kinetic temperature according to (e.g. Kanekar & Chengalur 2003), although in the absence of detailed knowledge of the covering factor, it is impossible to assign a specific spin temperature to any of the DLAs. In light of the findings of Curran et al. (2007b), however, we can make educated guesses to the profile widths according to the FWHM– Mg ii rest-frame equivalent width correlation for the detections. This gives FWHM (figure 6 of Curran et al. 2007b), and, where the Mg ii equivalent widths are not available (generally at ), we estimate these from the metallicity via (figure 7 of Curran et al. 2007b, see also Murphy et al. 2007)333Applying the above conversions gives a range of for the non-detections, thus not drastically changing the values of , shown in the following figures, from those using a FWHM of 20 .. Note that, although Gupta et al. (2009); Kanekar et al. (2009b) find that the FWHM– correlation does not generally hold for Mg ii absorption systems, when only those which are likely to be DLAs (i.e. with an Mg i 2852 Å equivalent width of Å, Rao et al. 2006) are added to the sample, the correlation is still found to hold for all suspected DLAs (Curran, 2009).
Commenting on our observational results, due to the effects of RFI and weak radio fluxes, we cannot assign limits to four of the absorbers and the limits for a further three are so poor as to be of little use. Of the remaining five, for 0454+039 we have matched the previous limit of K (Briggs & Wolfe, 1983), while for 0528–250 we have significantly improved upon the K limit of Carilli et al. (1996)444Based upon our 3 resolution and 40 line-width (Table 2).. This is the first search for 21-cm absorption at towards J0801+4725, although, due to the relatively low flux density, the limit is only K.555For this and the other GMRT target, J0816+4823, it is possible that the redshift coverage of is not sufficient to cover uncertainties in the absorber redshift, which are determined from the Lyman- line (Prochaska et al., 2005). However, J0801+4725 has been searched over with the GBT (Fig. 1) and the J0816+4823 limit is too poor in any case to contribute to the analysis. For the DLA towards 1402+044, we have improved the previous limit (Curran et al., 2007b) by a factor of two and for the sub-DLA, publish the first limit, although this is weak due to the low neutral hydrogen column density.
3.2 Update of the previous results
Adding the new results and applying the estimated FWHMs, in Fig. 11 we update the spin temperature/covering factor–absorption redshift distribution of Curran et al. (2005).
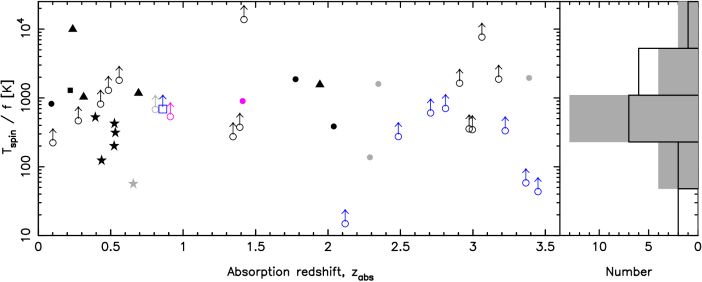
From the histogram it is seen that the low redshift absorbers have a similar distribution to those at high redshift () and in Table 3 we present the results of the statistical tests performed on the low and high redshift samples.
| Sample size, | 19 | 20 | 23 | 18 | 25 | 16 |
|---|---|---|---|---|---|---|
| Mean, | ||||||
| 0.0718 | 0.265 | 0.203 | ||||
| 0.443 | 0.448 | 0.358 | ||||
These were done for redshift cuts of , (the turnover in angular diameter distance, Sect. 4.1.1) and (as Kanekar & Chengalur 2003). From these, we find slightly lower mean values of for the low redshift absorbers, with log-rank and Kolmogorov-Smirnov tests indicating that there is little significance in the differences between the low and high redshift samples. Bear in mind, however, that the FWHMs for the non-detections have been estimated (Sect. 3.1), with some of these relying on a secondary correlation (FWHM ), when the Mg ii equivalent width is not available666Setting the FWHMs obtained from the metallicity to 20 , however, alters only the averages in Table 3, and these only slightly. Overall, there is very little change with & and & , respectively.. Furthermore, the Kolmogorov-Smirnov test treats the upper limits as actual values and higher sensitivity limits at high redshift are required in order to confirm the similarities between the samples apparent in Table 3.
Performing a Kolmogorov-Smirnov test on the redshift distributions between the detections and non-detections, thus requiring no assumptions, gives an 11% probability (significant at ) that these are drawn from the same sample. Additionally, the non-detections have a higher mean redshift – (), compared to () for the detections. Therefore, we cannot rule out that the distribution differs between the two redshift regimes. Although the relative contributions of and are unknown, the fact that the largest differences are seen for (where K cf. K) is consistent with geometry effects giving larger values of at (Curran & Webb 2006 and Sect. 4.1.1).
While we are discussing statistical trends over the whole sample, it should be emphasised that the 21-cm absorption searches yield a very heterogeneous sample, with each survey having different selection criteria (including the three here), resulting in a mix of detections and non-detections across various absorber morphologies (where these are known, Fig. 11). However, presuming that the optical and radio absorption clouds are coincident, Equ. 1 accounts for differences in the neutral hydrogen column densities and the flux densities of the background sources (discussed in detail in Curran et al. 2005), leaving only the degeneracy. Naturally, various properties of the absorber and emitter, as well as the distance between them, could influence this ratio, issues which we discuss here. However, whether it be due to similar values of and for all of the absorbers, or just the ratio being maintained, there may be no large differences between the low and high redshift samples. Furthermore, since , the ordinate in Fig. 11 represents the maximum possible spin temperatures for the detections of which there are now several at . This indicates that high redshifts do not necessarily entail high spin temperatures, as advocated by Kanekar & Chengalur (2003) [although a larger fraction of warm gas (Kanekar et al., 2009a) does not exclude the possibility of cold clumps]. Case in points against exclusively high spin temperatures at high redshift are,
Lastly, Curran et al. (2005) also noted a correlation between the integrated 21-cm optical depth and the H i column density.
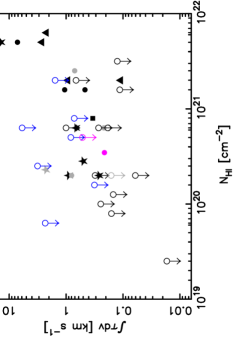
Updating this for the DLAs (Fig. 12) and incorporating the upper limits (as above), there is a probability of that the correlation occurs by chance. This corresponds to a significance, and since the gradient is , suggests that, on the whole, the ratio of spin temperature to covering factor is a constant for DLAs, although there is some considerable scatter.
4 Discussion
4.1 Covering factors
4.1.1 Angular diameter distances and other effects
As mentioned in Sect. 2.1, Curran et al. (2005) suggested that, contrary to the high redshift equals high spin temperature argument of Kanekar & Chengalur (2003), 21-cm absorption should be readily detectable at high redshift towards compact radio sources, where the covering factor is maximised. At the time of writing up the results presented in Curran & Webb (2006), this was confirmed by the detection of 21-cm absorption in the highest redshift example to date, at towards 0438–436 (Kanekar et al. 2006), which has a background radio source size of only at 5 GHz (Tingay et al., 1998). Following this, since submitting the proposal for the 2006 GBT observations, 21-cm absorption has been confirmed at yet higher redshift, towards 0201+113 (Kanekar et al. 2007, see also de Bruyn et al. 1996; Briggs et al. 1997), as well as at towards 0311+430 (York et al., 2007). Again, both of these occult compact radio sources of at 1.4 GHz (Stanghellini et al., 1990)777Kanekar et al. (2007) report a de-convolved source size of mas2 at 328 MHz. and , respectively. The latter was noted by York et al. (2007) to be unusual in its low spin temperature of K at such a high redshift, although this is not unusual in regard to the finding of Curran et al. (2005); Curran & Webb (2006).
From Table 1 we see that five of our targets are towards radio source sizes of (recently found to be for 0454+039 and for 0528–250, Kanekar et al. 2009a), although we have only meaningful limits for three of these (0454+039, 0528–250 & 0758+475 – Table 2). However, all of the GBT 2006 targets (Sect. 2.1) were selected before the arguments of Curran & Webb (2006) were formulated, and so all of the 2006 targets (and two of the three just mentioned), are all at high redshift, and will therefore be disadvantaged with respect to the DLA-to-QSO angular diameter distance ratios.
Showing these in Fig. 13 (top), we see that all but one of our target DLAs (for which we have limits), are indeed at angular diameter distance ratios of , due to their high redshift selection. For a given absorber and radio source size, this will disadvantage the effective covering factor (possibly giving the observed , Sect. 3.2), although, as mentioned above, the three new high redshift detections occult compact radio sources, as shown in the bottom panel of Fig. 13, where we use the source sizes compiled in Curran et al. (2005) updated with those given in Kanekar et al. (2009a)888Many of the source sizes are measured at (VLBI) frequencies, which are often many times higher than that of the redshifted 21-cm line (see table 2 of Curran et al. 2005), and so in Fig. 13 (bottom) we have flagged each of the DLAs according to how many times larger than the frequency at which the source size is measured, i.e. . The recently published low frequency VLBA imaging of Kanekar et al. (2009a) accounts for many of the “green” values, where . Since a number of these sources appear resolved, we have recalculated the extents, rather than using the deconvolved sizes quoted in Kanekar et al. (2009a), which are often smaller than the beam and may be unphysical (e.g. pc for 0405–331).. However, all of our non-detections (which are predominately at ), also occult similar radio source sizes. Of these, three of the sizes are not as reliable (orange symbols where , cf. green where ), although as seen from Fig. 11, only three published non-detections are sufficiently sensitive to detect K at (Sect. 2.2).
While, due to geometry effects, a high angular diameter distance will disadvantage the absorption cross-section in comparison to the same absorber placed at a low angular diameter distance, with the 21-cm searches spanning a look-back time range of 12 Gyr there are also evolutionary effects to be considered. For instance, an evolution in the morphologies of the absorbing galaxies is expected to result in different metallicities and these heavy elements can provide cooling pathways for the diffuse gas (Dalgarno & McCray 1972). Furthermore, it is shown that the relative mix of the cold neutral medium (CNM, where K and ) and the warm neutral medium (WNM, K and ) can be affected by the metallicity (Wolfire et al., 1995).
At low redshifts, where the DLA hosts can be imaged directly, the absorbing galaxies appear to be a mix of spirals, dwarf and LSBs (e.g. Le Brun et al. 1997; Rao et al. 2003; Chen & Lanzetta 2003) and, in general, large galaxies appear to be more populous at low redshift with smaller morphologies becoming more common at high redshifts (Baker et al., 2000; Lanfranchi & Friaça, 2003). Therefore, in the more compact absorbing galaxies, where the metallicities are lower than in the larger spirals (see Sect. 4.2), we may expect the gas to be more dominated by the WNM and, as shown by Curran et al. (2007b), is anti-correlated with the metallicity (see Sect. 4.2). However, although the metallicity is itself anti-correlated with the look-back time (Prochaska et al. 2003; Rao et al. 2005), no [M/H]– correlation is seen for the 21-cm searched sample (Curran et al., 2007b), and, as seen in Fig. 13, very few morphologies are known for these at . Furthermore, the – [M/H] anti-correlation is consistent with either the spin temperature being lower or the covering factor being larger at high metallicities, with the larger galaxies likely to have high values of as well as [M/H]. Although the degeneracy is unbreakable, it is possible that both factors contribute and that the values of [M/H], and are in fact interwoven (Curran et al., 2007b).
In addition to decreasing metallicities, the increase in the background ultra-violet flux will increase the ionisation fraction of the gas (Bajtlik et al., 1988), in addition to raising its spin temperature (Field, 1959; Bahcall & Ekers, 1969), an effect also seen in associated systems, where 21-cm absorption has never yet been detected in the host galaxy of a quasar with W Hz-1 (Curran et al., 2008). Therefore, as well as always having large angular diameter distance ratios and lower metallicities, high redshift absorption systems will generally be subject to higher ultra-violet fluxes, although for intervening absorbers the effect will not be as severe as for associated absorbers. Nevertheless, this could be the cause of many of the lower limits at (Fig. 11), although, again, such heated gas could have a significantly lower 21-cm absorption cross-section as well as a higher temperature.
4.1.2 Absorber extents
In order to consider the radio source size in conjunction with the ratio of the angular diameter distances, we calculate the extent of absorber required to fully cover the radio source (Fig. 14) and show this against the normalised line
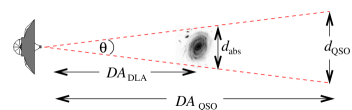
strength, (Fig. 15).
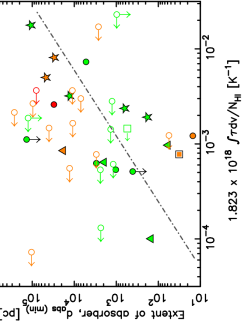
From this we see a correlation between the extent of the absorber and the 21-cm absorption strength for the detections. For the 18 detections this is significant at , falling to for the 12 detections with (“green”), with the non-detections exhibiting no correlation whatsoever (bringing the significance for the whole 39 strong sample down to )999Using the deconvolved values of Kanekar et al. (2009a), rather than those measured (see footnote 8), gives & , respectively..
The fit in Fig. 15 suggests that the non-detections which have been searched sufficiently deeply, (i.e. neglecting the two with ), may require large absorbers ( kpc scales) in order to achieve effective covering factors. As is seen from the figure, several detections also occupy this regime, although these tend to be spiral galaxies. Therefore, like Kanekar & Chengalur (2003), and as discussed in Curran et al. (2005), the majority of non-detections (which are at high redshift and have unknown morphologies) may be non-spirals. Although, unlike Kanekar & Chengalur (2003), we again suggest that may be their small sizes, in addition to/rather than high mean spin temperatures, which may be responsible for their weak line strengths.
The covering factor can be defined101010It can also be estimated as the ratio of the compact unresolved component’s flux to the total radio flux (Briggs & Wolfe, 1983; Kanekar et al., 2009a). However, even if high resolution radio images at the redshifted 21-cm frequencies are available, this method gives no information on the extent of the absorber (or how well it covers the emission). Furthermore, the high angular resolution images are of the continuum only and so do not give any information about the depth of the line when the extended continuum emission is resolved out. as (Curran & Webb, 2006), meaning that, in general111111That is, where is the actual extent of the absorber, rather than the extent minimum required to cover ., the ordinate in Fig. 15 is equivalent to . This therefore suggests, at least for the detections, that the line strength increases with the size of the 21-cm absorption region, a trend which is apparent, even when the absorber size is weighed down by the factor. and, in general, from the normalised line strength,
| (2) |
That is, , which makes sense in terms of both covering factor and spin temperature – a larger absorber implies a larger covering factor, as well as the possibility of a lower spin temperature. Presuming that this is not dominated by the numerator, this could suggest that the larger absorbing galaxies are subject to lower spin temperatures (Kanekar & Chengalur 2003 and references therein). However, one interpretation of the distribution of the non-detections along the ordinate in Fig. 15 is that for a given absorption cross-section (i.e. assuming the same for all the DLAs), the covering factor is generally lower than for a number of the detections.
Note that, in addition to geometry effects, it is possible that these lower covering factors could also be caused by lower beam filling factors, introduced by structure (“clumpiness”) in the absorbing gas, which may be behind the 21-cm variability seen at towards 1127–145 (Kanekar & Chengalur, 2001) and at towards 0201+113 (de Bruyn et al., 1996; Briggs et al., 1997; Kanekar et al., 2007). Gupta et al. (2009) also note from their large survey of Mg ii absorption systems that the decreasing number density of 21-cm absorbers with redshift runs counter to that of the Lyman- and Å Mg ii absorbers (Rao et al., 2006). This is attributed to a significant evolution in either the CNM filling factor or the covering factor, the former of which could be the result of a relatively extensive WNM, thus indicating a higher mean harmonic spin temperature (Kanekar et al., 2009a), although the larger fractions of warm gas would not exclude the presence of cold clumps. Either or both of these scenarios would be tied up in the degeneracy. Nevertheless, 21-cm detection rates are significantly lower at high redshift and the filling factor of the CNM, through either its effect on or , could be a major contributor to this.
4.2 21-cm line strength–metallicity correlation
Addressing the 21-cm line strength–metallicity correlation ( – [M/H] anti-correlation) of Curran et al. (2007b), the focus of the 2008 GBT observations (Sect. 2.3), it appears that we should have detected absorption in at least one of the two DLAs for which reasonable sensitivities were reached (Fig. 16).
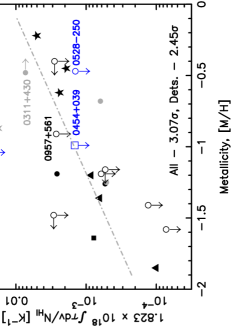
Regarding the best improved limit121212By a factor of , cf. Carilli et al. 1996. See footnote 4., 21-cm absorption may not have been detected towards 0528–250, on the grounds that, with an absorption redshift very close to that of the emission redshift (both at , Möller et al. 2004 and references therein), the absorber is possibly located in the host of the background quasar. We may therefore expect the neutral gas to be subject to excitation effects seen in other high redshift 21-cm absorption searches (Curran et al., 2008). However, the presence of H2 in the absorber suggests that the gas is relatively cool with K (Srianand et al. 2005) and so this is unlikely.
In any case, referring to Fig. 16, the limit is not overly low in comparison to 0438–436 (the detection at [M/H], [K-1]) and there is also the possibility that we have missed the line, with our limit only being good over the redshift range (Sect. 2.3). Assuming this limit is reliable and including 0311+430, strengthens the correlation (cf. Curran et al. 2007b).
York et al. (2007) comment that the absorber towards 0311+430 has an unusually high metallicity, although according to Fig. 16, this has some leeway before the metallicity becomes atypically high. From its grouping in the line strength–metallicity plot, we suggest that the absorption is due to a spiral galaxy, as do York et al. (2007) on the basis of its low “spin temperature”. Support for this assertion is given by its grouping with the spirals in Fig. 15 (the “unknown” at K-1, 5 kpc), although this is on the grounds of a large absorption cross-section, rather than the spin temperature.
5 Summary
Through three sets of separate observations, we have undertaken a survey for 21-cm absorption in a total of twelve DLAs and sub-DLAs. Due to RFI and low neutral hydrogen column densities, useful sensitivities were obtained for five of the sample, none of which resulted in a detection. We add these to the recent results from other surveys, which while forming a very heterogeneous sample, suggest that, at least statistically:
-
1.
There appears to be no large difference in the spin temperature/covering factor ratio between the low and high redshift DLAs (Fig. 11 and Table 3), although the non-detections do have a higher mean redshift and more sensitive observations of these would be required to fully address this. Nevertheless, the fact that the mean difference is largest for a redshift partition of is consistent with the geometry effects noted by Curran & Webb (2006). Other factors, such as increasing WNM fractions (increasing ) or an evolution in morphologies (also decreasing ) with redshift cannot be ruled out, although the degeneracy cannot be broken.
- 2.
-
3.
By combining the radio source sizes with the angular diameter distances to the DLAs, we show that the absorber extent normalised by the covering factor () is correlated with the line-strength for the detections, with the non-detections generally exhibiting larger values of (Fig. 15). A possible interpretation is that the non-detections require larger minimum absorber extents in order to be detected. This may also be interpreted as the covering factors being lower than for the detections.
This argument relies on the assumption that the unknown morphologies of the non-detections are not those of spiral galaxies. This is consistent with both the hypotheses of Kanekar & Chengalur (2003) and Curran et al. (2005), in that spiral galaxies may have lower spin temperatures or larger covering factors than the other morphologies, respectively. The constancy of between the detections and non-detections (point ii, above) may suggest that both contribute, with lower covering factors being balanced by lower spin temperatures. The absorber extent–line strength correlation further suggests that for the detections. Although, once again, we are limited by the spin temperature/covering factor degeneracy, we do believe that the large scatter in this ( K) is mainly dominated, or at least balanced, by different covering factors: This represents a vast range of spin temperatures (specifically, K suggested by Kanekar & Chengalur 2003). Although having a much smaller dynamic range than the spin temperature, the covering factor is subject to three separate effects – the extent of the absorbing region, the size and morphology of the background 1.4 GHz emitter, as well as the effects introduced by the geometry of a flat expanding Universe. Furthermore, the beam filling of the cold neutral medium in these absorbers could have a significant effect on both the covering factor and the spin temperature.
-
4.
We agree with the suspicions of York et al. (2007) that the absorber towards 0311+430 arises within a spiral galaxy. Although not on the basis of its low spin temperature (which we do not find unusual at these redshifts), but on its absorption cross-section and its grouping with the other spirals on a line-strength–metallicity plot.
Acknowledgments
We would like to thank the anonymous referee for their prompt and helpful comments, Ishwara Chandra for his assistance with the GMRT observations and Jayaram Chengalur for his perseverance in getting the data to us in a format which miriad could handle. Thanks also to Nadia Lo for her idl expertise, which assisted greatly with the GBT data reduction and to Warren Trotman (wherever he may be) for the figure of the little telescope (in Fig. 14), which SJC has used since our Masters write-up days at Jodrell Bank.
This research has made use of the NASA/IPAC Extragalactic Database (NED) which is operated by the Jet Propulsion Laboratory, California Institute of Technology, under contract with the National Aeronautics and Space Administration. This research has also made use of NASA’s Astrophysics Data System Bibliographic Service and asurv Rev 1.2 (Lavalley et al., 1992), which implements the methods presented in Isobe et al. (1986).
MTM thanks the Australian Research Council for a QEII Research Fellowship (DP0877998).
References
- Bahcall & Ekers (1969) Bahcall J. N., Ekers R. D., 1969, ApJ, 157, 1055
- Bajtlik et al. (1988) Bajtlik S., Duncan R. C., Ostriker J. P., 1988, ApJ, 327, 570
- Baker et al. (2000) Baker A. C., Mathlin G. P., Churches D. K., Edmunds M. G., 2000, in Favata F., Kaas A., Wilson A., eds, Star Formation from the Small to the Large Scale, Vol.45 of ESA SP The Chemical Evolution of the Universe. Noordwijk, p. 21
- Beasley et al. (2002) Beasley A. J., Gordon D., Peck A. B., Petrov L., MacMillan D. S., Fomalont E. B., Ma C., 2002, ApJS, 141, 13
- Briggs et al. (1997) Briggs F. H., Brinks E., Wolfe A. M., 1997, AJ, 113, 467
- Briggs & Wolfe (1983) Briggs F. H., Wolfe A. M., 1983, ApJ, 268, 76
- Carilli et al. (1996) Carilli C. L., Lane W., de Bruyn A. G., Braun R., Miley G. K., 1996, AJ, 111, 1830
- Chen & Lanzetta (2003) Chen H.-W., Lanzetta K. M., 2003, ApJ, 597, 706
- Curran (2009) Curran S. J., 2009, MNRAS, Submitted (arXiv:0910.3998)
- Curran et al. (2005) Curran S. J., Murphy M. T., Pihlström Y. M., Webb J. K., Purcell C. R., 2005, MNRAS, 356, 1509
- Curran et al. (2007a) Curran S. J., Tzanavaris P., Murphy M. T., Webb J. K., Pihlström Y. M., 2007a, MNRAS, 381, L6
- Curran et al. (2007b) Curran S. J., Tzanavaris P., Pihlström Y. M., Webb J. K., 2007b, MNRAS, 382, 1331
- Curran & Webb (2006) Curran S. J., Webb J. K., 2006, MNRAS, 371, 356
- Curran et al. (2002) Curran S. J., Webb J. K., Murphy M. T., Bandiera R., Corbelli E., Flambaum V. V., 2002, PASA, 19, 455
- Curran et al. (2004) Curran S. J., Webb J. K., Murphy M. T., Carswell R. F., 2004, MNRAS, 351, L24
- Curran et al. (2008) Curran S. J., Whiting M. T., Wiklind T., Webb J. K., Murphy M. T., Purcell C. R., 2008, MNRAS, 391, 765
- Dalgarno & McCray (1972) Dalgarno A., McCray R. A., 1972, Ann. Rev. Astr. Ap., 10, 375
- de Bruyn et al. (1996) de Bruyn A. G., O’Dea C. P., Baum S. A., 1996, A&A, 305, 450
- Dickey & Lockman (1990) Dickey J. M., Lockman F. J., 1990, ARA&A, 28, 215
- Douglas et al. (1996) Douglas J. N., Bash F. N., Bozyan F. A., Torrence G. W., Wolfe C., 1996, AJ, 111, 1945
- Ellison et al. (2001) Ellison S. L., Yan L., Hook I. M., Pettini M., Wall J. V., Shaver P., 2001, A&A, 379, 393
- Field (1959) Field G. B., 1959, ApJ, 129, 536
- Fomalont et al. (2000) Fomalont E. B., Frey S., Paragi Z., Gurvits L. I., Scott W. K., Taylor A. R., Edwards P. G., Hirabayashi H., 2000, ApJS, 131, 95
- Gupta et al. (2009) Gupta N., Srianand R., Petitjean P., Noterdaeme P., Saikia D. J., 2009, MNRAS, 398, 201
- Gurvits et al. (1999) Gurvits L. I., Kellermann K. I., Frey S., 1999, A&A, 342, 378
- Harvanek et al. (1997) Harvanek M., Stocke J. T., Morse J. A., Rhee G., 1997, AJ, 114, 2240
- Isobe et al. (1986) Isobe T., Feigelson E., Nelson P., 1986, ApJ, 306, 490
- Jorgenson et al. (2009) Jorgenson R. A., Wolfe A. M., Prochaska J. X., Carswell R. F., 2009, ApJ, 704, 247
- Kanekar & Chengalur (2001) Kanekar N., Chengalur J. N., 2001, MNRAS, 325, 631
- Kanekar & Chengalur (2003) Kanekar N., Chengalur J. N., 2003, A&A, 399, 857
- Kanekar et al. (2007) Kanekar N., Chengalur J. N., Lane W. M., 2007, MNRAS, 375, 1528
- Kanekar et al. (2009a) Kanekar N., Lane W. M., Momjian E., Briggs F. H., Chengalur J. N., 2009a, MNRAS, 394, L61
- Kanekar et al. (2009b) Kanekar N., Prochaska J. X., Ellison S. L., Chengalur J. N., 2009b, MNRAS, 396, 385
- Kanekar et al. (2006) Kanekar N., Subrahmanyan R., Ellison S. L., Lane W., Chengalur J. N., 2006, MNRAS, 370, L46
- Lanfranchi & Friaça (2003) Lanfranchi G. A., Friaça A. C. S., 2003, MNRAS, 343, 481
- Lavalley et al. (1992) Lavalley M. P., Isobe T., Feigelson E. D., 1992, in BAAS Vol. 24, ASURV, Pennsylvania State University. Report for the period Jan 1990 - Feb 1992, pp 839–840
- Le Brun et al. (1997) Le Brun V., Bergeron J., Boissé P., Deharveng J. M., 1997, A&A, 321, 733
- Lu et al. (1996) Lu L., Sargent W. L. W., Barlow T. A., Churchill C. W., Vogt S. S., 1996, ApJS, 107, 475
- Möller et al. (2004) Möller P., Fynbo J. P. U., Fall S. M., 2004, A&A, 422, L33
- Murphy et al. (2004) Murphy M. T., Curran S. J., Webb J. K., 2004, in Duc P.-A., Braine J., Brinks E., eds, Recycling Intergalactic and Interstellar Matter, IAU Symposium No. 217 H2-bearing damped lyman- systems as tracers of cosmological chemical evolution. ASP Conf. Ser., San Francisco, p. 252
- Murphy et al. (2007) Murphy M. T., Curran S. J., Webb J. K., Ménager H., Zych B. J., 2007, MNRAS, 376, 673
- Noterdaeme et al. (2008) Noterdaeme P., Ledoux C., Petitjean P., Srianand R., 2008, A&A, 481, 327
- Prochaska et al. (2003) Prochaska J. X., Gawiser E., Wolfe A. M., Castro S., Djorgovski S. G., 2003, ApJ, 595, L9
- Prochaska & Herbert-Fort (2004) Prochaska J. X., Herbert-Fort S., 2004, PASP, 116, 622
- Prochaska et al. (2005) Prochaska J. X., Herbert-Fort S., Wolfe A. M., 2005, ApJ, 635, 123
- Rao et al. (2003) Rao S., Nestor D. B., Turnshek D., Lane W. M., Monier E. M., Bergeron J., 2003, ApJ, 595, 94
- Rao et al. (2006) Rao S., Turnshek D., Nestor D. B., 2006, ApJ, 636, 610
- Rao et al. (2005) Rao S. M., Prochaska J. X., Howk J. C., Wolfe A. M., 2005, AJ, 129, 9
- Srianand et al. (2005) Srianand R., Petitjean P., Ledoux C., Ferland G., Shaw G., 2005, MNRAS, 362, 549
- Stanghellini et al. (1990) Stanghellini C., Baum S. A., O’Dea C. P., Morris G. B., 1990, A&A, 233, 379
- Steidel et al. (1995) Steidel C. C., Bowen D. V., Blades J. C., Dickenson M., 1995, ApJ, 440, L45
- Tingay et al. (1998) Tingay S. J., Murphy D. W., Lovell J. E. J., et al., 1998, ApJ, 497, 594
- Turnshek & Bohlin (1993) Turnshek D. A., Bohlin R. C., 1993, ApJ, 407, 60
- Turnshek et al. (1989) Turnshek D. A., Wolfe A. M., Lanzetta K. M., Briggs F. H., Cohen R. D., Foltz C. B., Smith H. E., Wilkes B. J., 1989, ApJ, 344, 567
- Wolfe & Burbidge (1975) Wolfe A. M., Burbidge G. R., 1975, ApJ, 200, 548
- Wolfe et al. (2005) Wolfe A. M., Gawiser E., Prochaska J. X., 2005, ARA&A, 43, 861
- Wolfire et al. (1995) Wolfire M. G., Hollenbach D., McKee C. F., Tielens A. G. G. M., Bakes E. L. O., 1995, ApJ, 443, 152
- York et al. (2007) York B. A., Kanekar N., Ellison S. L., Pettini M., 2007, MNRAS, 382, L53