Flux dynamics and vortex phase diagram in Ba(Fe1-xCoAs2 single crystals revealed by magnetization and its relaxation
Abstract
Magnetization and its relaxation have been measured in Ba(Fe1-xCoAs2 single crystals at various doping levels ranging from very underdoped to very overdoped regimes. Sizable magnetization relaxation rate has been observed in all samples, indicating a moderate vortex motion and relatively small characteristic pinning energy. Detailed analysis leads to the following conclusions: (1) A prominent second-peak (SP) effect was observed in the samples around the optimal doping level ( 0.08), but it becomes invisible or very weak in the very underdoped and overdoped samples; (2) The magnetization relaxation rate is inversely related to the transient superconducting current density revealing the non-monotonic field and temperature dependence through the SP region; (3) A very sharp magnetization peak was observed near zero field which corresponds to a much reduced relaxation rate; (4) A weak temperature dependence of relaxation rate or a plateau was found in the intermediate temperature region. Together with the treatment of the Generalized-Inversion-Scheme, we suggest that the vortex dynamics is describable by the collective pinning model. Finally, vortex phase diagrams were drawn for all the samples showing a systematic evolution of vortex dynamics.
pacs:
74.25.Qt, 74.25.Ha, 74.70.DdI Introduction
Since the discovery of superconductivity at = 26 KKamihara in LaFeAsO1-xFx, the iron-based layered superconductors have exposed an interesting research area to the community of condensed matter physics. This breakthrough was followed by the realization of superconductivity at temperatures at as high as 56-57 K in Ca1-xREFeAsF (fluorine derivative 1111 system with RE = Nd, Sm, etc.).ChengPEPL2009 A lot of experimental and theoretical works on the physical properties have been carried out. For the FeAs-1111 phase, it is very difficult to grow crystals with large sizes, therefore most of the measurements so far were made on polycrystalline samples. This is much improved in the (Ba,Sr)1-xKxFe2As2 and (Ba,Sr)(Fe1-xCoAs2 (denoted as FeAs-122) system since sizable single crystals can be produced.Johrendt122 Specific heat, lower critical field, microwave measurements suggest that these superconductors exhibit multiband feature HunteF ; RenC ; Machida1 . Measurements under high magnetic fields reveal that the iron-based superconductors have very high upper critical fields,HunteF ; Senatore ; JiaY which indicate encouraging potential applications. Preliminary experimental results also indicate that the vortex dynamics in iron pnictide may be understood with the model of thermally activated flux motion within the scheme of collective vortex pinning.YangHPRB ; YangHAPL ; ProzorovPRB ; ProzorovPhysicaC A second-peak (SP) effect has been observed in Ba1-xKxFe2As2YangHAPL and Ba(Fe1-xCoAs2 single crystals.ProzorovPRB ; Prozorovarxiv ; Y. Machida ; HARDY V Moreover this system has a layered structure with the conducting FeAs layers being responsible for the superconductivity, which behaves in a similar way as the case of cuprates. For cuprate superconductors, due to the high anisotropy, short coherence length, and high operation temperature, the vortex motion and fluctuation are quite strong.Blatter This leads to a small characteristic pinning energy, and the single vortex or vortex bundles are pinned collectively by many small pinning centers. Therefore it is curious to know whether the vortex properties and phase diagram of the cuprate and FeAs-based superconductors are similar to each other or not.Y.Yeshurun ; Brandt ; Beek In this paper, we report an intensive study on the vortex dynamics of Ba(Fe1-xCoAs2 single crystalline samples ranging from very underdoped to very overdoped regime.
II Experiment
The single crystals with high quality measured in this paper were prepared by the self-flux method.LFang Samples with six different doping concentrations ( = 0.06, 0.07, 0.08, 0.1, 0.12, 0.15) with typical dimensions of mm3 have been used for both magnetic and resistive measurements. The measurements were carried out on a physical property measurement system (PPMS, Quantum Design) with the magnetic field up to 9 T. During the measurements, the magnetic field H is always parallel to c-axis of single crystals. The temperature stabilization of the measuring system is better than K. The magnetic properties were measured by the sensitive vibrating sample magnetometer at the vibrating frequency of 40 Hz with the resolution better than emu. The magnetic field sweeping rate can be varied from 0.5 Oe/s to 627 Oe/s, for most of the measurements of dynamical magnetization relaxation measurements (defined below) we adopted the sweeping rate of 50 Oe/s and 200 Oe/s, which were much enough for us to resolve the difference of magnetization. The advantage of this technique is that the speed of data acquisition is very fast with a quite good resolution for magnetization.
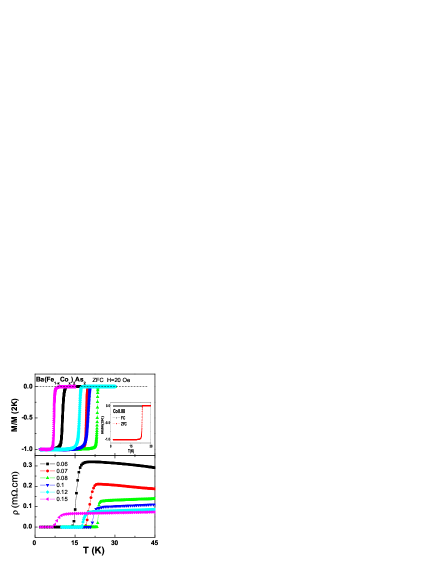
In Fig.1 we show the temperature dependence of the diamagnetic moment and resistive transitions of the six doped samples. The superconducting transition temperature is found to shift systematically with doping, revealing a dome-like doping dependence (shown later in Fig.20). The sample with nominal composition = 0.08 was found to be optimally doped with the highest onset transition temperature . In the underdoped region (), an upturn in the resistivity curve above can be easily seen, which was supposed to be related to the structural and antiferromagnetic (AF) transition. The large difference between zero field cooling (ZFC) and field cooling (FC) magnetization (shown in inset of Fig.1) indicates a strong magnetization hysteresis in the sample. The perfect diamagnetism in the low temperature region and sharp transitions observed from the ZFC curves indicate the high quality of our samples.
To investigate the vortex dynamics, in this work we adopt the so-called dynamical relaxation method.Jirsa ; WenPhysicaC1995 ; WenPRB1995 Dynamic magnetization-relaxation measurements were carried out in the following way: The sample is cooled down to a chosen temperature in ZFC mode and then we sweep the magnetic field and measure the magnetic moment by following the routes: with different field sweeping rates dd. The corresponding magnetization-relaxation rate is defined as
| (1) |
where is the transient superconducting current density, is the field sweep rate. Comparing to the conventional magnetization-relaxation measurement (fixing the magnetic field and measuring the time dependence of magnetization), this dynamical relaxation method can overcome the following drawbacks: (1) For the samples with a large demagnetization factor, a slight overshoot of the field (even lower than 1 mT) can modify the current distribution dramatically;(2) A long waiting time is necessary before meaningful relaxation data points can be recorded; (3) To get the valid relaxation data, we need to measure the magnetization relaxation in a long time period.
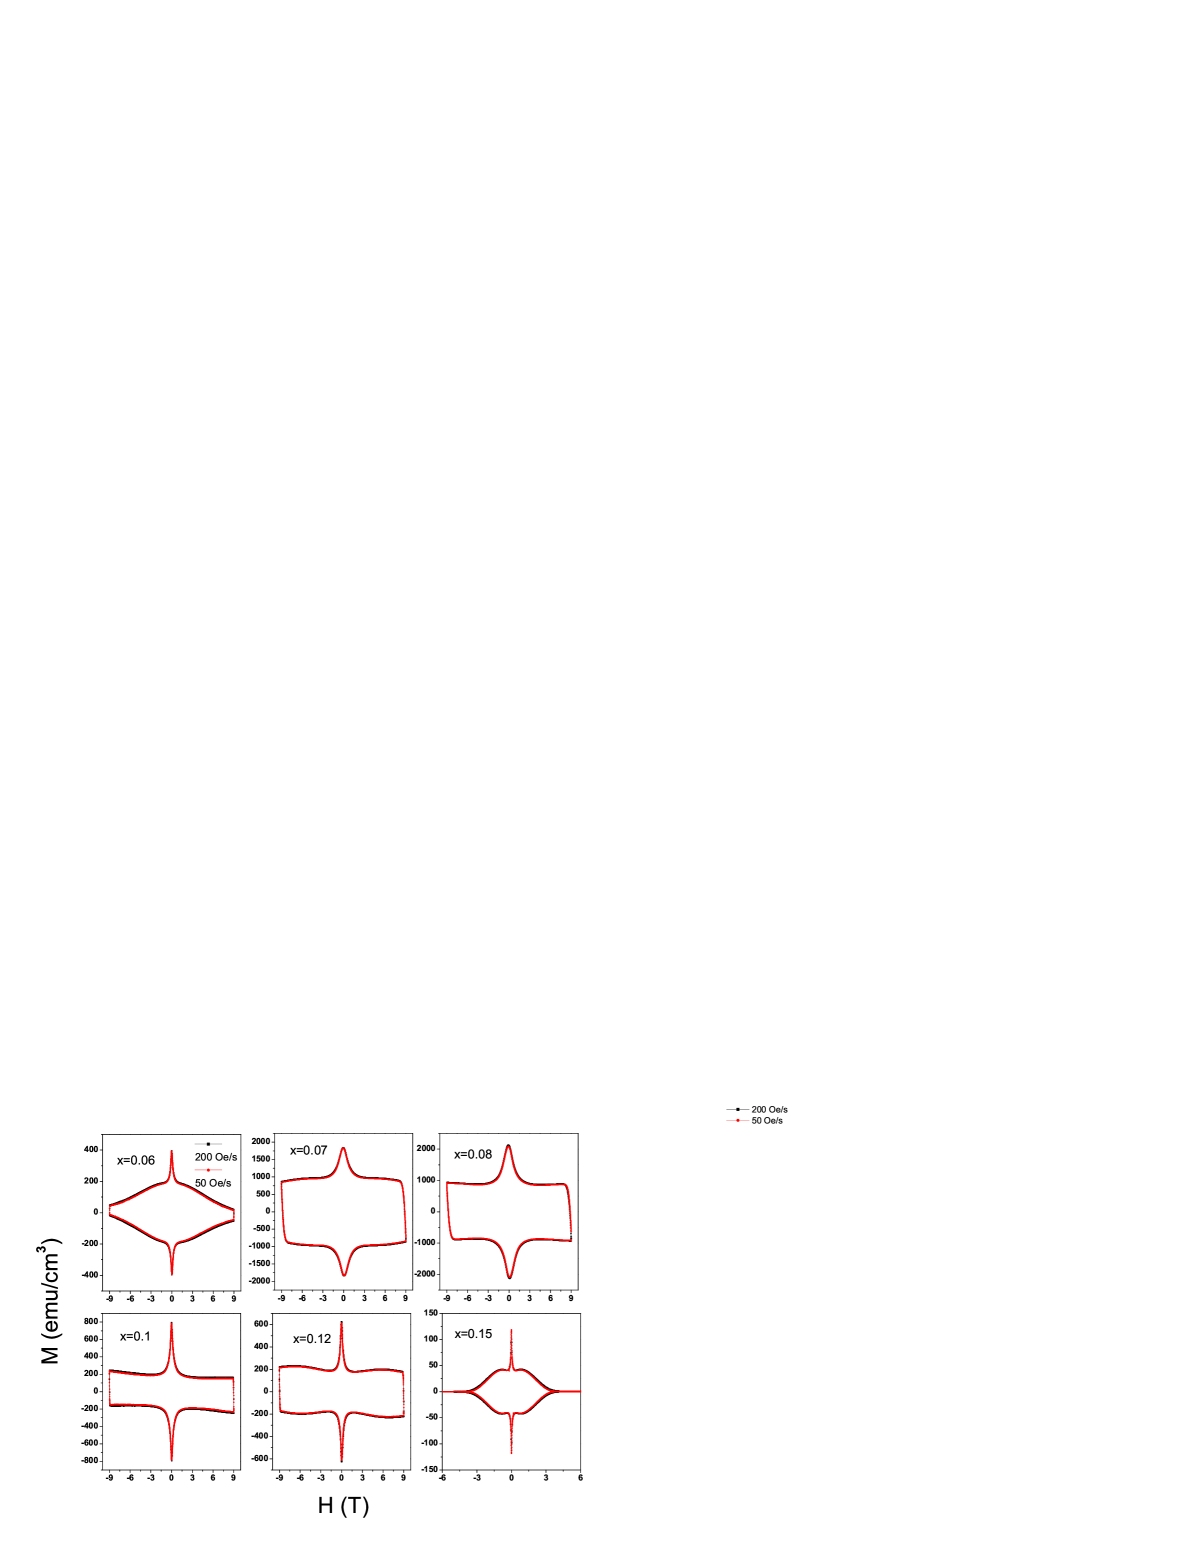
In Fig. 2 we show the magnetization hysteresis loops (MHL) of six doped samples measured at 2 K with the magnetic sweeping rates of 50 Oe/s and 200 Oe/s, respectively. The symmetric MHL curves indicate that the bulk superconducting current instead of the surface shielding current dominates in the samples during the measurements. A surprising observation here is that the difference between measured at 200 and 50 Oe/s can be easily distinguished, which indicates a relatively large vortex creep rate, or as called as giant vortex creep in the cuprate superconductors. A prominent SP effect or called as the fish-tail effect was observed in the samples around the optimal doping level ( = 0.08), but it becomes invisible in the very underdoped sample( = 0.06) and hardly visible in the highly overdoped samples ( = 0.15). When the field is approaching zero, the absolute value of magnetic moment increases markedly. The central peaks are surprisingly sharp in all the six doped samples which was hardly seen in the conventional superconductors and high temperature superconductors (HTSC). Whereas in FeAs based superconductors, this kind of sharp peaks are often observed in both 1111 and 122 systems, which will be detailed in next section.YangHPRB ; YangHAPL ; ProzorovPRB ; HARDY V
III Results and Data Analysis
III.1 The optimally doped sample
III.1.1 The sharp central peak and second-peak
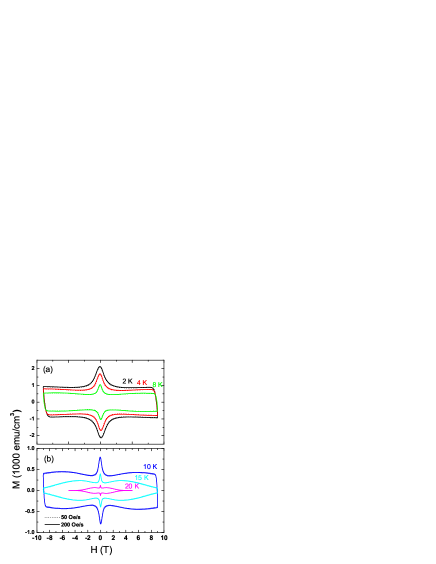
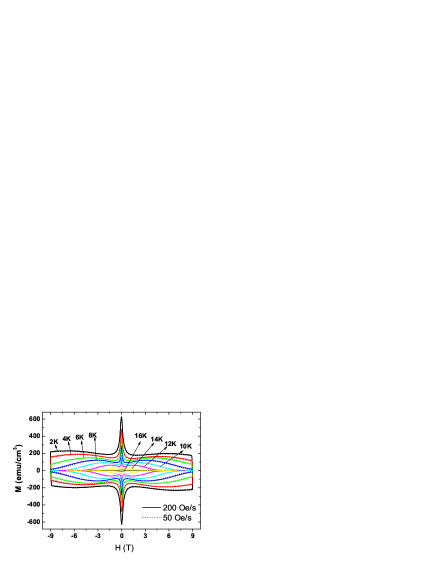
The MHLs measured at different temperatures from 2 K to 20 K are presented in Fig.3 for the optimally doped sample ( = 0.08). The symmetric curves suggest that the bulk pinning instead of the surface barrier dominates in the sample. The SP effect can be easily observed in Fig.3(b) at 10 K. With the decreasing of temperature, the SP moves to higher magnetic field and finally goes beyond the maximum field value 9 T as shown in Fig.3(a). The global shape of MHL and the related features resemble that in the cuprate superconductor YBa2Cu3O7-δ.SPYBCO
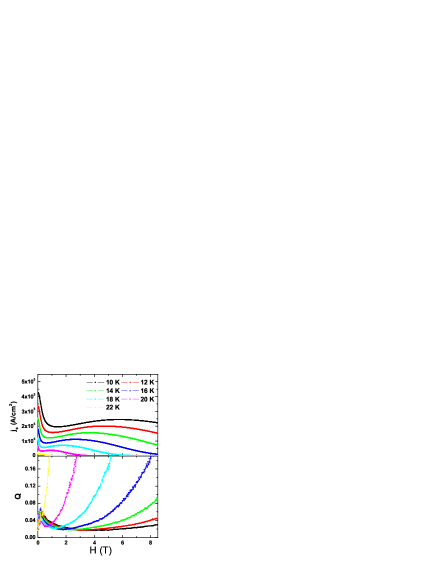
When the external field is approaching zero, the absolute value of magnetic moment increases markedly and reaches a maximum, showing a very sharp magnetization peak near zero field. In high temperature superconductors (HTSC) and other conventional type-II superconductors, we can see a magnetization hump near zero field. This hump near zero field was illustrated by mathematical simulation as due to the following reason:H.G. Schnack The low flow rate or strong pinning in the interior part prevents the vortices from leaving the sample rapidly, while when the external field is approaching or just departing from zero, the vortices of opposite signs enter the sample, which makes the number of vortices decrease quickly at the edge. This produces a non-linear profile with a high slope near the edge. Clearly, in our six doped samples the central magnetization peaks are surprisingly sharp. This sharp magnetization peak near zero field in iron pnictide may be understood in the similar way. When the external field is swept back to zero, because of the small absolute value of , the slope of and the critical current density near the edge is much larger than that in the interior part. In this case, a much enhanced magnetization will appear. However, this simple picture will be complicated by the step of in the surface layer with thickness of penetration depth. Meanwhile the surface barrier and/or the geometrical barrier may also play roles here.
Based on the Bean critical state model,C. P. Bean we calculate the superconducting current density
| (2) |
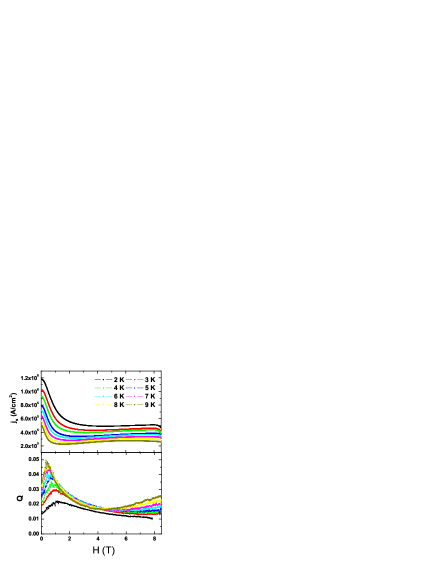
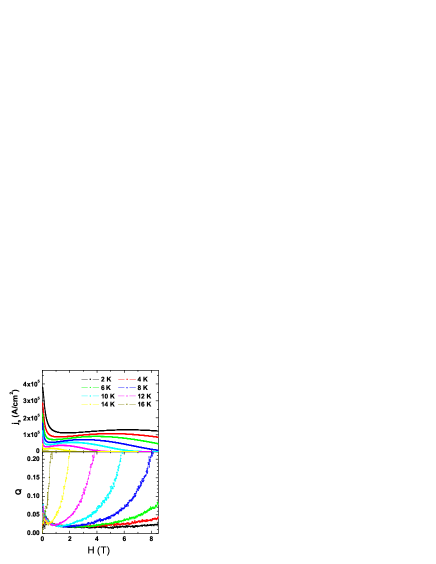
where , and () is the magnetization associated with increasing (decreasing) field; is the width and length of the sample separately. In Fig.3 and Fig.4, we present the field dependence of and relaxation rate . As shown in Fig.3 and Fig.4, the magnetization relaxation rate is inversely related to the revealing the non-monotonic field and temperature dependence through the SP region. Therefore the SP effect is induced by the transient relaxation effect which depends on the time scale.LiSLPRB ; Yeshurun As mentioned above, near zero field, a clear sharp magnetization peak can be found in MHL. Accompanying this peak, there is a clear suppression of the relaxation rate which exhibits a valley near zero field. This may be related to the stronger critical current density in the edge region where the value is small. With increasing field, a peak of magnetization relaxation can also be observed region corresponding to the crossover of between the low-field high slope and high-field low slope. This may suggest that the crossover point (or the peak position of ) corresponds to two different regimes of vortex dynamics. The position of the peak shift to the lower field with the increasing the temperature. A full understanding to this effect would need a local measurement facility, such as Hall probe array and magneto-optics. We leave this to a future investigation.
Another interesting feature revealed by Fig.4 and Fig.5 is that, the magnetization relaxation rate rises up quickly and monotonically to 100% when the magnetic field is beyond the SP position . This may suggest that the high field region is dominated by the plastic motion of vortices. This conclusion will be corroborated by the detailed analysis based on the collective pinning model in next section.
III.1.2 Analysis based on the vortex collective pinning model
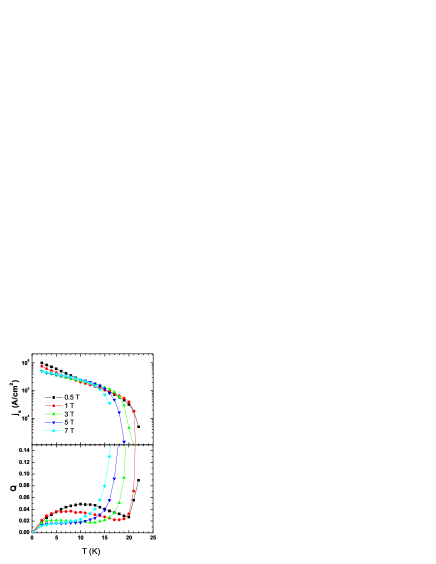
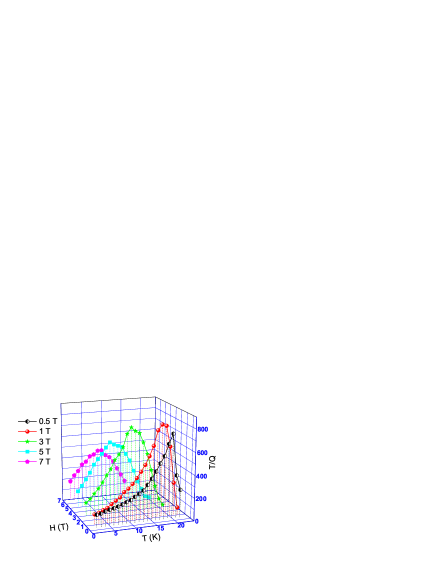
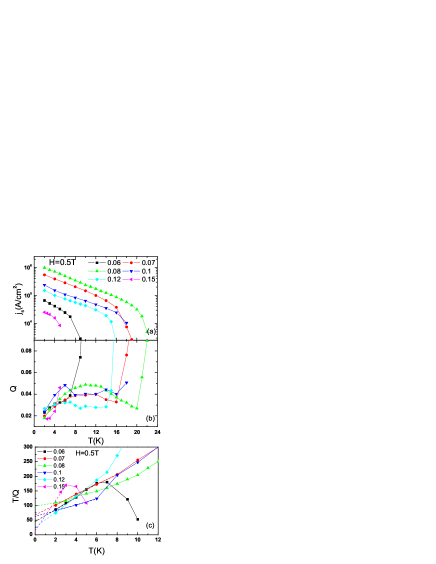
The temperature dependence of the transient superconducting current density calculated through based on the Bean critical state model and the dynamical magnetization relaxation rate are presented in Fig.6. It is clear that the curve shows a crossing feature at about 10 K for the data measured with different magnetic fields, this is understandable since the SP effect exhibits a crossover between different pinning regimes. Interestingly the relaxation rate shows a weak temperature dependent or a bump-like behavior in the intermediate temperature region. Although the relaxation rate exhibits a rather large value in the low temperature approach, we cannot conclude whether the quantum tunneling of vortices is strong or not in the pnictide superconductors since the lowest temperature measured here is about 2 K. The plateau or bump-like temperature dependence of was also observed in cuprate superconductors, which is especially pronounced in YBa2Cu3O7-δ superconductor.Fruchter This plateau cannot be understood within the picture of single vortex creep with the rigid hopping length as predicted by the Anderson-Kim model, but was attributed to the effect of collective pinning. We will illustrate this point in the following discussion. In the high temperature region, the relaxation rate rises sharply corresponding to the plastic motion of vortices.
In order to understand the vortex motion in a detailed way, we adopt the model of thermally activated flux motion (TAFM), which reads
| (3) |
here is the electric field induced by the vortex motion, is the activation energy, is the attempting hopping velocity, is the actual local magnetic induction. It was suggested that the activation energy can be written in a very general way as
| (4) |
where , , and are the glassy exponent, intrinsic characteristic pinning energy and the un-relaxed critical current density, respectively. The latter two parameters and strongly depend on the pinning details, such as the characteristics of the pinning centers, the disorder landscape, the condensation energy, the coherence length and the anisotropy, etc.. The glassy exponent gives influence on the current dependence of , which is a decreasing function of for all possible values of . From the elastic manifold theory, it was predicted that = 1/7, 3/2, 7/9 for the single vortex, small bundles and large bundles of vortex motion with the weak collective pinning centers.VinokurPRL For = -1 the equation recovers the Kim-Anderson model, and the Zeldov logarithmic model as special cases can be described for =0.Zeldov Just by combining above two equations, it was derived thatWenHHPhysicaC2001
| (5) |
This equation indicates that a negative would correspond to a positive curvature of vs. , indicating of a finite dissipation in the small current limit and plastic vortex motion, while a positive corresponds to a negative curvature of vs , showing a vanishing dissipation in the small current limit and elastic vortex motion. Therefore Eq.5 is physically meaningful for any value of , both positive and negative, as well as 0. Eq.5 is most suitable for a consistent analysis when a transition occurs in the type of pinning as reported in this paper. From the general vortex motion equations (3) and (4) mentioned above and the definition of , Wen et al. derived the following equationWenHHJAlloy
| (6) |
where is a parameter that is weakly temperature dependent, is the lateral dimension of the sample. We thus present the vs. at different magnetic fields in Fig.7. It is clear that the curve vs. gives a positive curvature in the low and intermediate temperature region, while a negative slope appears in the high temperature region. Upon above discussion, the positive slope of vs. would suggest an positive glassy exponent and elastic vortex motion, and a negative slope of vs. may suggest a negative provided the temperature dependence of is not strong. By extrapolating the curve down to zero temperature, one can obtain the value of . The value of at 0.5 T calculated from Fig.7 is about 98 K, which is actually a small value, implying a quite small characteristic pinning energy. The is about 300 K (at 0.5 T) in YBCO thin filmsWenPhysicaC1995 ; GriessenPRL1994 but beyond 3000 K in MgB2.MgB2Uc With the increase of magnetic field, the gradually decreases. While there is an upturn at 7 Tesla, where the SP effect sets in. By calculating the slope of vs. curve, we can get the value of assuming that is not a strongly temperature dependent function. In the intermediate temperature region, can be derived from the formulaWenPhysicaC1995
| (7) |
Here we found = 28.56 . In this way, can also be roughly estimated. At 0.5 Tesla, we obtained a positive value = 0.45, which indicates an elastic vortex motion. The value obtained here by the rough estimate is also consistent with what we get through a quantitative analysis based on the Generalized-Inversion-Scheme (GIS).
III.1.3 Generalized-Inversion-Scheme
To extract information on the unrelaxed critical current density and the corresponding characteristic pinning energy directly from the relaxation data, the GIS was proposed by Schnack et al.Schnack and Wen et al.WenPhysicaC1995 . The basic assumptions of GIS are: (1) TAFM [eq.(1)]; (2); (3), here and depend on the specific pinning models (see below). These assumptions represent the most general scheme among many methods proposed so far. According to GIS, one can determine by using the following integral:
| (8) |
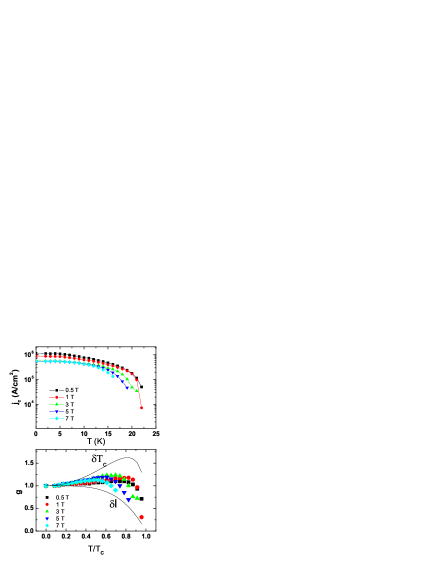
Here is the critical current density at 0 K. In this equation, the and are the measured values. Once is known, the temperature dependence of the intrinsic pinning energy is obtained from assumption (3) of GIS. To apply this procedure, one must know the value of as well as the function . For a 2D pancake system, it is known that , where is the flux quanta, is the thickness of the pancake vortex, is the pinning range, which typically is identified with the coherence length . Thus, in this special case, = 1 and with . Similarly, for a 3D single vortex, it is foundWenPhysicaC1995 that = 0.5 and . By inserting these expressions into above equation, one can calculate and from the experimental data. The results of such a GIS analysis based on the single vortex approach is presented in Fig.8(a) and (b). To be consistent with the analysis given in the context of Fig.7, the same value of = 28 has been assumed. In Fig.8(b), we show together the theoretical predictions for the two basic pinning mechanism: pinning due to the spatial fluctuation of superconducting transition temperatures which is called -pinning,WenPhysicaC19952 and that due to the spatial fluctuation of the mean-free-path, the so-called -pinning.GriessenPRL1994 ; Blatter Taking = 0.5 and = 28, the unrelaxed critical current density and function are determined and presented in Fig.8. Shown together with are the theoretical predictions for the single vortex of -pinning with and for the -pinning . One can see that the experimentally derived value resides in between the -pinning and -pinning. However an enhancement of in the high temperature region is hardly achieved by the -pinning, which is however anticipated by the model of -pinning. We would therefore conclude that either -pinning or some other pinning mechanism are in functioning in the present optimally doped samples. This of course warrants further clarification.
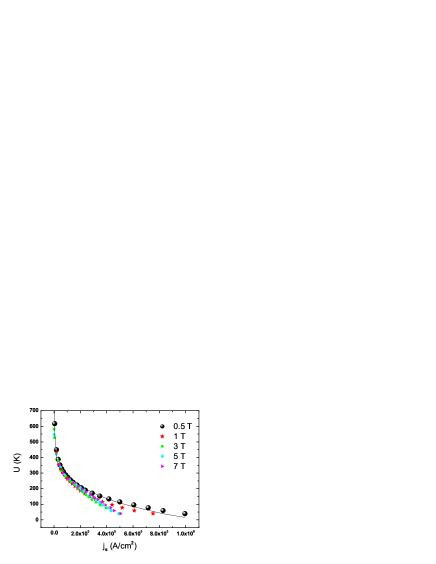
Fig.9 shows the obtained by GIS at five fields for the optimally doped sample. The data at 0.5 T was fitted to eq.4. The fitting parameter is 116 K, which is close to 98 K mentioned above. From the fit we get = 0.55, which is quite close to that obtained before = 0.46. We should mention that the value determined here is just an averaged one, which in principle is also current dependent. Our work suggests that the collective pinning model is applicable in this kind of superconductors at low and intermediate temperature region with a positive glassy exponent. At high fields (still below ), the collective pinning model may still work, but it is difficult to be quantitatively described by the GIS since crossover from the single vortex creep to small bundles or large bundles have occured.
III.1.4 The vortex phase diagram
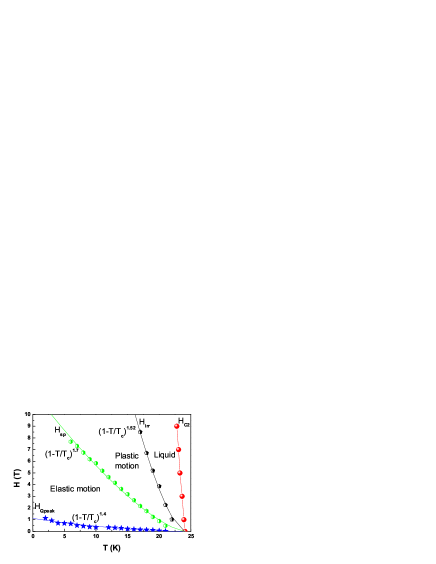
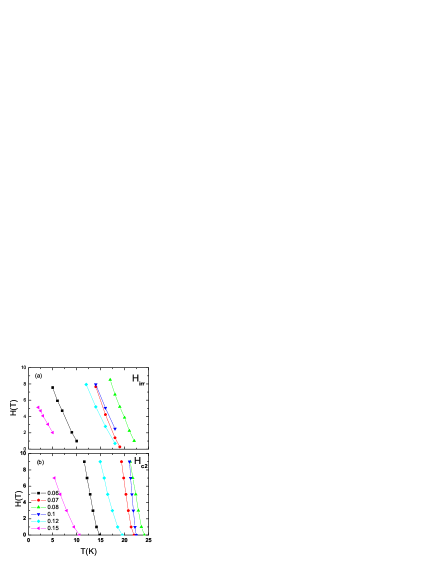
In Fig. 10, we present the vortex phase diagram of the optimally doped sample with = 0.08. From the magnetic measurement, three characteristic fields are determined as shown by the solid symbols in Fig.10. The second-peak and the relaxation rate peak together with the irreversibility field (taken with the criterion of 0.1 emu/cm3) are shown. The upper critical field with 95 percent is shown by the filled circles. There is a large area between the , and curves, suggesting that the vortex dissipation is through a plastic motion in this region, but the dissipation level is still quite low. The , and are clearly temperature dependent. As an accumulation of knowledge, the three curves are well fitted by the expressions , and , respectively.
III.2 Overdoped sample with =0.12
Now we turn to the case of an overdoped sample ( = 0.12) with superconducting transition temperature of 19 K. The MHLs of the sample = 0.12 measured at 2-16 K with the magnetic sweeping rate 50 Oe/s and 200 Oe/s are shown in Fig.11. At 2 K, the SP effect is obviously observed, and by increasing temperature, the second-peak shifts to the low magnetic field. The very sharp magnetization peak was also found near the zero field. The symmetric curves suggest that the bulk pinning instead of the surface barrier dominates in the sample.
Based on the Bean critical state model,C. P. Bean it is known that the superconducting transient current . The non-monotonic field and temperature dependence of was clearly observed in the SP region (shown in Fig.12). At a low field, magnetization relaxation rate has an upturn when decreasing the magnetic field, which is in accord with the valley of the MHL. In the intermediate field region, decreases with the increasing of the magnetic field, this indicates a crossover to a vortex glass region with relatively strong pinning of vortex. Above the second-peak maximum value , the value of increases drastically showing a crossover to the regime of plastic motion.
The temperature dependence of and for the overdoped sample = 0.12 was presented in Fig.13. Obviously, there is still a plateau in the intermediate temperature region for each curve, which is corresponding to the linear region of curve. And the region of the plateau shrinks quickly with increasing the magnetic field. This behavior can be understood within the picture of collective vortex pinning model. In the high temperature region, the increases abruptly, and the drops down drastically, which again shows a crossover from the collective elastic motion to plastic motion.
The similar vortex behavior with the optimally doped sample can be derived from the vortex phase diagram for the sample with = 0.12 (shown in Fig. 14). From the magnetic measurements, three characteristic fields are determined as shown by the filled symbols in Fig. 14. The SP field locating at the peak of the curve shown as the solid pentagram now is much lower than that in the optimally doped sample. The irreversibility field is determined by taking a criterion of 0.1 emu/cm3 shown as the solid star. The upper critical field with 95 percent is shown as the filled circles. The , curves are well fitted by the expressions and . Below the line the vortex behavior is consistent with the collective creep model. Between line and line, it can be understood by the model of plastic motion. Above the line, the vortex liquid phase exists.
III.3 Underdoped sample with = 0.06
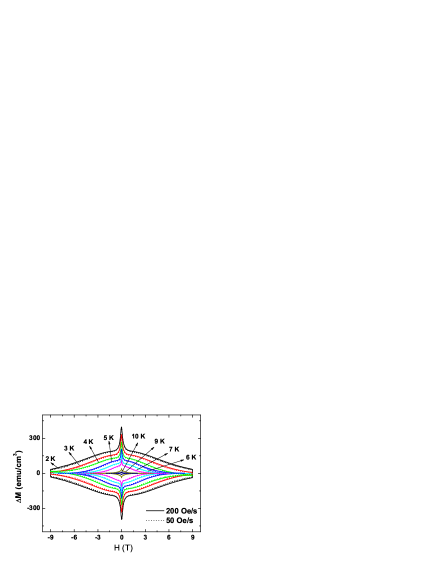
Fig.15 shows the magnetization hysteresis loops of the sample = 0.06 measured at 2-10 K with the magnetic field sweeping rate 50 Oe/s and 200 Oe/s, respectively. At all temperatures we measured here, the SP effect cannot be obviously observed. As the optimal doped and overdoped sample the very sharp magnetization peak was also found near the zero field. The symmetric MHL curves suggest that the bulk pinning instead of the surface barrier dominates even in this very underdoped sample.
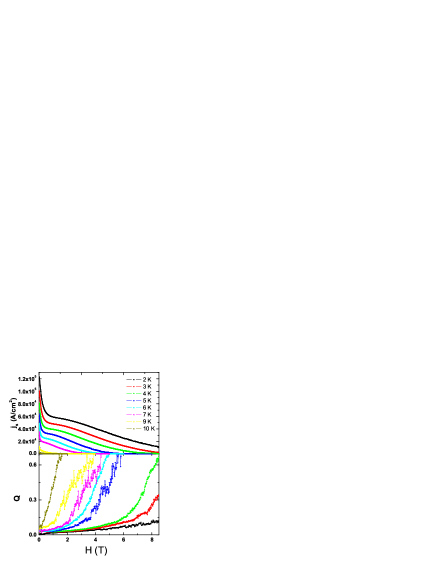
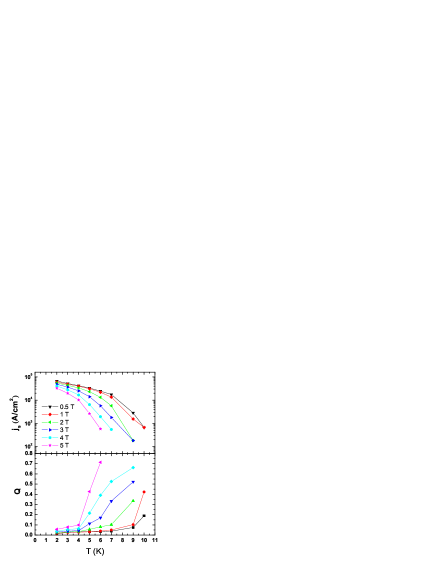
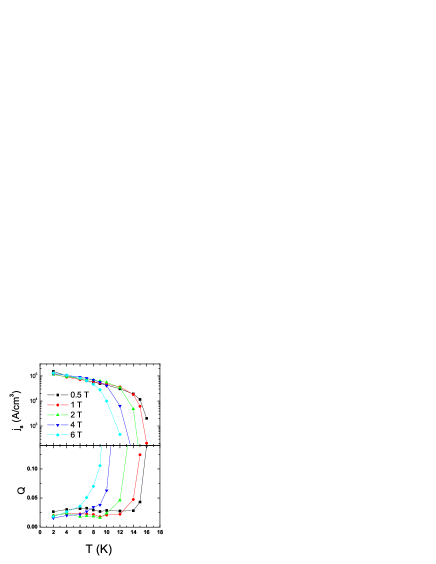
The field dependence of and from 2 K to 10 K was presented in Fig.16. The decreases monotonously with the increase of magnetic field, without showing a SP effect. Correspondingly, increases with the increasing of the magnetic field rapidly and quickly reaches the upper limit 100%. This indicates that the vortex motion in the most temperature regime investigated for this sample is dominated by plastic motion. The temperature dependence of and measured at different magnetic fields were presented in Fig.17. By increasing temperature, initially decrease linearly, while it quickly evolves into a quick drooping down in the high temperature region. In the low field region (0.5 T and 1 T), the relaxation rate Q rises relatively slowly with temperature in low and intermediate temperature region, while at 2 T, 3 T, 4 T and 5 T, the curve increases dramatically on warming, which suggests the quick evolvement of the plastic motion of vortices.
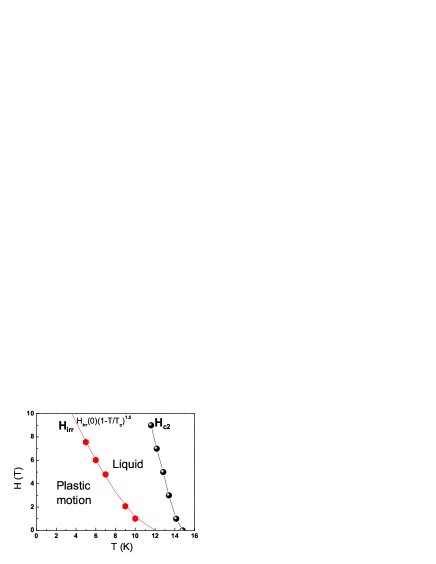
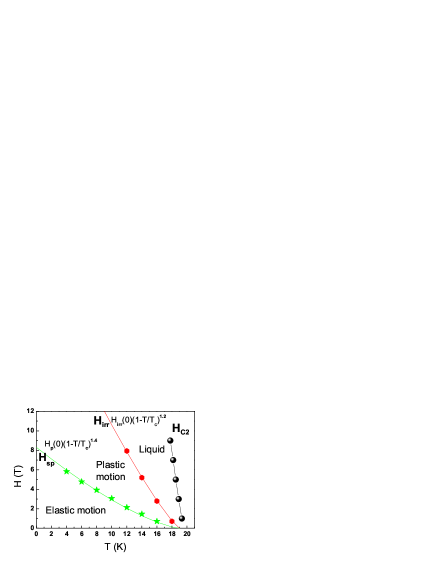
The vortex phase diagram of the underdoped sample with = 0.06 is presented in Fig.18. Between the upper critical field and the irreversibility line, it is the region for vortex liquid, while there is now a region below the irreversible line which may have a low dissipation, but be dominated by plastic motion. It is still unclear whether in this sample we can still see the SP effect at temperatures below 2 K. It is obvious that the SP effect is absent at temperatures above 2 K. One of the interpretations is that the elastic energy which is based on the characteristic pinning energy is too weak to sustain an elastic object in the vortex system. Therefore in this sample, the vortex motion below is dominated by a plastic manner. While we should not exclude the possibility that in the regime at much lower temperatures, the elastic motion still exists.
IV Discussion
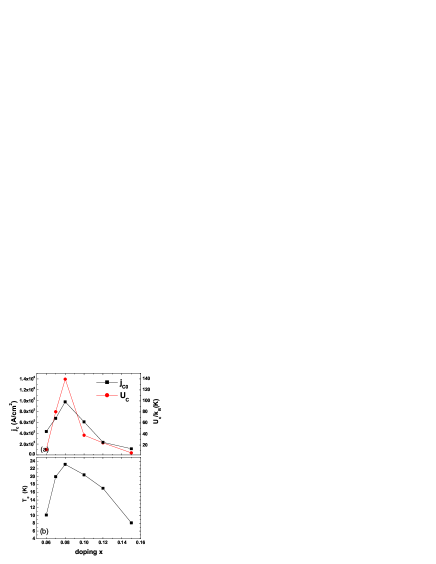
In all six samples investigated here, sizable magnetization relaxation rate has been observed, which indicates a relatively small characteristic pinning energy. In the samples around the optimal doping level ( 0.08) a SP effect was easily observed, while it becomes invisible in the very underdoped samples, and hardly visible for the highly overdoped one. The missing of the SP effect in the very underdoped and overdoped regions is understandable since the pining energy becomes much weaker than that of the optimally doped sample. In this case, the dislocation in the vortex system can easily move leading to a plastic motion as appeared in the high field region of the optimally doped sample. Therefore we believe that the missing of the SP effect in the very underdoped or overdoped samples is induced by the missing of the elastic collective pinning and creep. The monotonic rising of the relaxation rate in whole temperature region for the very underdoped and overdoped samples support this argument. Another interesting observation is that a very sharp magnetization peak was observed near the zero field in all samples which is found to correspond very well to a much reduced relaxation rate. Fig.19 shows the temperature dependence of , and with all doping levels at 0.5 T. We found an bell-shaped or a plateau-like temperature dependence of with moderate relaxation rate in most samples, which can be understood within the collective creep theory. The plateau region in the very underdoped = 0.06 and very overdoped sample = 0.15 is very short because of the low pinning energy. According to eq.6, the value of in the = 0 K approach would give the characteristic pinning energy . Fig.20 shows the doping dependence of at 0.5 T with all doping levels. The linear -T curves of all doped samples at 0.5 T suggest the thermally activated collective vortex creep feature in the intermediate temperature region. The , and curves have the similar dome shape with doping, this may suggest that the vortex pinning is through the disorders with small condensation energy. By taking a GIS treatment on the magnetization data, we found that the vortex pinning is probably achieved through the spatial fluctuation of the superconducting transition temperatures, the so-called pinning. Further investigations are strongly recommended to clarify this issue. With the decreasing of , the samples have lower irreversible field and the upper critical field, as shown in Fig 21. While compared to the underdoped samples, the overdoped samples with similar seem to have higher irreversible field and the upper critical field. The SP in underdoped samples disappear more quickly with doping than that in overdoped sample. For example, when the doping level drops down from = 0.07 to 0.06, the SP effect disappears, while it is still visible when the doping level goes to 0.12, although very weak. This tendency is actually similar to the doping dependence of and the characteristic pinning energy , as shown in Fig. 20. This again suggests that the SP effect is dependent on the pinning energy which governs actually the threshold of the plastic motion of vortex system.
V Concluding Remarks
We measured magnetization and its relaxation in Ba(Fe1-xCoAs2 single crystals at various doping levels ranging from very underdoped to very overdoped regime. Detailed analysis lead to the following major conclusions:
(1) In all samples, sizable magnetization relaxation rate has been observed, which suggests relatively weak vortex pinning energy. The characteristic pinning energy obtained here for the optimally doped sample is about 100 K at about 0.5 T.
(2) A very sharp magnetization peak was observed near zero field which corresponds to a much reduced relaxation rate. This may be induced by the extremely non-linear near the edge when the external field is swept to zero, or due to the surface barrier for the vortex exit and entering at the edge.
(3) The second-peak effect was easily observed in the samples around the optimal doping level (0.08), but it becomes hardly visible in the very underdoped and highly overdoped samples. We attribute the missing of the SP effect to the much weaker pinning energy, which leads to a plastic motion of vortices in wide temperature regions. Through the SP region the transient superconducting current density shows the non-monotonic field and temperature dependence.
(4) The weak temperature dependence of relaxation rate together with the treatment of the Generalized-Inversion-Scheme, point to the fact that the model of collective vortex pinning and creep works well in describing the vortex dynamics in iron pnictides. The vortex pinning is probably achieved through the spatial fluctuation of the transition temperatures, which would mean an intrinsic inhomogeneity of the iron-pnictide superconductors.
VI Acknowledgments
This work is supported by the Natural Science Foundation of China, the Ministry of Science and Technology of China (973 project No: 2006CB60100, 2006CB921107, 2006CB921802), and Chinese Academy of Sciences (Project ITSNEM).
Correspondence should be addressed to hhwen@aphy.iphy.ac.cn
References
- (1) Y. Kamihara, T. Watanabe, M. Hirano and H. Hosono, J. Am. Chem. Soc. 130, 3296 (2008).
- (2) P. Cheng, B. Shen, G. Mu, X. Y. Zhu, F. Han, B. Zeng, H. H. Wen, Europhys. Lett. 85, 67003 (2009).
- (3) M. Rotter, M. Tegel, I. Schellenberg, W. Hermes, Phys. Rev. B 78,020503(R) (2008).
- (4) F. Hunte, J. Jaroszynski, A. Gurevich, D. C. Larbalestier, R. Jin, A. S. Sefat, M. A. McGuire, B. C. Sales, D. K. Christen, and D. Mandrus, Nature(London) 453, 903 (2008).
- (5) C. Ren, Z. S. Wang, H. Q. Luo, H. Yang, L. Shan, H. H. Wen, Phys. Rev. Lett. 101, 257006 (2008).
- (6) Y. Machida, K. Tomokuni, T. Isono, K. Izawa, Y. Nakajima, T. Tamegai, arXiv:0906.0508.
- (7) C. Senatore, R. Fl kiger, M. Cantoni, G. Wu, R. H. Liu, and X. H. Chen, Phys. Rev. B 78, 054514 (2008).
- (8) Y. Jia, P. Cheng, L.Fang, H. Q. Luo, H. Yang, C. Ren, L. Shan, C. Z. Gu, and H. H. Wen, Appl. Phys. Lett. 93, 032503 (2008).
- (9) H. Yang, C. Ren, L. Shan, H. H. Wen, Phys. Rev. B 78, 092504 (2008).
- (10) H. Yang, H. Q. Luo, Z. S. Wang, H. H. Wen, Appl. Phys. Lett. 93, 142506 (2008).
- (11) R. Prozorov, N. Ni, M. A. Tanatar, V. G. Kogan, R. T. Gordon, C. Martin, E. C. Blomberg, P. Prommapan, J. Q. Yan, S. L. Bud’ko, P. C. Canfield, Phys. Rev. B 78, 224506 (2008).
- (12) R. Prozorov, M. A. Tanatar, E. C. Blomberg, P. Prommapan, R. T. Gordon, N. Ni, S. L. Bud’ko, P. C. Canfield , Physica C 469, 667 (2009).
- (13) R. Prozorov, M. A. Tanatar, N. Ni, A. Kreyssig, S. Nandi, S. L. Bud’ko, A. I. Goldman, P. C. Canfield arXiv:0909.0923.
- (14) J. D. Moore, L. F. Cohen, Y. Yeshurun, A. D. Caplin, K. Morrison, K. A. Yates, C. M. McGilvery, J. M. Perkins, D. W. McComb, C. Trautmann, Z. A. Ren, J. Yang, W. Lu, X. L. Dong, Z. X. Zhao , arXiv:0907.0217.
- (15) Y. Nakajima, Y. Tsuchiya, T. Taen, T. Tamegai, S. Okayasu, M. Sasase, arXiv:0906.0444.
- (16) G. Blatter, M. V. Feigel man, V. B. Geshkenbein, A. I. Larkin, and V. M. Vinokur, Rev. Mod. Phys. 66, 1125 (1994).
- (17) Y. Yeshurun, A. P. Malozemoff, and A. Shaulov, Rev. Mod. Phys. 68, 911 (1996).
- (18) E. H. Brandt, Rep. Prog. Phys. 58, 1465 (1995).
- (19) H. Beidenkopf, Y. Myasoedov, E. Zeldov, E. H. Brandt, G. P. Mikitik, T. Tamegai, T. Sasagawa, C. J. van der Beek , arXiv:0907.3649.
- (20) L. Fang, H. Luo, P. Cheng, Z. S. Wang, Y. Jia, G. Mu, B. Shen, I. I. Mazin, L. Shan, C. Ren, H. H. Wen , Phys.Rev.B 80, 140508 (R) (2009).
- (21) M. Jirsa, L. Pust, D. Dlouhy, et al, Phys. Rev.B 55, 3276 (1997).
- (22) H. H. Wen, H. G. Schnack , R. Griessen, B. Dam, J. Rector, Physica C 353.74 (1995).
- (23) H. H. Wen, Z. X. Zhao, R. J. Wijngaarden, et al, Phys. Rev.B 52.4583 (1995).
- (24) H. G. Schnack, R. Griessen, J. G. Lensink, C. J. van der Beek and P.H. Kes, PhysicaC 197.337 (1992).
- (25) U. Welp, W. K. Kwok, G. W. Crabtree, K. G.Vandervoot, and J. Z. Liu, Appl. Phys. Lett. 57, 84 (1990).
- (26) C. P. Bean, Rev. Mod. Phys. 36, 31 (1964).
- (27) H. H. Wen, S. L. Li, Z. W. Zhao, H. Jin, Y. M. Ni, W. N. Kang, Hyeong-Jin Kim, Eum-Mi Choi, and Sung-Ik Lee, Phys. Rev. B 64, 134505 (2001).
- (28) B. Kalisky, A. Shulov, and Y. Yeshurun, Phys. Rev. B 68, 012502 (2003).
- (29) L. Fruchter, A. P. Malozemoff, I. A. Campbell, and J. Sanchez, M. Konczykowski, R. Griessen, F. Holtzberg, Phys. Rev.B 43, 8709 (1991)
- (30) M. V. Feigel man, V. B. Geshkenbein, A. I. Larkin, and V. M. Vinokur, Phys. Rev. Lett. 63, 2303 (1989).
- (31) E. Zeldov, A. I. Larkin, V. B. Geshkenbein, M. Konczykowski, D. Majer, B. Khaykovich, V. M. Vinokur, and H. Shtrikman,Phys. Rev. Lett. 73, 1428 (1994).
- (32) H. H. Wen, S. L. Li, Z. W. Zhao, H. Jin, Y. M. Ni, Z. A. Ren, G. C. Che, Z. X. Zhao, Physica C 363, (2001).
- (33) H. H. Wen, R. Griessen, D.G. de Groot, B. Dam, J. Rector, Journal of Alloys and Compounds 195, 427 (1993).
- (34) R. Griessen, H. H. Wen, A. J. van Dalen, B. Dam, J. Rector, H. G. Schnack, S. Libbrecht, E. Osquiguil, and Y. Bruynseraede, Phys. Rev. Lett. 72, 1910 (1994).
- (35) H. Jin, H. H. Wen, H. P. Yang, Z. Y. Liu, Z. A. Ren, G. C. Che, and Z. X. Zhao, Appl. Phys. Lett. 83, 2626 (2003).
- (36) H. G. Schnack, R. Griessen, J. G. Lensink, and Wen Hai-Hu, Phys. Rev. B 48, 13178 (1993).
- (37) H. H. Wen, Z. X. Zhao, Y. G. Xiao, B. Yin, J. W. Li, Physica C 251, 371 (1995).