Hybrid functional study of proper and improper multiferroics
Abstract
We present a detailed study of the structural, electronic, magnetic and ferroelectric properties of prototypical proper and improper multiferroic (MF) systems such as BiFeO3 and orthorhombic HoMnO3, respectively, within density functional theory (DFT) and using the Heyd-Scuseria-Ernzerhof hybrid functional (HSE). By comparing our results with available experimental data as well as with state-of-the-art GW calculations, we show that the HSE formalism is able to account well for the relevant properties of these compounds and it emerges as an accurate tool for predictive first-principles investigations on multiferroic systems. We show that effects beyond local and semilocal DFT approaches (as provided by HSE) are necessary for a realistic description of MFs. For the electric polarization, a decrease is found for MFs with magnetically-induced ferroelectricity, such as HoMnO3, where the calculated polarization changes from 6 using Perdew-Burke-Ernzerhof (PBE) to 2 using HSE. However, for proper MFs, such as BiFeO3, the polarization slightly increases upon introduction of exact exchange. Our findings therefore suggest that a general trend for the HSE correction to bare density functional cannot be extracted; rather, a specific investigation has to be carried out on each compound.
pacs:
75.80.+q; 75.47.Lx; 75.50.Ee; 77.80.-e; 71.15.Ap;I Introduction
Multiferroics (MFs) are materials in which different ferroic orders such as ferromagnetism, ferroelectricity and/or ferroelasticity may coexist in a single compound.Khomskii (2009) They have attracted much attention for their potential applications in memory devices and other electronic components, due to the intriguing possibility of controlling magnetism by an applied electric field, and viceversa (magnetoelectric effect).Kimura et al. (2003); Hur et al. (2004); Cheong and Mostovoy (2007); Wang et al. (2005)
Multiferroics are compounds where electron correlations are rather important, and where the electron charge shows atomic-like features, such as strong space localization, poorly dispersed band energies, and large on-site Coulomb repulsion.Fiebig (2005); Hur et al. (2004); Cheong and Mostovoy (2007); Spaldin and Fiebig (2005) For these systems, there are well-known deficiencies of local-spin-density approximation (LSDA) or spin-polarized generalized-gradient-approximation (SGGA) to density-functional-theory (DFT). Among them, we recall the underestimation of the band-gap magnitude for most insulating materials.Kümmel and Kronik (2008); Bachelet and Christensen (1985); Filippetti and Hill (2002) Part of these failures can be traced back to the self-interaction error in approximate density functionals: the electron charge experiences a spurious interaction with the Coulomb and exchange-correlation potential generated by itself.Aulbur et al. (1999); Aryasetiawan and Gunnarsson (1998)
The LSDA+Anisimov et al. (1997, 1991); Solovyev et al. (1994) and the self-interaction correction (SIC) schemesPerdew and Zunger (1981); Filippetti and Spaldin (2003); Droghetti et al. (2008) can overcome some of the deficiencies of LSDA. However, LSDA+ suffers ambiguities in the choice of the parameter and needs a choice regarding which orbitals to treat within a Hubbard-like approach. For simple materials, a self-consistent evaluation of the parameter can be obtained, although this method is not widely used.Rohrbach et al. (2004) For BiFeO3, the value Ueff=3.8 eV has been recently calculated.Kornev et al. (2007)
SIC-schemes are not commonly available in electronic structure codes for extended solid state systems. The implementation of a fully self-consistent SIC-LSDA approach for extended systems was done by Svane and co-workers.Svane and Gunnarsson (1990) Since then, other approaches have been implemented (for a review, see Refs.Filippetti and Spaldin (2003); Pemmaraju et al. (2007)). SIC-schemes suffer from the “nonvariationality-problem” of the energy functional which makes forces and stress calculation not commonly available.Stengel and Spaldin (2008)
In the last few years, hybrid Hartree-Fock density functionalsStephens et al. (1994); Adamo and Barone (1999); Ernzerhof and Scuseria (1999); Krukau et al. (2006) have been widely used in solid state physics,Krukau et al. (2006); Muscat et al. (2001); Heyd et al. (2005); Paier et al. (2006) ranging from simple semiconductor systems,Paier et al. (2006) to transition metals, lanthanides, actinides,Hay et al. (2006); Prodan et al. (2006, 2007); Marsman et al. (2008) molecules at surfaces,Stroppa et al. (2007); Stroppa and Kresse (2008) diluted magnetic semiconductors,Stroppa and Kresse (2009) carbon nanostructures.Becke (1993); Ernzerhof et al. (1996) For a recent review see Ref.Janesko et al. (2009). Hybrid functionals mix the exact nonlocal exchange of Hartree-Fock theoryStephens et al. (1994); Adamo and Barone (1999); Ernzerhof and Scuseria (1999); Krukau et al. (2006) with the density functional exchange. The Heyd-Scuseria-Ernzerhof screened hybrid functional (HSE)Heyd et al. (2003, 2006) is well suited for extended solid state systems.
There are very few studies dealing with ferroelectric oxides and even less with multiferroics. Wahl et al. re-investigated the well-known SrTiO3 and BaTiO3 Wahl et al. (2008) using HSE and semilocal functionals (LDA,PBE,Perdew et al. (1996) PBEsol111PBEsolPerdew et al. (2008) is a variant of the PBE exchange functional which improves equilibrium properties of densely-packed solids and their surfaces.). Bilc et al. studied in great details BaTiO3 as well as PbTiO3 using the B1-WC hybrid-functional and concluded that the latter gives an accurate description of both the structural and electronic properties.Bilc et al. (2008) Goffinet et al. extended the analysis to the prototypical multiferroic bismuth ferrite showing that hybrid-functionals, specifically the B1-WC functional, open new perspectives for a better first-principles description of multiferroics.Goffinet et al. (2009) In passing, we recall that the WC gradient corrected functionalWu and Cohen (2006) is very similar to PBEsol and the hybrid B1-WCHeifets et al. (2006) functional mixes the WC functional with 16% nonlocal exchange. The hybrid HSE functional mixes 25% nonlocal exchange with the PBE functional and the mix is performed only on the short range component of the Coulomb interaction (for further details, we refer to Ref. Wahl et al., 2008). However, which functional to prefer for simple ferroelectric compounds is still an open issue.Wahl et al. (2008)
So far, a good performance of HSE or B1-WC functionals has been recognized for proper multiferroics where the ferroelectric polarization is of displacive type. On the other hand, magnetically driven multiferroics, also known as improper multiferroics, are largely unexplored using hybrid functionals. The purpose of this work is to extend the previous hybrid density functional studies from prototypical ferroelectric oxides (SrTiO3, BaTiO3, PbTiO3)Wahl et al. (2008); Bilc et al. (2008) or simple multiferroic system (BiFeO3) to more complicated and exotic multiferroic compounds, such as HoMnO3.
First of all, we focus on BiFeO3, already investigated using the B1-WC functional, but not yet using HSE. In this way, we are able to compare two different, although similar, approaches for BiFeO3. Most importantly, we consider another prototypical case of improper multiferroic, namely HoMnO3, which has recently attracted much attention.Picozzi et al. (2007); Munoz et al. (2001) We will show that important differences compared to standard DFT approaches arise when a proper description of correlated electrons, such as that given by HSE, is taken into account.
Our study suggests that HSE functional improves the description compared to standard DFT approaches for multiferroic systems.
The paper is organized as follows. Details of the computational setups are given in Sect. II. An extended discussion of the structural, electronic, magnetic and ferroelectric properties of BiFeO3 is reported in Sect. III. Sect. IV is devoted to HoMnO3 focussing on the paraelectric AFM-A (Sect. IV.1) and ferroelectric AFM-E (Sect. IV.2) phases. Finally, in Sect. V, we draw our conclusions.
II Computational details
All the calculations presented in this study are performed by using the latest version of the Vienna ab initio simulation package (VASP 5.2).Kresse and Furthmüller (1996) For BiFeO3, all the results are obtained using the projector-augmented plane-wave methodBlöchl (1994); Kresse and Joubert (1999) by explicitly treating 15 valence electrons for Bi (566), 14 for Fe (3p634), and 6 for oxygen (22). We used a 666 Monkhorst-Pack k-mesh for the Brillouin-zone integration and 400-eV energy cutoff. Tests using a 888 mesh as well as 600 eV cutoff did not give significant differences in the calculated properties. Brillouin zone integrations are performed with a Gaussian broadening of 0.1 eV during all relaxations. The experimental unit cell for the (ferroelectric phase) was used as an input in the full-optimization procedure. For this phase as well as for the paraelectric one (see below), we used the rhombohedral setting. The geometries were relaxed until all force components were less than 0.01 eV/Å and the stress tensor components less than 50 meV/cell. The spin configuration was fixed in order to reproduce the G-type antiferromagnetic state of BiFeO3 and the spin-orbit coupling was neglected. For the paraelectric phase, we used the non-polar Rc LiNbO3 phase.Boysen and Altorfer (1994) We compute the difference of electric polarization, i.e. , where , , and denote ferroelectric, paraelectric, ionic and electronic contribution, respectively. For the paraelectric phase, we used the same lattice constant and rhombohedral angle of the ferroelectric one. Note that, although counterintuitively, may be different from zero, as explained in Ref. Neaton et al., 2005. is calculated by summing the position of each ion in the unit cell times the number of its valence electrons. The electronic contribution is obtained by using the Berry phase formalism, within the “modern” theory of polarization.King-Smith and Vanderbilt (1993); Vanderbilt and King-Smith (1993); Resta (1994)
Concerning the HSE calculations, due to the high computational load,222To have an idea of the increased computational cost involved in the HSE calculation, we note that, by considering the same computational setup for BiFeO3, each electronic minimization step takes about 50 times more CPU time than PBE or PBE+U. This means that if a PBE (or PBE+U) self-consistent calculation takes 10 minutes, the HSE will take about 9 hours. we always used the 400 eV and 666 k-point mesh. The Fock exchange was sampled using the twofold reduced k-point grid (using the full grid, gives however negligible changes in the computed properties). Finally, we performed G0W0 calculationsHybertsen and Louie (1986); Fuchs et al. (2007); Shishkin and Kresse (2006, 2007); Shishkin et al. (2007); Rinke et al. (2005) on top of the HSE electronic and ionic structure, which usually represent a good starting point for a perturbative quasiparticle excitation energies.Fuchs et al. (2007) We also included vertex correction in W via an effective nonlocal exchange correlation kernel.Shishkin et al. (2007)
For orthorhombic HoMnO3, the symmetry is chosen with the basis vector as the longest one. The paraelectric phase was simulated using 20-atoms cell in the AFM-A spin configuration showing ferromagnetic (FM) (AFM) intraplanar (interplanar) coupling; for the ferroelectric one we used a 40-atoms cell (doubling the previous cell along the axis) in the AFM-E spin configuration (i.e. in-plane FM zigzag chains anti-ferromagnetically coupled to the neighboring chains with the interplanar coupling also AFM). The energy cutoff was set to 300 eV and the Brillouin zone mesh was fixed to 424 and 224 grid for the AFM-A and AFM-E phase respectively. Ho electrons were assumed as frozen in the core. The experimental lattice constants were used for all the calculations but the internal positions were relaxed. For the HSE calculations, the Fock operator was evaluated on the down-folded k-point mesh. In order to assess the relative stability of the two magnetic phases, we used the same simulation cell containing 40 atoms for both phases, increasing the cutoff to 400 eV and using a 424 k-point grid.
III BiFeO3: results and discussions
III.1 Structural properties
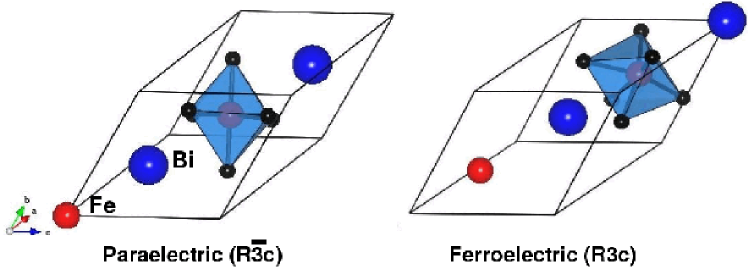
The ferroelectric structure is represented by a distorted double perovskite structure with symmetry (N. 161, point group C3v) as reported by Kubel and Schmid.Kubel and Schmid (1990) The paraelectric phase has symmetry (N. 167, point group D3d). Both phases are shown in Fig.1. In Table 1 we report relevant properties such as the structural parameters, the Fe magnetic moment and the energy gap calculated using the PBE and HSE functionals. We also report the values using the B1-WC functional taken from Ref.Goffinet et al. (2009)
First of all, HSE reduces the lattice parameter with respect to PBE, giving a much better agreement with the experimental value: the error decreases from 1 %(PBE) to 0.3 %(HSE). As a consequence, the unit cell volume also shrinks, getting closer to the experimental value. The rhombohedral angle, , is almost insensitive to the applied functional. Thus, the inclusion of Fock exchange makes the structure more compact, i.e. the lattice constant decreases. Note that the B1-WC functional gives too small lattice constant and too small equilibrium volume as compared to HSE, worsening the comparison with the experiments. There is a very good agreement between the relaxed coordinates of the Wyckoff positions and the experimental ones using HSE, while the PBE as well as the B1-WC functional give slightly worse results ( the only exception being the component of the oxygen atoms in the site symmetry). In the experimental structure, the BiO6 cage is strongly distorted with three coplanar nearest neighbors (NNs) lying above Bi along [111] at 2.270 Å (d, refers to short) and three NNs sitting below at 2.509 Å (d, refers to long). From Table 1, we see that the theoretical NNs distances compare well with experiments, with errors from 1 % to 4 % (PBE), from 3 % to 5 % (B1-WC) and 2 % (HSE). The O--O bond angle would be 180∘ in the ideal cubic perovskite. In this system, it buckles to an experimental value of 165.03∘. The HSE value (164.56∘) is close to PBE, and in both cases, they are slightly underestimated with respect to experiment. The B1-WC angle, on the other hand, is clearly underestimated. Overall, the predicted HSE values clearly are in much better agreement with experiments than those calculated using the PBE or B1-WC functional.
III.2 Electronic and magnetic properties
Let us consider now the magnetic and electronic properties. As shown in Table 1, the calculated local moments are generally very similar for all the functionals, and close to the experimental value. In particular, the HSE local moment is slightly larger than PBE , suggesting a more localized picture of the spin-polarized electrons. The calculated PBE (HSE) electronic energy gap is 1.0 (3.4) eV. The expected band-gap opening using hybrid functionals can be understood as follows: the exact exchange acts on occupied states only, correcting them for the self-interaction, thus shifting downwards the occupied valence bands. In turn, this has a clear interpretation: within the Hartree-Fock approximation for the ground state of an N electron system, the potential felt by each of the N electrons in the ground state is that due to N-1 other electrons, i.e. they feel a more attractive ionic potential. On the other hand, for unoccupied states, the potential is that due to the N occupied orbitals, so these orbitals effectively experience a potential from one more electron, the latter screens the ionic potential which in turn becomes less attractive. Therefore, the unoccupied states are shifted upwards, opening the gap.
As for the experimental energy gap for BiFeO3, the situation is not clear. There have been several measurements of the band gap using UV-visible absorption spectroscopy and ellipsometry on polycrystalline BFO films, epitaxial BFO films grown by pulsed-laser deposition, nanowires, nanotubes, and bulk single crystals. Reported band-gap values vary from 2.5 to 2.8 eV.Gavriliuk et al. (2008); Palai et al. (2008); Basu et al. (2008); Kumar et al. (2008); Kanai et al. (2003); Gao et al. (2006) An estimate gives 2.5 eV from the optical absorption spectra by Kanai et al.Kanai et al. (2003) and Gao et al. Gao et al. (2006). From the theoretical side, there is a spread of values: a small gap of 0.30-0.77 eV using LSDA,Neaton et al. (2005) or from 0.3 to 1.9 eV using “LDA+U”, depending on the value of UNeaton et al. (2005); 0.8-1.0 eV using PBE (WC) GGA functional;Bilc et al. (2008) 3.0-3.6 eV using B1-WC and B3LYP hybrid functionals.Bilc et al. (2008) Thus, a parameter-free theoretical reference value is clearly needed. The most accurate (but expensive) method is the GW approximation.Hybertsen and Louie (1986) Here, we provide for the first time, the value of the BFO energy gap based on the GW method.
First of all, at the PBE level, we estimate an energy gap of 1.0 eV. When introducing the exact exchange (HSE), the gap opens up to Eg=3.4 eV. Upon inclusion of many-body effects (G0W0), it opens even more (Eg=3.8 eV). Finally, when including vertex corrections, we find that the gap reduces to 3.3 eV. Remarkably, vertex corrections almost confirm the HSE band gap. This is perfectly in line with recent worksJanesko et al. (2009) where it is argued that HSE band gaps represent a very accurate estimate due to partial inclusion of the derivative discontinuity of the exchange-correlation functional.Kümmel and Kronik (2008) Clearly, effects beyond bare DFT are important in this compound. Our results show that hybrid-functional calculations give already a very good estimate at a lower computational cost compared to GW. In this respect, we mention the very recent experimental study based on resonant soft x-ray emission spectroscopyHiguchi et al. (2008) where the band gap corresponding to the energy separation between the top of the O valence band and the bottom of the Fe conduction band is 1.3 eV. The discrepancy between theory and experiment may be due to the presence of defects in the experimental sample as well as to the resolution involved in photoemission spectra. We hope to stimulate further experimental work to test our first-principles prediction of the energy gap of this important multiferroic material.
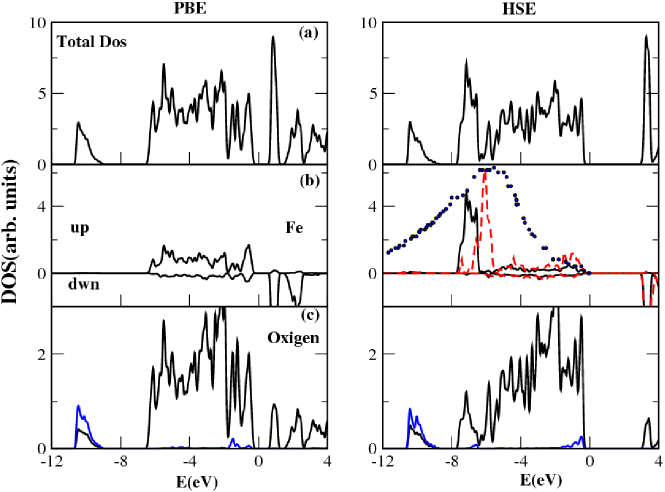
In Fig. 2 we show the Density of States (DOS) for the optimized atomic structure. Let’s focus on the PBE DOS. The lowest states at 10 eV are Bi hybridized with O states (blue curve). Above 6 eV there are hybridized O and Fe states. The Fe states extend in the conduction band as well; the Bi states can be found above 4 eV. As for the HSE DOS, we see that the conduction bands are shifted upwards, opening the valence-conduction gap. There is a change in the spectral distribution above 8 eV: a valley appears around 6 eV and the lower shoulder of the peak increases its spectral weight. It is easy to trace back the above changes to modifications of the majority Fe states, as shown in the panel beneath: while in PBE the band states in the vicinity of the top of the valence band have predominantly character, in HSE the spectral weight of the Fe states is concentrated far away from the top of the valence band. This can be interpreted as a change from a more itinerant picture to a more localized description of the Fe states going from PBE to HSE. In Fig. 2, we also include the spectral distribution of the Fe states derived from a recent experimental workHiguchi et al. (2008) (see dotted lines): the position of the main HSE Fe peak almost perfectly matches the experimental PDOS, although the bandwidth of the calculated DOS is different because of energy resolution, etc. Indeed, if we include the Fe DOS calculated using G0W vertex corrections, the agreement between the theoretical and experimental peak position becomes excellent. Note that the HSE and G0WVertex peak position are very close to each other, confirming the accurate HSE description of the BiFeO3 electronic structure. In passing we note that while DFT+ gives a better estimate of the Fe peak position,Neaton et al. (2005) the energy gap is still underestimated with respect our GW calculation.
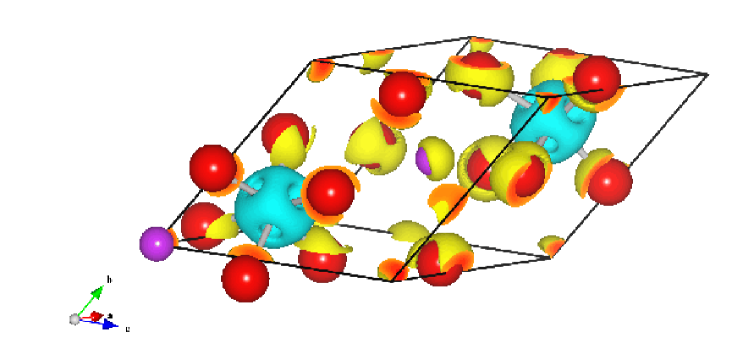
We previously mentioned that HSE may change the ionic/covalent character in this compound. To support this, in Fig. 3 we show the difference between the PBE and HSE charge density, calculated at fixed geometry. In a purely ionic description, all the valence electrons would be located on the oxygens, acting as “electron sinks”, and the cations would donate their nominal valence charge. The more the electrons populate the anions, or conversely, the more the electrons depopulate the cations, the more the picture shows an ionic character. Fig. 3 confirms the trend discussed before: upon adding a fraction of exact exchange to the PBE functional, the electronic charge at the cations decreases, i.e. is positive (grey areas in Fig. 3), while the electronic charge at the anions increases i.e. is negative (yellow areas in Fig. 3). Thus, the introduction of exact-exchange generates a flux of charge from the cations towards the anions, clearly shown in Fig. 3, increasing the ionicity of the compound.
In order to discuss more quantitatively these effects, we perform a Bader analysis of the electronic charge.Henkelman et al. (2006); Sanville et al. (2007); Tang et al. (2009) The atom in molecules (AIM) theory is a well established analysis tool for studying the topology of the electron density and suitable for discussing the ionic/covalent character of a compound. The charge () enclosed within the Bader () volume is a good approximation to the total electronic charge of an atom. In Table 2 we report and calculated for Bi, Fe, and O at a fixed geometric structure, i.e. HSE geometry. This is needed in order to avoid different volumes for the normalization of the charge in the unit cell and for highlighting the electronic structure modifications due to the exact exchange. Furthermore, we consider only the valence charge for our analysis (although one should formally include also the core charge, we do not expect variations as far as the trends are concerned). Let us first consider the cations: the Bader charge and volume are larger in PBE than in HSE. For the anions, the opposite holds true. This is not unexpected and in agreement with intuition: upon introducing Fock exchange, the system evolves towards a more ionic picture, through a flux of charge from cations towards anions, which reduces (increases) the “size” of the cations (anions) when going from the PBE to the HSE solution. Finally, we note that a different degree of ionicity modifies the calculated equilibrium lattice parameter: in a partially covalent material, such as BiFeO3,Ravindran et al. (2006) the increased ionicity changes the different net charges generating a higher Madelung field, which is an important contribution to the bonding in the solid, and contracts the equilibrium structure.Corà et al. (2004); Corà (2005)
III.3 Ferroelectric properties
Let’s finally focus on the electric polarization. In Table 4, we report the ionic and electronic contributions to the difference of ferroelectric polarization between the polar () and non-polar () both in PBE and HSE. In order to disentangle the purely electronic effects from the ionic ones upon introduction of Fock exchange, we report also the PBE(HSE) electronic contribution calculated at fixed HSE(PBE) geometry.
As a general comment, we note that a large polarization of 100 along (111) for bulk BFO has been reported experimentally by new measurements on high-quality single crystals.Lebeugle et al. (2007) in good agreement with our calculated values. In what follows, we will mainly focus on the differences between PBE and HSE calculations. Note that the unit cell volume is different for PBE and HSE, as shown in Table 1.
First, we note that the polarization calculated according to the point charge model (Ppcm) is closer to Ptot at the HSE than at the PBE level. This confirms that the HSE description of BFO points towards an ionic picture, i.e. by decreasing the covalency effects. The calculated total polarization Ptot is 105 using PBE and 110 using HSE, i.e. HSE predicts an increase of total electric polarization. The occurrence of ferroelectricity in BiFeO3 is usually discussed in terms of “polarizable lone pair” carried by the Bismuth atom. This has a physical interpretation in terms of cross gap hybridization between occupied O states and unoccupied Bi states.Singh et al. (2005, 2006); Ghita et al. (2005); Suewattana and Singh (2006); Ravindran et al. (2006). Intuitively, the larger the energy gap, the lower the polarization should be. Accordingly, one might expect HSE to reduce the polarization compared to PBE because of the larger energy gap. We will show below that this is not in contraddiction with the results of Table 1. In fact, let’s consider Ptot calculated at the same atomic structure (for example at the PBE relaxed structure of the paraelectric and ferroelectric phases) but using both PBE and HSE. We denote the former as P, the latter as P. Note that the ionic contributions is of course the same for both cases. From Table 1, we have P=105.6 and P=103.2 , i.e. a decrease of total polarization is found in going from PBE to HSE for the same ionic structure. A similar behavior is found in opposite conditions: for the HSE ionic structure, P=110.3 and P=112.6 . Thus, keeping the same volume and including Fock exchange, the polarization reduces as expected. On the other hand, when we evaluate the total polarization at the appropriate equilibrium and relaxed structures using PBE and HSE , the ionic contribution also varies and one loses a direct connection between the increase of the energy gap and the decrease of total polarization. In our case, the total polarization, when evaluated at the appropriate equilibrium volume for each functional, increases from PBE to HSE. This clearly points out a strong volume-dependence of the polarization, therefore calling for a correct estimate of the volume (as provided by HSE).
IV HoMnO3:results and discussions
IV.1 Paraelectric AFM-A phase
IV.1.1 Structural properties
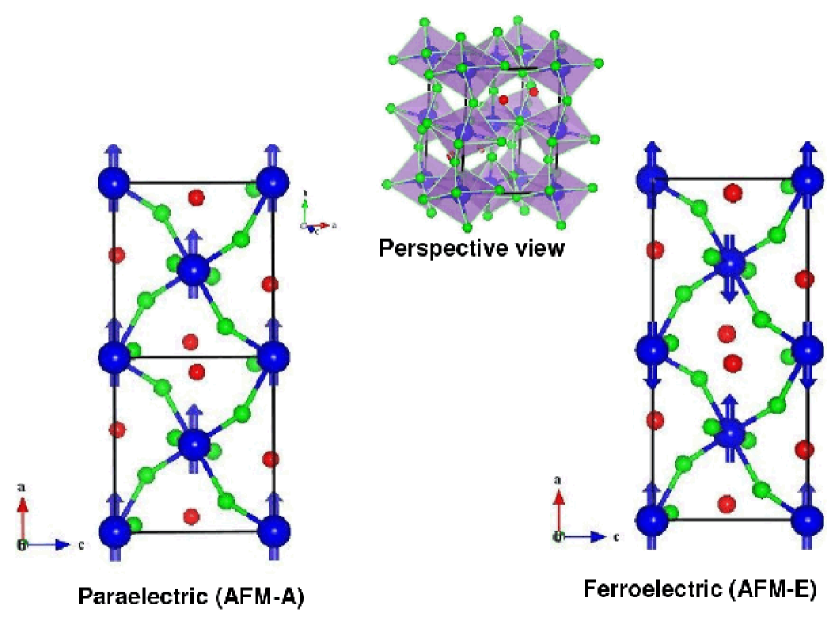
An extended review of the main properties of orthorhombic HoMnO3 within a standard PBE approach can be found in Ref. Yamauchi et al. (2008) where it is also shown that the inclusion of the correction worsens the structural properties. Therefore, in this paper, we will focus on the comparison between the predictions of HSE with respect to PBE results. In Fig. 4 we show the perspective view of HoMnO3 and the paraelectric (AFM-A) and ferroelectric (AFM-E) spin configurations in the plane.
In Table 3 we report the optimized structural parameters in the AFM-A magnetic configuration, calculated using PBE and HSE. The in-plane short () and long () Mn-oxygen bond-lengths get closer to experimental values using HSE; on the other hand, the out-of-plane length is slightly overestimated with respect to the PBE and the experimental value. In order to quantify structural distortions, the Jahn-Teller (JT) distortion vector is often introduced. From Table 3, it is thus clear that the HSE functional improves the JT distortion upon the PBE description: the magnitude of Q is Q=0.55 Å and 0.61 Å using PBE and HSE, respectively, whereas the experimental value is 0.59 Å. As far as the structural angles are concerned, we first notice that the GdFeO3-like tilting () in the Mn-O6 octahedron is slightly overestimated using the hybrid functional: the deviation from the experimental angle is 3.7 (PBE) and 5.0 % (HSE) with the Mn-O-Mn in-plane angles calculated using HSE slightly reduced with respect to PBE. We note, however, that the experimental uncertainty on the angles may be up to 1∘, Alonso et al. (2000) due to synthesis problems of ortho-HoMnO3. Munoz et al. (2001); Alonso et al. (2000) The octahedral tilting is related to the ionic size of the rare-earth ion:Lufaso and Woodward (2004); Tachibana et al. (2007) the tilting increases when the radius of the rare-earth atom decreases (for example, from La to Lu in the manganites series).Yamauchi et al. (2008) In this respect, the tendency towards a larger octahedral tilting, upon inclusion of exact-exchange-functional, goes hand in hand with the reduced ionic size of Ho ion when going from PBE to HSE. As in the previous case, we performed a Bader analysis of the valence charge distribution. Results are shown in Table 2: as expected, the ”size“ of the Ho ion is reduced within HSE. According to our previous discussion, the ionic/covalent character of the charge density is modified by HSE in favor of a more ionic picture. This will have important consequences for the electronic polarization, as shown below.
IV.1.2 Electronic properties
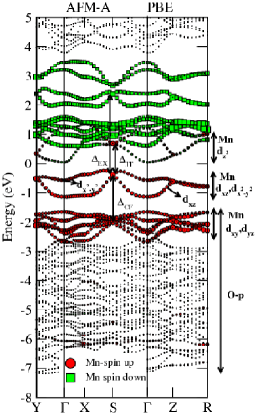
In Fig. 5 we show the band structure for the AFM-A phase as calculated using standard PBE (left panel) as well as HSE (right panel) along the main symmetry lines. The PBE band structure shows a small gap equal to 0.2 eV. The bands below 2 eV are mainly oxygen states and those 2-3 eV below (above) the Fermi level are mainly spin-up (spin-down) Mn states. There is also a considerable weight of the Mn states in the oxygen bands near the top of the valence band.333Although the set of “” or “” orbitals is well defined in a local coordinate frame centered on each Mn ion, this is not any more true when using the standard orthorhombic system as a global coordinate frame, due to different tilting angles and distortions on neighboring MnO6 cages. Thus, our discussion for the Mn states has only a qualitative meaning.
The group of bands between 1 and 2 eV are mainly , with some small weight of . The two bands just below the Fermi energy are mainly -like with some weight; at ,, they become degenerate. Higher in energy, between 0 and 1 eV, there are two more bands showing a similar behavior, i.e. degenerate at ,,, almost degenerate along - and with a similar overall band dispersion. Even higher in energy, the are the Mn minority states. From Fig. 5, we can extract the JT splitting ( of the “” states), the CF splitting ( between “” and “”), and the exchange splitting ( between majority and minority spin states, evaluated at the point, for simplicity). We thus have =1.05, =2.34, and =2.75 eV. The comparison between the PBE and HSE band structure highlights some differences. First we note that the oxygen bands are slightly shifted to lower binding energy together with the Mn , bands. On the other hand, the average position of occupied Mn , bands remain almost unchanged, but the band-width increases. The latter effect is mainly shown by the lowest of the two bands, i.e. the -like band. As well known,Martin (2004) Hartree-Fock hamiltonians naturally leads to larger band-width and down-shift of electronic states, even for simple homogeneous systems. Thus, the larger band-widths obtained by HSE can not be simply connected to a stronger hybridization, because it is an intrinsic feature of Fock exchange for every electronic state. Indeed, we will show below that the hybridization is expected to decrease using HSE.
is evaluated as 3.4 eV, larger than in the PBE case, suggesting a stronger local distortion related to the Jahn-Teller instability. The increase of the JT splitting is linked to the increase of the energy gap as well, which is now 2.7 eV. The exchange splitting, =4.6 eV, is also larger along with an increased local Mn moments with respect to PBE. Note, that the enhancement of Jahn-Teller distortion by HSE is not unexpected. In fact, it was previously suggested that the HSE functional is able to reveal the Jahn-Teller effect for Mn+4 through a symmetry broken solution giving rise to an orbitally ordered state and consequent Jahn-Teller distortion.Stroppa and Kresse (2009) The larger is mainly driven by a purely electronic effect due to the inclusion of Fock-exchange. Infact, by calculating the PBE self-consistent charge density on top of the HSE ionic structure, becomes 1.2 eV, i.e. nearly equal to the previous PBE case. Thus, we expect HSE to cause a rearrangement of the charge density that will reduce the electronic contribution to the electronic polarization when considering the polar phase. This can be understood as follows. The increase of the Jahn-Teller splitting goes hand in hand with the increase of the energy gap: the larger the gap, the smaller the dielectric constant is, i.e. the smaller the screening is. Now, let us consider the fixed ionic configuration of the paraelectric phase: the charge in the non-centrosymmetric spin arrangement can be thought as a “small” perturbation of the centrosymmetric one upon the application of the “internal” electric field. The electronic charge will respond to such a field, and each electronic state will change assuming a polarized configuration. If the gap is large, the “electric field” will hardly mix the electronic states in the valence band with the electronic states in the conduction band, since in second order perturbation theory approach the denominator will be of order of the band gap energy, so that the electrons don’t polarize much, i.e. the charge distribution becomes more “rigid”. In conclusion, we expect the electronic contribution to the electric polarization to decrease upon introduction of Fock exchange. This will be confirmed by our calculations. Note that the above reasoning is not appropriate for BFO where the polarization is mainly due to ionic displacements.
IV.2 AFM-E phase
IV.2.1 Structural properties
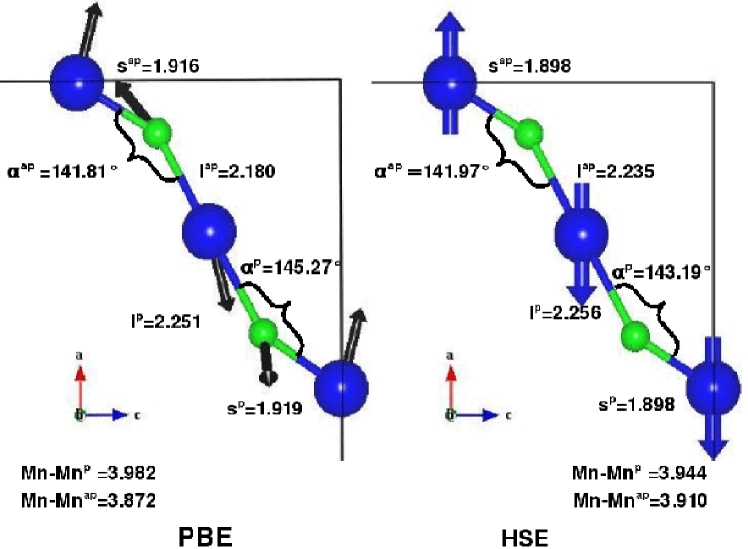
Let us focus on the AFM-E phase, where the resulting symmetry is lowered by the spin configuration with respect to the AFM-A spin arrangements by removing the inversion symmetry. In Fig. 6, we show the relevant structural internal parameters, for the relaxed PBE and HSE structure, by considering the Mn-O-Mn-O-Mn chain (compare Fig. 6 and Fig. 4). The Mn-O bond-lengths do not show significant differences between the parallel and antiparallel spin configuration in PBE as well in HSE. On the other hand, the long Mn-O bond lengths are mostly affected: their difference, - in PBE is about 0.07 Å and decreases to 0.02 Å upon introduction of exact exchange. At the same time, the angle changes: decreases while remains almost equal to the PBE value. The results can be interpreted as follows: bare PBE is expected to overestimate hybridization effects between oxygen -states and Mn -states, therefore inducing a stronger rearrangement of ionic positions consistent with a “softer” structure when moving from, say a centrosymmetric A-type to a ferroelectric E-type phase. Viceversa, upon introduction of correlation effects, the reduced hybridization is expected to lead to a more “rigid” ionic arrangement. Indeed, this is evident when comparing the difference between - , which drastically reduces upon introduction of HSE with respect to PBE. We recall that, ultimately, it is this difference that gives rise to the ionic polarization, as clearly shown in Fig. 2 b) of Ref.Picozzi et al. (2007). We can therefore anticipate that a reduction of the polarization will occur upon introduction of HSE, as discussed in detail below. What is worthwhile noting is that the Mn-Mn distances in PBE dramatically depends on their having parallel ( = 3.98 Å) or antiparallel spins ( = 3.87 Å), so that = 0.11 Å. However, this dependence is smoothed upon introduction of HSE, so that the difference in Mn-Mn distance strongly reduces to = 0.03 Å. In general, the marked (weak) dependence of the structural properties within PBE (HSE) is consistent with a strong (small) efficiency of the double–exchange mechanism, which ultimately relies on the hybridization and hopping integral.
IV.2.2 Electronic and magnetic properties
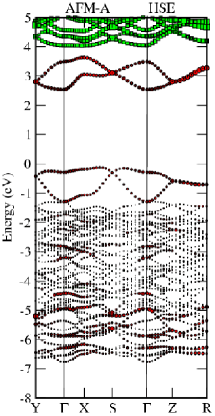
The band-structure of the AFM-E is quite similar to the A-type and is therefore not shown. However, there are some small differences which we comment on. As expected, the increase of the number of the AFM bonds of each Mn with its four neighbors associated with the change of the magnetic state going from AFM-A to AFM-E type results in a narrowing of all bands. This is further enhanced by HSE due to the reduced hopping upon introduction of exact exchange, as expected. Furthermore, the increase of the band gap is facilitated by the interplay of the crystal distortion, which is generally enhanced by HSE, with the AFM arrangement of spins. As expected, the energy gap is the largest in the AFM-E-HSE band structure, being now 3 eV. The evaluated at point, is also the largest in this case, being 3.7 eV. Before turning our attention to the electronic polarization, we discuss the magnetic properties. First of all, we found that the AFM-E is more stable than the AFM-A by 4 meV/cell in the HSE formalism. Note that this value has been obtained using the same simulation cell for both phases, therefore reducing the influence of numerical errors. Although the relative stability is still comparable with the numerical accuracy, it is indeed consistent with experiments.Munoz et al. (2001); Alonso et al. (2000) In AFM-E-PBE, the Mn moment is 3.4 which induces a small spin-polarization on the oxygen equal to 0.04 . In AFM-E-HSE, the Mn moment slightly increases to 3.7 and the oxygen moment slightly decreases to 0.01 : the increased localization of the Mn states correlates with the increased Manganese spin moment and goes hand by hand with the decreased - hybridization and a decreased induced spin moment on oxygens.
IV.2.3 Ferroelectric properties
Finally, we calculated the ferroelectric polarization by considering the AFM-A as the reference paraelectric structure. The results show that the polarization (both the electronic and ionic terms) strongly reduces upon introduction of HSE. However, it is remarkable that the total P is still of the order of 2 : this confirms HoMnO3 as the magnetically-induced ferroelectric having the highest polarization predicted so far. Our estimate is in very good agreement with model Hamiltonian calculations.Sergienko et al. (2006) The comparison between theory and experiments as far as the electric polarization is concerned is still a matter of debate. Whereas earlier studies predicted negligible values for polycrystalline HoMnO3 samples,Lorenz et al. (2007) more recent studies for TmMnO3 in the E-type (where the exchange-striction mechanism is exactly the same as in HoMnO3) point to a polarization which could exceed 1 ,Pomjakushin et al. (2009) in excellent agreement with our predicted HSE value.
The reasons why we expect a reduction upon introduction of HSE have been already discussed in previous paragraphs and can be traced back to the reduced hybridization. As in the case of BFO, we disentangle the structural and electronic effects, by using the HSE (PBE) geometry with the PBE (HSE) functional (cfr. Table 4). What we infer from these “ad-hoc”-built systems is that the use of HSE dramatically reduces the electronic contribution (cfr in PBE and HSE(PBE)), i.e. reduced by 2.5 . Less important, though still appreciable, seem to be the ionic displacements: their dipole moment is reduced by 1.5 when comparing in HSE and HSE(PBE). This is consistent with what shown approximately by Ppcm.
V Conclusions
In this work, we have revised the two workhorse materials of the exponentially growing field of multiferroics, namely BiFeO3 for proper MFs and HoMnO3 for improper MFs by using the screened hybrid functional (HSE).
From our study, several important points emerge. For BFO: i) the structural, electronic and magnetic properties well agree with experiments; ii) the ferroelectric polarization agrees with reported values in the literature; iii) even if PBE allows the description of ferroelectric properties by opening an energy gap, it is by no means satisfactory in correctly describing all the properties on the same footing. On the other hand, HSE improves the PBE and LDA+ description; this is clearly shown by benchmark calculations using the most advanced and accurate state-of-the art GW+vertex corrections (which basically confirm the HSE results); iv) the previous comment, and very recent studiesJanesko et al. (2009) suggests that optical properties, so far not investigated at all by ab–initio calculations for BFO, can be properly addressed within HSE. v) finally, we note that the electronic polarization increases upon introduction of exact exchange. For HMO, we note that: i) the HSE results are in good agreement with experiments when available; ii) the Jahn-Teller effect is correctly described in agreement with experiment; iii) despite a reduction of the polarization value with respect to PBE, HoMnO3 still shows the highest predicted among magnetically-induced ferroelectrics.
We have shown that introduction of ”correlation“ effects may both enhance the polarization or reduce it: the former effect will most likely occur for proper MFs, and the latter for improper MFs, e.g. magnetically driven. Note that an increase of HSE polarization with respect to LDA, for example, is also found by Wahl et al.Wahl et al. (2008) for BaTiO3, a standard ferroelectric compound. Also for BiFeO3, an increase of polarization using DFT+ has been noticed.Ravindran et al. (2006); Neaton et al. (2005); Ederer and Spaldin (2005) The increase of ferroelectric polarization when including a fraction of exact exchange and using the theoretical equilibrium volume has been reported also for simple ferrolectric compound such as KNbO3.Corà et al. (2004)
One final comment is in order: although the HSE results certainly point towards a truly realistic description, it is still possible that, to some extent, the good performances of HSE may be material-dependent, i.e. the universal 1/4 fraction of the exact exchange may be not appropriate for some specific material. What is certainly true is that the predictive capability of HSE, combined with its nowadays affordable computational costs, make the functional an attractive choice for the study of a wide range of materials, from well-behaved insulators to doped semiconductors exhibiting magnetic ordering, multifunctional complex oxides of interest for many industrial applications therefore representing a very good starting point for materials design.
Acknowledgements.
The research leading to these results has received funding from the European Research Council under the European Community, 7th Framework Programme - FP7 (2007-2013)/ERC Grant Agreement n. 203523. A.S. would like to thank G. Kresse for kind assistance for the GW calculations and M. Marsman for useful discussions. Furthermore, A.S. thanks L. Kronik (Weizmann Institute) for helpful comments. The authors acknowledge kind hospitality at the S3 CNR-INFM National Center in Modena after the catastrophic earthquake of April 6th 2009 in L’Aquila. The computational support by Caspur Supercomputing Center in Roma and technical assistance by Dr. L. Ferraro is gratefully acknowledged. Figures have been done by using the VESTA package.Koichi and Fujio (2008)References
- Khomskii (2009) D. I. Khomskii, Physics, 2009, 2, 20.
- Kimura et al. (2003) T. Kimura, T. Goto, H. Shintani, K. Ishizaka, T. Arima and Y. Tokura, Nature (London), 2003, 426, 55.
- Hur et al. (2004) N. Hur, S. Park, P. A. Sharma, J. S. Ahn, S. Guha and S.-W. Cheong, Nature (London), 2004, 429, 392.
- Cheong and Mostovoy (2007) S.-W. Cheong and M. Mostovoy, Nat. Mat., 2007, 6, 13.
- Wang et al. (2005) J. Wang, J. Neaton, H. Zheng, V. Nagarajan, S. B. Ogale, B. Liu, D. Viehland, V. Vaithyanathan, D. G. Schlom, U. V. Waghmare, et al., Science, 2005, 307, 1203b.
- Fiebig (2005) M. Fiebig, J. Phys. D: Appl. Phys., 2005, 38, R123.
- Spaldin and Fiebig (2005) N. A. Spaldin and M. Fiebig, Science, 2005, 309, 391.
- Kümmel and Kronik (2008) S. Kümmel and L. Kronik, Rev. Mod. Phys., 2008, 80, 3.
- Bachelet and Christensen (1985) G. B. Bachelet and N. E. Christensen, Phys. Rev. B, 1985, 31, 879.
- Filippetti and Hill (2002) A. Filippetti and N. A. Hill, Phys. Rev. B, 2002, 65, 195120.
- Aulbur et al. (1999) W. G. Aulbur, L. Jónsson and J. W. Wilkins, Solid State Physics, 1999, 54, 1.
- Aryasetiawan and Gunnarsson (1998) F. Aryasetiawan and O. Gunnarsson, Rep. Prog. Phys., 1998, 61, 237.
- Anisimov et al. (1997) V. I. Anisimov, F. Aryasetiawan and A. I. Lichtenstein, J. Phys.: Condens. Matter, 1997, 9, 767.
- Anisimov et al. (1991) V. I. Anisimov, J. Zaanen and O. K. Andersen, Phys. Rev. B, 1991, 44, 943.
- Solovyev et al. (1994) I. V. Solovyev, P. H. Dederichs and V. I. Anisimov, Phys. Rev. B, 1994, 50, 16861.
- Perdew and Zunger (1981) J. P. Perdew and A. Zunger, Phys. Rev. B, 1981, 23, 5048.
- Filippetti and Spaldin (2003) A. Filippetti and N. A. Spaldin, Phys. Rev. B, 2003, 67, 125109.
- Droghetti et al. (2008) A. Droghetti, C. D. Pemmaraju and S. Sanvito, Phys. Rev. B, 2008, 78, 140404(R).
- Rohrbach et al. (2004) A. Rohrbach, J. Hafner and G. Kresse, Phys. Rev. B, 2004, 69, 075413.
- Kornev et al. (2007) I. A. Kornev, S. Lisenkov, R. Haumont, B. Dkhil and L. Bellaiche, Phys. Rev. Lett., 2007, 99, 227602.
- Svane and Gunnarsson (1990) A. Svane and O. Gunnarsson, Phys. Rev. Lett., 1990, 65, 1148.
- Pemmaraju et al. (2007) C. D. Pemmaraju, T. Archer, D. Sánchez-Portal and S. Sanvito, Phys. Rev. B, 2007, 75, 045101.
- Stengel and Spaldin (2008) M. Stengel and N. A. Spaldin, Phys. Rev. B, 2008, 77, 155106.
- Stephens et al. (1994) P. J. Stephens, F. J. Devlin, C. Chabalowski and M. J. Frisch, J. Phys. Chem., 1994, 98, 11623.
- Adamo and Barone (1999) C. Adamo and V. Barone, J. Chem. Phys., 1999, 110, 6158.
- Ernzerhof and Scuseria (1999) M. Ernzerhof and G. E. Scuseria, J. Chem. Phys., 1999, 110, 5029.
- Krukau et al. (2006) A. V. Krukau, O. A. Vydrov, A. F. Izmaylov and G. E. Scuseria, J. Chem. Phys., 2006, 125, 224106.
- Muscat et al. (2001) J. Muscat, A. Wander and N. M. Harrison, Chem. Phys. Lett., 2001, 342, 397.
- Heyd et al. (2005) J. Heyd, J. E. Peralta, G. E. Scuseria and R. L. Martin, J. Chem. Phys., 2005, 123, 174101.
- Paier et al. (2006) J. Paier, M. Marsman, K. Hummer, G. Kresse, I. C. Gerber and J. A. Ángyán, J. Chem. Phys., 2006, 124, 154709.
- Hay et al. (2006) P. J. Hay, R. L. Martin, J. Uddin and G. E. Scuseria, J. Chem. Phys., 2006, 125, 034712.
- Prodan et al. (2006) I. D. Prodan, G. E. Scuseria and R. L. Martin, Phys. Rev. B, 2006, 73, 045104.
- Prodan et al. (2007) I. D. Prodan, G. E. Scuseria and R. L. Martin, Phys. Rev. B, 2007, 76, 033101.
- Marsman et al. (2008) M. Marsman, J. Paier, A. Stroppa and G. Kresse, J. Phys.: Condens. Matter., 2008, 20, 064201.
- Stroppa et al. (2007) A. Stroppa, K. Termentzidis, J. Paier, G. Kresse and J. Hafner, Phys. Rev. B, 2007, 76, 195440.
- Stroppa and Kresse (2008) A. Stroppa and G. Kresse, New J. Phys., 2008, 10, 063020.
- Stroppa and Kresse (2009) A. Stroppa and G. Kresse, Phys. Rev. B (R), 2009, 79, 201201(R).
- Becke (1993) A. D. Becke, J. Chem. Phys., 1993, 98, 1372.
- Ernzerhof et al. (1996) M. Ernzerhof, K. Burke and J. P. Perdew, J. Chem. Phys., 1996, 105, 9982.
- Janesko et al. (2009) B. J. Janesko, T. M. Henderson and G. Scuseria, Phys. Chem. Chem. Phys., 2009, 11, 443.
- Heyd et al. (2003) J. Heyd, G. E. Scuseria and M. Ernzerhof, J. Chem. Phys., 2003, 118, 8207.
- Heyd et al. (2006) J. Heyd, G. E. Scuseria and M. Ernzerhof, J. Chem. Phys., 2006, 124, 219906.
- Wahl et al. (2008) R. Wahl, D. Vogtenhuber and G. Kresse, Phys. Rev. B, 2008, 78, 104116.
- Perdew et al. (1996) J. P. Perdew, K. Burke and M. Ernzerhof, Phys. Rev. Lett., 1996, 77, 3865.
- Bilc et al. (2008) D. I. Bilc, R. Orlando, R. Shaltaf, G.-M. Rignanese, J. Íñiguez and P. Ghosez, Phys. Rev. B, 2008, 77, 165107.
- Goffinet et al. (2009) M. Goffinet, P. Hermet, D. I. Bilc and P. Ghosez, Phys. Rev. B, 2009, 79, 014403.
- Wu and Cohen (2006) Z. Wu and R. E. Cohen, Phys. Rev. B, 2006, 73, 235116.
- Heifets et al. (2006) E. Heifets, E. Kotomin and V. A. Trepakov, J. Phys.: Condens. Matter, 2006, 18, 4845.
- Picozzi et al. (2007) S. Picozzi, K. Yamauchi, B. Sanyal, I. A. Sergienko and E. Dagotto, Phys. Rev. Lett., 2007, 99, 227201.
- Munoz et al. (2001) A. Munoz, M. Casáis, J. A. Alonso, M. J. Martínez-Lope, J. L. Martínez and M. Fernández-Díaz, Inorg. Chem., 2001, 40, 1020.
- Kresse and Furthmüller (1996) G. Kresse and J. Furthmüller, Phys. Rev. B, 1996, 54, 11169.
- Blöchl (1994) P. E. Blöchl, Phys. Rev. B, 1994, 50, 17953.
- Kresse and Joubert (1999) G. Kresse and D. Joubert, Phys. Rev. B, 1999, 59, 1758.
- Boysen and Altorfer (1994) H. Boysen and F. Altorfer, Acta Cryst. B, 1994, 50, 405.
- Neaton et al. (2005) J. B. Neaton, C. Ederer, U. V. Waghmare, N. A. Spaldin and K. M. Rabe, Phys. Rev. B, 2005, 71, 014113.
- King-Smith and Vanderbilt (1993) R. D. King-Smith and D. Vanderbilt, Phys. Rev. B, 1993, 47, 1651.
- Vanderbilt and King-Smith (1993) D. Vanderbilt and R. D. King-Smith, Phys. Rev. B, 1993, 48, 4442.
- Resta (1994) R. Resta, Rev. Mod. Phys., 1994, 66, 899.
- Hybertsen and Louie (1986) M. S. Hybertsen and S. G. Louie, Phys. Rev. B, 1986, 34, 5390.
- Fuchs et al. (2007) F. Fuchs, J. Furthmuller, F. Bechstedt, M. Shishkin and G. Kresse, Phys. Rev. B, 2007, 76, 115109.
- Shishkin and Kresse (2006) M. Shishkin and G. Kresse, Phys. Rev. B, 2006, 74, 035101.
- Shishkin and Kresse (2007) M. Shishkin and G. Kresse, Phys. Rev. B, 2007, 75, 235102.
- Shishkin et al. (2007) M. Shishkin, M. Marsman and G. Kresse, Phys. Rev. Lett., 2007, 99, 246403.
- Rinke et al. (2005) P. Rinke, A. Qteish, J. Neugebauer, C. Freysoldt and M. Scheffler, New J. Phys., 2005, 7, 125.
- Kubel and Schmid (1990) F. Kubel and H. Schmid, Acta Crystallogr., Sect. B: Struct. Sci., 1990, B46, 698.
- Gavriliuk et al. (2008) A. G. Gavriliuk, V. V. Struzhkin, I. S. Lyubutin, S. G. Ovchinnikov, M. Y. Hu and P. Chow, Phys. Rev. B, 2008, 77, 155112.
- Palai et al. (2008) R. Palai, R. S. Katiyar, H. Schmid, P. Tissot, S. J. Clark, J. Robertson, S. A. T. Redfern, G. Catalan and J. F. Scott, Phys. Rev. B, 2008, 77, 014110.
- Basu et al. (2008) S. R. Basu, L. W. Martin, Y. H. Chu, M. Gajek, R. Ramesh, R. C. Rai, X. Xu and J. L. Musfeldt, Appl. Phys. Lett., 2008, 92, 091905.
- Kumar et al. (2008) A. Kumar, R. C. Rai, N. J. Podraza, S. Denev, M. Ramirez, Y. H. Chu, L. W. Martin, J. Ihlefeld, T. Heeg, J. Schubert, et al., Appl. Phys. Lett., 2008, 92, 121915.
- Kanai et al. (2003) T. Kanai, S. Ohkoshi and K. Hashimoto, J. Phys. Chem. Solids, 2003, 64, 391.
- Gao et al. (2006) F. Gao, Y. Yuan, K. F. Wang, X. Y. Chen, F. Chen and J. M. Liu, Appl. Phys. Lett., 2006, 89, 102506.
- Higuchi et al. (2008) T. Higuchi, Y.-S. Liu, P. Yao, P.-A. Glans, J. Guo, C. Chang, Z. Wu, W. Sakamoto, N. Itoh, T. Shimura, et al., Phys. Rev. B, 2008, 78, 085106.
- Henkelman et al. (2006) G. Henkelman, A. Arnaldsson and H. Jónsson, Comput. Mater. Sci., 2006, 36, 254.
- Sanville et al. (2007) E. Sanville, S. D. Kenny, R. Smith and G. Henkelman, J. Comp. Chem., 2007, 28, 899.
- Tang et al. (2009) W. Tang, E. Sanville and G. Henkelman, J. Phys.: Condens. Matter, 2009, 21, 084204.
- Ravindran et al. (2006) P. Ravindran, R. Vidya, A. Kjekshus, H. Fjellvag and O. Eriksson, Phys. Rev. B, 2006, 74, 224412.
- Corà et al. (2004) F. Corà, M. Alfredsson, G. Mallia, D. S. Middlemiss, W. C. Mackrodt, R. Dovesi and R. Orlando, Struct. Bond., 2004, 113, 171.
- Corà (2005) F. Corà, Mol. Phys., 2005, 103, 2483.
- Lebeugle et al. (2007) D. Lebeugle, D. Colson, A. Forget and M. Viret, Appl. Phys. Lett., 2007, 91, 022907.
- Singh et al. (2005) D. J. Singh, M. Ghita, S. V. Halilov and M. Fornari, J. Phys. IV France, 2005, 128, 47.
- Singh et al. (2006) D. J. Singh, M. Ghita, M. Fornari and S. V. Halilov, Ferroelectrics, 2006, 338, 73.
- Ghita et al. (2005) M. Ghita, M. Fornari, D. J. Singh and S. V. Halilov, Phys. Rev. B, 2005, 72, 054114.
- Suewattana and Singh (2006) M. Suewattana and D. J. Singh, Phys. Rev. B, 2006, 73, 224105.
- Yamauchi et al. (2008) K. Yamauchi, F. Freimuth, S. Bluegel and S. Picozzi, Phys. Rev. B, 2008, 78, 014403.
- Alonso et al. (2000) J. A. Alonso, M. J. Martínez-Lopez, M. T. Casais and M. T. Fernández-Díaz, Inorg. Chem., 2000, 39, 917.
- Lufaso and Woodward (2004) M. W. Lufaso and P. M. Woodward, Acta Cryst. B, 2004, 60, 10.
- Tachibana et al. (2007) M. Tachibana, T. Shimoyama, H. Kawaji, T. Atake and E. Takayama-Muromachi, Phys. Rev. B, 2007, 75, 144425.
- Martin (2004) R. L. Martin, Electronic Structure: Basic Theory and Methods (Cambridge University Press, 2004).
- Sergienko et al. (2006) I. A. Sergienko, C.Şen and E. Dagotto, Phys. Rev. Lett., 2006, 97, 227204.
- Lorenz et al. (2007) B. Lorenz, Y.-Q. Wang and C. W. Chu, Phys. Rev. B, 2007, 76, 104405.
- Pomjakushin et al. (2009) V. Y. Pomjakushin, M. Kenzelmann, A. Donni, A. B. Harris, T. Nakajima, S. Mitsuda, M. Tachibana, L. Keller, J. Mesot, H. Kitazawa, et al., New J. Phys., 2009, 11, 043019.
- Ederer and Spaldin (2005) C. Ederer and N. A. Spaldin, Phys. Rev. B, 2005, 71, 224103.
- Koichi and Fujio (2008) M. Koichi and I. Fujio, J. Appl. Cryst., 2008, 41, 653.
- Perdew et al. (2008) J. P. Perdew, A. Ruzsinszky, G. I. Csonka, O. A. Vydrov, G. E. Scuseria, L. A. Constantin, X. Zhou and K. Burke, Phys. Rev. Lett., 2008, 100, 136406.
- Sosnowska et al. (2002) I. Sosnowska, W. Schafer, W. Kockelmann, K. H. Andersen and I. O. Troyanchuk, Appl. Phys. A: Mater. Sci. Process., 2002, 74, S1040.
| PBE | B1-WC | HSE | Exp | |
| arh (Å) | 5.687 | 5.609 | 5.651 | 5.634 |
| (deg) | 59.22 | 59.37 | 59.12 | 59.35 |
| V (Å3) | 127.79 | 122.99 | 125.04 | 124.60 |
| 0.223 | 0.219 | 0.219 | 0.221 | |
| 0.533 | 0.511 | 0.522 | 0.538 | |
| 0.936 | 0.926 | 0.931 | 0.933 | |
| 0.387 | 0.406 | 0.394 | 0.395 | |
| d (Å) | 2.492 | 2.591 | 2.533 | 2.509 |
| d (Å) | 2.308 | 2.196 | 2.249 | 2.270 |
| d (Å) | 2.164 | 2.102 | 2.121 | 2.110 |
| d (Å) | 1.957 | 1.932 | 1.948 | 1.957 |
| (deg) | 164.09 | 162.84 | 164.56 | 165.03 |
| () | 3.72 | 4.2 | 4.12 | 3.75 |
| Gap (eV) | 1.0 | 3.0 | 3.4 | 2.5-2.8 |
| BiFeO3 () | ||
|---|---|---|
| BiFeO3 | QB() | VB (Å3) |
| Bi | 13.13 (13.01) | 18.06 (17.67) |
| Fe | 12.38 (12.13) | 8.24 (7.74) |
| O | 7.16 (7.28) | 12.08 (12.38) |
| HoMnO3 (AFM-E) | ||
| Ho | 5.18 (5.00) | 7.41 (6.77) |
| Mn | 6.82 (6.75) | 12.10 (11.84) |
| O | 7.33 (7.41) | 12.42 (12.61) |
| AFM-A | PBE | HSE | Exp. |
|---|---|---|---|
| Ho | |||
| 0.0856 | 0.0859 | 0.0839 | |
| 0.4805 | 0.4816 | 0.4825 | |
| Mn | |||
| O1 | |||
| 0.4617 | 0.4616 | 0.4622 | |
| 0.6162 | 0.6179 | 0.6113 | |
| O2 | |||
| 0.3250 | 0.3301 | 0.3281 | |
| 0.0550 | 0.0573 | 0.0534 | |
| 0.1988 | 0.2018 | 0.2013 | |
| Mn-O (s-inpl) | 1.9271 | 1.9022 | 1.9044 |
| Mn-O (l-inpl) | 2.2030 | 2.2393 | 2.2226 |
| Mn-O (outpl) | 1.9518 | 1.9546 | 1.9435 |
| Q | 0.55 | 0.61 | 0.60 |
| 19.47 | 19.71 | 18.77 | |
| Mn-O-Mn (inpl) | 143.849 | 142.839 | 144.081 |
| Mn-O-Mn (outpl) | 141.060 | 140.586 | 142.462 |
| BiFeO3 | Pionic | Pele | Ptot | Ppcm |
|---|---|---|---|---|
| PBE | 171.1 | 65.5 | 105.6 | 87.8 |
| HSE | 177.4 | 67.1 | 110.3 | 103.4 |
| PBE(HSE) | 177.4 | 64.8 | 112.6 | 103.4 |
| HSE(PBE) | 171.1 | 67.9 | 103.2 | 87.8 |
| HoMnO3 | ||||
| PBE | 0.6 | 5.2 | 5.8 | 2.0 |
| HSE | 0.3 | 1.6 | 1.9 | 0.9 |
| PBE(HSE) | 0.3 | 3.1 | 3.4 | 0.9 |
| HSE(PBE) | 0.6 | 2.9 | 3.5 | 2.0 |