Revising the simple measures of assortativity in complex networks
Abstract
We find that traditional statistics for measuring degree mixing are strongly affected by superrich nodes. To counteract and measure the effect of superrich nodes, we propose a paradigm to quantify the mixing pattern of a real network in which different mixing patterns may appear among low-degree nodes and among high-degree nodes. The new paradigm and the simple revised measure uncover the true complex degree mixing patterns of complex networks with superrich nodes. The new method indicates that some networks show a false disassortative mixing induced by superrich nodes, and have no tendency to be genuinely disassortative. Our results also show that the previously observed fragility of scale-free networks is actually greatly exacerbated by the presence of even a very small number of superrich nodes.
pacs:
89.75.Hc, 89.75.Da, 89.75.FbI Introduction
With increasing evidence of the ubiquity of scale-free networks, attention has recently shifted to the particular structure of experimentally observed networks Correlation_Science ; Correlation_Scale ; Review_Newman ; Phycics_today ; Extreme_assortativity1 ; Extreme_assortativity2 . One key observation to arise has been that some networks display a propensity for high degree nodes to connect to other high degree nodes (assortativity) Mixing_Newman02 ; Social_mixing . Conversely in certain other types of networks the reverse is true: high degree nodes connect to low degree nodes (disassortativity). In particular, numerical evidence from experimental data has shown that many technological (i.e. communication networks), biological (e.g., protein and neural networks) and certain social (online communities Nioki_SN ; Online_SN ) networks are found to exhibit a negative assortativity coefficient and are therefore claimed to be examples of disassortative mixing Mixing_Newman02 ; Mixing_Newman03 .
A widely accepted way to determine the mixing pattern of complex networks is to calculate the Pearson correlation coefficient of the degrees at both ends of the edges Review_Newman ; Review_measure ; Review_Boccaletti . Although Newman’s assortativity coefficient is not a perfect measure of assortativity, it is a very simple measure to approximately assess the degree mixing pattern of a network and has been employed broadly. Another natural approach to quantify mixing patterns is to calculate the correlations between two nodes connected by an edge Review_measure . There are two ways to characterize the node degree correlations. One is the conditional probability that an arbitrary edge connects a node with degree to another node with degree Kn . The other is the joint degree distribution that measures whether nodes with a given degree prefer (or avoid) to connect to nodes with degree Correlation_Science ; Correlation_Internet ; Correlation_Scale . Although they can capture the mixing patterns by the 2-dimensional degree correlation plots Internet_mixing ; Knn1 ; Knn2 , it is difficult for the two methods to quantitatively evaluate the assortativities of complex networks.
While the existing measures for assortativity are simple, and the mathematical definition of what is meant by assortativity and disassortativity is clear and consistent, this is not equivalent to the general understanding of these phenomena. In particular, disassortativity can easily and often does arise in situations when the degree of neighbors matches as closely as possible. This is completely at odds with what is commonly understood, and this needs to be addressed. The current usage of degree correlation measures means that researchers often conclude that node degree between neighbors in physical/social systems is mis-matched while in fact the opposite is true.
In this paper we show that in a finite size network superrich nodes cause a network to show an observed disassortative mixing in most cases, while they sometimes let a strong disassortative network appear less disassortative property. And superrich nodes often limit the assortativity coefficient to be in a narrow range, and mask the genuine mixing pattern of complex networks. The superrich nodes, which exist in many real networks, refer to the nodes whose degrees are far larger than most other nodes. The assortativity coefficient in certain experimentally measured networks is therefore due to a small fraction of superrich nodes, and is not caused by a genuinely assortative (or disassortative) mixing. The mechanism underlying degree mixing has not been properly understood and many of these common indices mis-represent the true assortativity of a network. We find that the assortativity coefficient will give a “false” result of mixing patterns for the networks with superrich nodes.
To overcome the effect of these aberrant and uncommonly connected nodes, a new and more robust measure of degree-degree mixing is needed. We choose a modification of Newman’s assortativity coefficient so that our new measure will be simple and also as similar as possibly to what is already being employed. We deliberately choose to change the existing measure as little as possible, so that the new measure can be best understood. We are not suggesting that the existing tools be abandoned and only that they be computed twice: once as is done now, and again after removing the contribution of superrich nodes.
The superrich nodes can, and often will, have an extremely great effect on the network structure. Our results also show that the previously observed fragility of scale-free networks is actually greatly exacerbated by the presence of even a very small number of superrich nodes. An attack targeting the superrich nodes (rather than just the rich) of a network can very quickly fragment, or at least stretch, a scale-free network.
II Superrich nodes affect degree mixing patterns
II.1 Superrich nodes in scale-free network
The superrich nodes refer to the nodes whose degrees are far larger than most other nodes. Our finding in this study can be applied to any degree distribution network, and is not limited for power-law and exponential degree distribution networks, so there is no need to judge whether the degree distribution obeys a power-law strictly. While it is necessary to supply a simple and operative definition of superrich nodes in scale-free networks, for the power-law degree distribution broadly exists in real networks BA . In terms of networks with approximately power-law (or exponential) degree distribution, superrich nodes are defined as the nodes whose degrees are larger than the natural cutoff value. It should be noticed that the nodes with degree that is predicted by the power-law only are rich nodes.
The natural cutoff degree is an important concept in finite-size scale-free networks Degree_cutoff . It is defined as the value of the degree above which one expects to find at most one node Cutoff_value , that is
| (1) |
here is the number of nodes. For a scale-free network, this expression provides a dependence of the natural cutoff with and the slope as
| (2) |
Here we obtain the slope by fitting the real data excluding the potential superrich nodes.
II.2 Adding superrich nodes to BA model
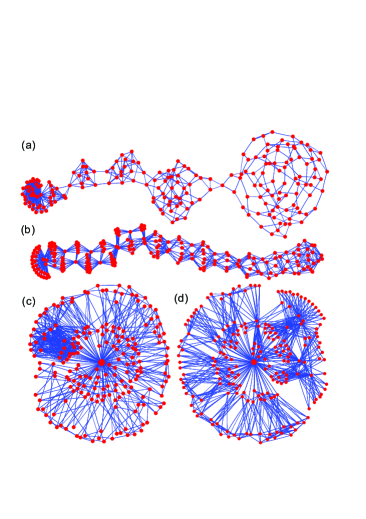
First we utilize the BA model BA to demonstrate the significant effect of superrich nodes. We generate a small size of BA network (nodes and average degree ), and then the maximal assortative mixing (MAM) and maximal disassortative mixing (MDM) networks are generated from the original BA network using the rewiring method Constraint . These three networks have the same degree distribution but different mixing patterns. The MAM network reveals a beautiful assortative structure in which nodes with similar degrees connect to one another as is shown in Fig. 1(a). In contrast, the MDM network shows that high degree nodes link to low degree ones in Fig. 1(b). However, the addition of only one superrich node ( and random linking) severely affects the entire topology of the network, as is shown in Fig. 1(c) and (d). Our results in Fig. 1 also show that the clustering coefficient WS and average path length are extremely changed by the only one superrich node.
Now we demonstrate how superrich nodes bias the mixing pattern of a network. The assortativity coefficient Mixing_Newman02 is given by
| (3) |
where and are the degrees of the two endpoints of the th edge, and is the total number of edges in the network. If , the network is claimed to be assortative mixing; while if , the network is called disassortative mixing.
A large scale BA network ( and ) is generated, and the MAM and MDM networks are obtained by the rewiring method Constraint . The values for these networks are listed in Table 1. The above three networks exhibit the reasonable mixing coefficients: assortative, neutral and disassortative. Then we add five superrich nodes () to each of the three networks. For the MAM network, superrich nodes are connected to high degree nodes; while for the MDM network, superrich nodes are linked to low degree nodes; for the original BA network, random linking is adopted. As can be seen in Table 1, all are negative for these networks, which runs against our intuition. Take the MAM network for example, the strong positive () is replaced by a negative value (), although the superrich nodes are attached to the high degree nodes (assortative adding). Moreover, the fluctuation of becomes narrow for the networks with superrich nodes (). This result shows that superrich nodes can not only make a strong assortative network show a negative assortativity coefficient, but also make a strong disassortative network appear less disassortative.
Network Maximal disassortative mixing Original BA network Maximal assortative mixing Maximal disassortative mixing with superrich nodes (disassortative adding) Original BA network with superrich nodes (random adding) Maximal assortative mixing with superrich nodes (assortative adding)
II.3 Superrich nodes in experimental networks
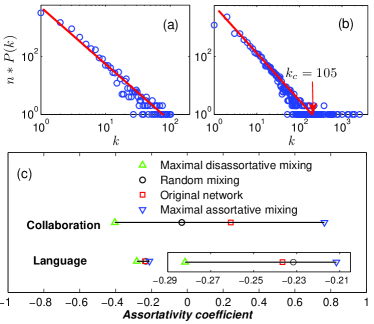
Many complex networks exhibit a scale-free degree distribution BA ; Review_Barabasi , such as the two real networks in Figs. 2(a) and (b). And the slope of power-law is obtained by fitting the real data excluding the potential superrich nodes. For the collaboration network in computational geometry Pajek_data , its degree fits the power-law distribution perfectly. While for the language network Superfamily , from Darwin’s “The Origin of Species”, superrich nodes exist in it, because the maximum degree () is far larger than the natural cutoff (). The results of for four mixing patterns of the two networks are shown in Fig. 2(c). The original collaboration network is assortative like most social networks Mixing_Newman02 ; Social_mixing . While for all mixing patterns of the language network, is strong negative and is confined to a narrow range, which is similar to the BA network with superrich nodes. According to the results of the theoretical model (BA network) and the language network, we conclude that can not determine mixing patterns of networks with superrich nodes accurately, and superrich nodes lead to be strong negative and within a very narrow range.
One method to characterize the node degree correlations is the conditional probability that an arbitrary edge connects a node with degree to another node with degree Kn . It is difficult for this method to quantitatively evaluate mixing patterns of complex networks with superrich nodes, because the finite network size and the small amount of superrich nodes will lead to an unstable result Review_measure ; Constraint . This problem can be partially solved by calculating the average degree of the nearest neighbors of nodes with a given degree Knn1 ; Knn2 , which is given by
| (4) |
Here an increasing with indicates that nodes with high degree tend to connect to nodes with high degree, and the network is classified as assortative. Whereas a decreasing with indicates that nodes with high degree tend to connect to nodes with low degree, and the network is disassortative.
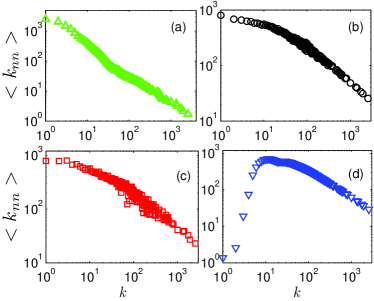
The average degree for different mixing patterns of the language network is shown in Fig. 3. For the MDM, original and random mixing networks, all decrease with , which shows a disassortative property. For the MAM network, firstly increases and then decreases, and thus it is difficult to tell whether the network is assortative or disassortative. These results indicate that neither nor can characterize the intrinsic mixing patterns of complex networks with superrich nodes, for the degree of a superrich node is far larger than those of other nodes.
III New paradigm of measuring mixing patterns
III.1 New paradigm
Since superrich nodes are widely observed in real networks, a new statistic is needed to appropriately classify whether a network with superrich nodes is genuinely assortative or not. In this paper, we manage to determine the mixing patterns of complex networks with two new measures. The first one is a modified definition of assortativity coefficient, which is given by
| (5) |
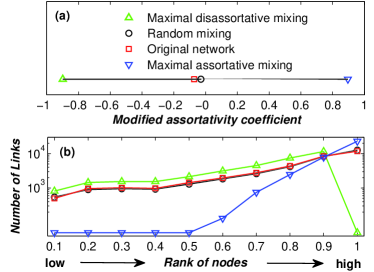
where , which is different to the original , is the total number of edges among the nodes whose degrees are lower than . In accordance with , positive indicates a network is assortative; and negative represents a network is disassortative. When calculating in equation 5, we exclude superrich nodes whose degrees are greater than . In contrast with the failure of , can determine the genuine mixing patterns of complex networks with superrich nodes and distinguish the four mixing patterns very effectively as is demonstrated in Fig. 4(a). Especially, of the original language network is neutral, which is different to the strong negative that we have observed in Fig. 2(c).
Although our new statistic can effectively measure the mixing patterns among the nodes whose degree is below the natural cutoff value, it is not an optimal solution to neglect a very small number but the most important superrich nodes. Moreover, a real network may exhibit assortative mixing among low degree nodes and disassortative mixing among superrich nodes, and it is not accurate to assert the network is assortative or disassortative. It is necessary to propose a paradigm to measure the mixing pattern of low-degree nodes and high-degree nodes respectively, especially for the network with superrich nodes, because the assortativity coefficient of a very small number of superrich nodes will mask the mixing pattern of larger number of low degree nodes.
We have used the modified assortativity coefficient to quantitatively measure the mixing pattern of low degree nodes, so the second measure is proposed to quantify the mixing pattern between low degree nodes and superrich nodes (including links among superrich nodes). Because the degrees of superrich nodes are far larger than most other nodes and superrich nodes have to link to many low degree nodes, it is meaningless to say the mixing pattern of superrich nodes is always disassortative. To find the genuine mixing pattern of superrich nodes, here we test superrich nodes tend to link to high or low rank nodes. If superrich nodes tend to link to high rank nodes, we consider that they are assortative mixing. Conversely, if superrich nodes tend to link to low rank nodes, we believe that they show a disassortative property.
Firstly nodes are ranked in an increasing order according to the degrees. If two nodes have the same degree, we rank their orders randomly. The nodes are divided into bins according to their ranks. Then the number of links connecting superrich nodes to the nodes in each bin is calculated. We can not calculate the assortativity coefficient of the orders after ordering all nodes because of a false result given by the large number of links of superrich nodes. For different mixing patterns, the distributions of linking numbers are shown in Fig. 4(b). The MAM network shows assortative for superrich nodes tend to connect to high rank nodes. On the contrary, the MDM network shows disassortative for superrich nodes tend to link to low rank nodes. The original network and the random mixing network are both neutral mixing for superrich nodes have no obvious tendency to connect with high or low rank nodes.
Figures 4(a) and (b) show the coincident results for different mixing patterns, which indicates the two new measures are both effective. Furthermore, our two new measures compose an effective paradigm to quantify a real network in which different mixing patterns may appear among low-degree nodes and among high-degree nodes. They quantify the effect of superrich nodes on the mixing pattern of complex networks. The new paradigm can capture the rich nature of the mixing properties in a real network and distinguish whether the disassortativity of a network is derived from superrich nodes.
III.2 Comparison with correlation profile
The joint degree distribution is another way to characterize the node degree correlations, which can measure whether nodes with a given degree prefer (or avoid) to connect to nodes with degree . The 2-dimensional degree correlation profile Correlation_Science ; Correlation_Internet is a suitable way to use the joint degree distribution to capture the mixing patterns. We visualize the correlation profile for different mixing patterns of the language network by plotting the ratio in Fig. 5, where is the total number of edges in the links of the language network with degrees and , while is the same value in a randomized version of this network.
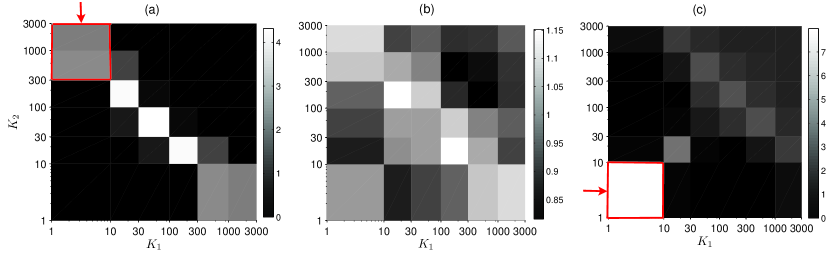
Observing the results in Fig. 5, we find the correlation profile effectively captures the degree correlations of neighboring nodes. The left-up corner of Fig. 5(a) shows that high degree nodes tend to link to low degree nodes (disassortative) in the MDM network. Conversely, the MAM network obviously shows that low degree nodes prefer to connect to low degree nodes (assortative) in the left-down corner of Fig. 5(c). All the values of for the original language network are in a very narrow range in Fig. 5(b), which means this network is near neutral mixing. These results are consistent with those in Figs. 4(a) and (b), which shows that the 2-dimensional degree correlation profile is an effective way to capture the mixing patterns and it is more robust than original and to capture the mixing patterns of complex networks with superrich nodes.
Comparing the correlation profile with our new paradigm, we can find the advantage of 2-dimensional correlation profile is describing the detailed information of degree correlations. But the correlation profile is only a qualitative method and is difficult to quantitatively evaluate the assortativities of complex networks. The assortativity coefficient is a very simple and the most widely accepted quantitative way to determine the degree mixing pattern. We choose a modification of Newman’s assortativity coefficient as the measure for real networks so that our new measure will be simple and also as similar as possible to what is already being employed. And this measure avoids replacing the existing simple and useful measures with something entirely different.
IV Results of experimental networks
The results of and for nine real networks are listed in Table 2. Like most social networks, networks (a) and (b) have positive , for the nodes tend to connect to one another belonging to the same community Social_mixing and there are no superrich nodes. But of Wealink.com is negative, which is consistent with other online communities Nioki_SN ; Online_SN . And of Wealink.com is , so a person who has more than links is a superstar. Although the number of superstars in Wealink.com is only (), surprisingly becomes more negative () after excluding these superstars. The above result indicates that a very small number of superrich nodes mask the genuine degree mixing information of the online community. And superrich nodes do not always make a strong assortative network show a negative assortativity coefficient. On the contrary, sometimes they will make a strong disassortative network appear less disassortative property, just like in this case.
Network (a) e-mail (b) arXiv.org (c) Wealink.com (d) Roget’s thesaurus (e) citation network (f) Internet (g) metabolic pathway (h) protein folding (i) neural net
Usually it is believed that technological and biological networks tend to be disassortative Mixing_Newman02 ; Mixing_Newman03 , such as the networks (e), (f) and (i). We find that superrich nodes lead of these networks to be negative. After filtering superrich nodes, (e) and (i) show neutral mixing properties, while of (f) turns more negative. The above results show that can reveal the intrinsic mixing patterns masked by superrich nodes. Since previous works do not take the effect of superrich nodes into consideration, many networks exhibit “false” negative and decreasing . The advantage of over the previous measures is that it is not affected by superrich nodes. The modified definition of assortativity coefficient is more suitable to characterize the mixing pattern of any degree distribution network, especially for a network with superrich nodes.
One possible explanation for the disassortative mixing in these non-social networks is the structural constraint: two nodes have no more than one edge connecting them Correlation_Internet . But the structural constraint can not explain why not all non-social networks are disassortative. Actually, further research has found the prohibitively multi-edged mechanism can not generate the same correlation as the real Internet, and only part of degree correlations can be obtained in this way Internet_mixing . And it is difficult to distinguish which part of disassortativity is derived from the structural constraint. As far as we know, the intrinsic mechanism why these non-social networks exhibit disassortative properties is not entirely clear Review_Newman ; Phycics_today .
The effect of superrich nodes on mixing patterns can explain why some technological and biological networks tend to have a negative . Superrich nodes exist in these networks more commonly than in social networks, so many technological and biological networks exhibit a negative induced by superrich nodes and are therefore claimed to be examples of disassortative mixing. Furthermore, we find that the technological and biological networks (without superrich nodes) have no tendency to be disassortative, such as the networks (d), (g) and (h), for a positive is commonly found in these networks. Our results indicate the conjecture that the disassortativity of degree is the normal state of a network in Internet_mixing may not be right. The normal state of degree mixing pattern in non-social networks is more like the neural mixing based on our new paradigm.
V Conclusion and discussion
We show that in a finite size network a very small number of superrich nodes will bias traditional measures of mixing patterns. We not only report that the traditional measures are not perfect measures but also propose a revised measure which is better than the original one and reveals the real pattern of assortativity. Firstly we propose a straightforward modification to the existing assortativity coefficient to both measure and counteract the effect of superrich nodes. Then we develop an effective paradigm to quantify a real network in which different mixing patterns may appear among low-degree nodes and among high-degree nodes. Our new method can capture the rich nature of the mixing properties in a real network. We can distinguish the disassortativity of a network derives from the structural constraint, or other reasons like social and engineering factors.
Our results also indicate that the “robust yet fragile” nature of real networks (e.g., Internet) dose not depends on the power-law degree distribution only, and superrich nodes have the same effect. For the random failure of the networks, a very small fraction of nodes with a very large degree will make any degree distribution network more robust than random graphs. On the other hand, superrich nodes are the real Achilles’ heel of the Internet. The attack targeting these richest nodes causes the Internet to collapse faster than the ER graph, even the scale-free model without superrich nodes (BA network) as is shown in Fig. 3 in Attack . Moreover, the cascade failure of one superrich node can lead more than nodes of the Internet to be disconnected Cascading_failure .
We demonstrate that superrich nodes critically change the way in which complex networks behave, and we have revised the false disassortative mixing in some non-social networks induced by superrich nodes. Revealing the intrinsic mixing patterns of complex networks masked by superrich nodes is crucial to study epidemic spreading, percolation on complex networks, error and attack tolerance of real physical systems. Superrich nodes are one of the principal factors determining many aspects of the behavior of the overall network, though they are minority in number. We suggest that greater attention should be payed to the richest nodes when analyzing finite size network data.
This work is supported by the University Grants Council of the Hong Kong government (No. PolyU 5268/07E). Junfeng Sun is partly supported by a grant from the National Natural Science Foundation of China (No. 60901025).
References
- (1) S. Maslov and K. Sneppen, Science 296, 910 (2002).
- (2) L.K. Gallos, C.-M. Song, and H.A. Makse, Phys. Rev. Lett. 100, 248701 (2008).
- (3) M.E.J. Newman, SIAM Rev. 45, 167 (2003).
- (4) M.E.J. Newman, Phys. Today 61(11), 33 (2008).
- (5) L. Li, D. Alderson, J.C. Doyle and W. Willinger. Internet Mathematics 2, 431 (2006).
- (6) P. Holme and J. Zhao, Phys. Rev. E 75, 046111 (2007).
- (7) M.E.J. Newman, Phys. Rev. Lett. 89, 208701 (2002).
- (8) M.E.J. Newman and J. Park, Phys. Rev. E 68, 036122 (2003).
- (9) P. Holme, C.R. Edling, and F. Liljeros, Soc. Networks 26, 155 (2004).
- (10) Y.Y. Ahn et al., in Proceedings of the WWW2007 Conference (IW3C2 and University of Calgary, Alberta, Canada, 2007), p. 835.
- (11) M.E.J. Newman, Phys. Rev. E 67, 026126 (2003).
- (12) S. Boccaletti et al., Phys. Rep. 424, 175 (2006).
- (13) L. da F. Costa et al., Adv. Phys. 56, 167 (2007).
- (14) M. Boguñá and R. Pastor-Satorras, Phys. Rev. E 66, 047104 (2002).
- (15) S. Maslov, K. Sneppen, and A. Zaliznyak, Physical A 333, 529 (2004).
- (16) J. Park and M.E.J. Newman, Phys. Rev. E 68, 026112 (2003).
- (17) R. Pastor-Satorras, A. Vázquez, and A. Vespignani, Phys. Rev. Lett. 87, 258701 (2001).
- (18) A. Vázquez et al., Phys. Rev. E 67, 046111 (2003).
- (19) A.-L. Barabási and R. Albert, Science 286, 509 (1999).
- (20) M. Boguñá, R. Pastor-Satorras, and A. Vespignani, Eur. Phys. J. B 38, 205 (2004).
- (21) S. N. Dorogovtsev and J. F. F. Mendes, Adv. Phys. 51, 1079 (2002).
- (22) S. Zhou and R.J. Mondragón, New J. Phys. 9, 173 (2007).
- (23) D.J. Watts and S.H. Strogatz, Nature 393, 440 (1998).
- (24) R. Albert and A.-L. Barabási, Rev. Mod. Phys. 74, 47 (2002).
- (25) http://vlado.fmf.uni-lj.si/pub/networks/data/.
- (26) R. Milo et al., Science 303, 1538 (2004).
- (27) http://deim.urv.cat/ aarenas/data/welcome.htm.
- (28) http://www-personal.umich.edu/ mejn/netdata/.
- (29) http://www.wealink.com/.
- (30) http://pil.phys.uniroma1.it/ gcalda/cosinsite/.
- (31) R. Albert, H. Jeong, and A-L. Barabási, Nature 406 378 (2000).
- (32) A.E. Motter and Y.-C. Lai, Phys. Rev. E 66, 065102(R) (2002).