A Spitzer Space Telescope far-infrared spectral atlas of compact sources in the Magellanic Clouds. I. The Large Magellanic Cloud
Abstract
We present far-infrared spectra, =52–93 m, obtained with the Spitzer Space Telescope in the Spectral Energy Distribution mode of its MIPS instrument, of a representative sample of the most luminous compact far-infrared sources in the Large Magellanic Cloud. These include carbon stars, OH/IR Asymptotic Giant Branch (AGB) stars, post-AGB objects and Planetary Nebulae, the R CrB-type star HV 2671, the OH/IR red supergiants WOH G064 and IRAS 052806910, the three B[e] stars IRAS 045306916, R 66 and R 126, the Wolf-Rayet star Brey 3a, the Luminous Blue Variable (LBV) R 71, the supernova remnant N 49, a large number of young stellar objects (YSOs), compact H ii regions and molecular cores, and a background galaxy at a redshift . We use the spectra to constrain the presence and temperature of cold dust and the excitation conditions and shocks within the neutral and ionized gas, in the circumstellar environments and interfaces with the surrounding interstellar medium (ISM). First, we introduce a spectral classification scheme. Then, we measure line strengths, dust temperatures, and IR luminosities. Objects associated with star formation are readily distinguished from evolved stars by their cold dust and/or fine-structure lines. Evolved stars, including the LBV R 71, lack cold dust except in some cases where we argue that this is swept-up ISM. This leads to an estimate of the duration of the prolific dust-producing phase (“superwind”) of several thousand years for both RSGs and massive AGB stars, with a similar fractional mass loss experienced despite the different masses. We tentatively detect line emission from neutral oxygen in the extreme RSG WOH G064, which suggests a large dust-free cavity with implications for the wind driving. In N 49, the shock between the supernova ejecta and ISM is revealed in spectacular fashion by its strong [O i] 63-m emission and possibly water vapour; we estimate that 0.2 M⊙ of ISM dust was swept up. On the other hand, some of the compact H ii regions display pronounced [O iii] 88-m emission. The efficiency of photo-electric heating in the interfaces of ionized gas and molecular clouds is estimated at 0.1–0.3%. We confirm earlier indications of a low nitrogen content in the LMC. Evidence for solid state emission features is found in both young and evolved objects, but the carriers of these features remain elusive; some of the YSOs are found to contain crystalline water ice. The spectra constitute a valuable resource for the planning and interpretation of observations with the Herschel Space Observatory and the Stratospheric Observatory For Infrared Astronomy (SOFIA).
Subject headings:
stars: AGB and post-AGB — circumstellar matter — stars: formation — supergiants — supernova remnants — Magellanic Clouds1. Introduction
About the cycle of gas and dust that drives galaxy evolution, much can be learnt from the interfaces between the sources of feedback and the interstellar medium (ISM), and between the ISM and the dense cores of molecular clouds wherein new generations of stars may form. These regions are characterized by the cooling ejecta from evolved stars and supernovae, and clouds heated by the radiation and shocks from hot stars, in supernova remnants (SNRs) and young stellar objects (YSOs) embedded in molecular clouds.
The interaction regions with the ISM lend themselves particularly well to investigation in the infrared (IR) domain, notably in the 50–100 m region; cool dust (–100 K) shines brightly at these wavelengths, and several strong atomic and ionic transitions of abundant elements (viz. [O i] at m, [O iii] at m, and [N iii] at m) provide both important diagnostics of the excitation conditions and a mechanism for cooling. These diagnostic signatures became widely accessible within the Milky Way, by virtue of the Kuiper Airborne Observatory (KAO, see Erickson et al. 1984) and the Long-Wavelength Spectrograph (LWS, Clegg et al. 1996) onboard the Infrared Space Observatory (ISO, Kessler et al. 1996).
The gas-rich dwarf companions to the Milky Way, the Large and Small Magellanic Clouds (LMC and SMC), offer a unique opportunity for a global assessment of the feedback into the ISM and the conditions for star formation, something which is much more challenging to obtain for the Milky Way due to our position within it. The LMC and SMC are nearby ( and 60 kpc, respectively: Cioni et al. 2000; Keller & Wood 2006) and already the scanning survey with the IR Astronomical Satellite (IRAS, Neugebauer et al. 1984) showed discrete sources of far-IR emission in them. The star-forming regions, massive and intermediate-mass stars, and ISM are also lower in metal content than similar components of the Galactic Disc, Z⊙ and –0.2 Z⊙ (cf. discussion in Maeder, Grebel & Mermilliod 1999). This offers the possibility to assess the effect metallicity has on the dust content and on the heating and cooling processes, and to study these in environments that are more similar to those prevailing in the early Universe than the available Galactic examples (cf. Oliveira 2009).
The Spitzer Space Telescope (Werner et al. 2004) marries superb sensitivity with exquisite imaging quality, able to detect the far-IR emission from a significant fraction of the total populations of YSOs, massive red supergiants (RSGs), intermediate-mass Asymptotic Giant Branch (AGB) stars, Planetary Nebulae (PNe), and rare but extreme — and important — phases in the late evolution of massive stars such as Luminous Blue Variables (LBVs) and SNRs. The telescope also carried a facility, the MIPS-SED, to obtain spectra at 52–93 m, and we used this to target representative samples of luminous 70-m point sources in the LMC and SMC. The SMC spectra are presented in Paper II in this two-part series (van Loon et al. 2009); here we present the results of the LMC observations.
2. Observations
2.1. Data collection and processing
Our dataset comprises low-resolution spectra obtained using the Spectral Energy Distribution (SED) mode of the Multiband Imaging Photometer for Spitzer (MIPS; Rieke et al. 2004) onboard the Spitzer Space Telescope (Werner et al. 2004), taken as part of the SAGE-Spec Spitzer Legacy Program (Kemper et al. 2009). The spectra cover –93 m, at a spectral resolving power –25 (two pixels) and a cross-dispersion angular resolution of 13–24′′ Full-Width at Half-Maximum (sampled by pixels). The slit is wide and long, but at one end of the slit only covers m as a result of a dead readout. To place the angular scales into perspective, pc at the distance of the LMC. This is characteristic of a SNR, star cluster, or molecular cloud core; it is smaller than a typical H ii region, but larger than a typical PN.
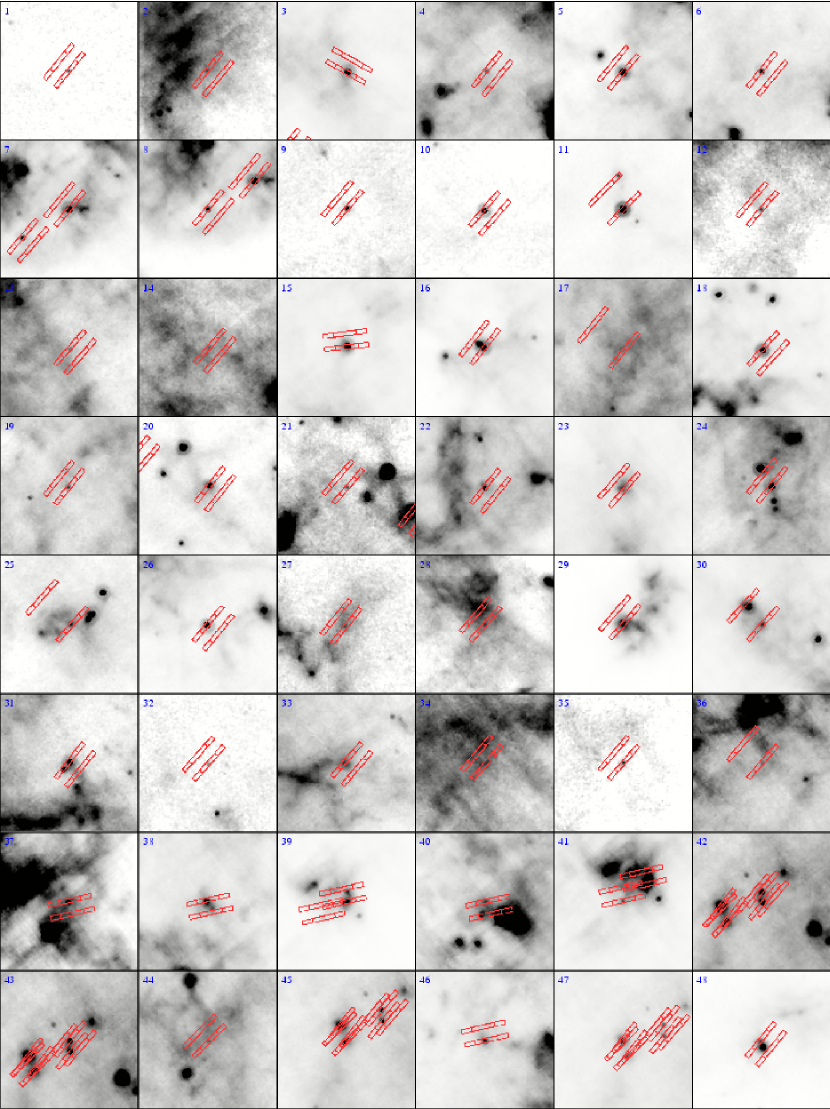
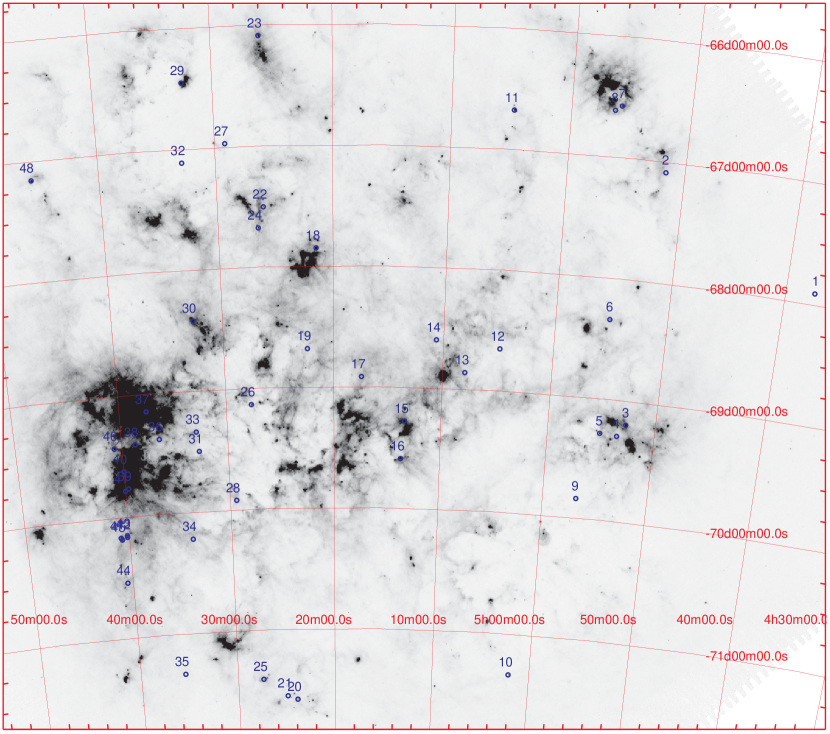
The target list, Table 1, is described in §2.2 and §3, and their distribution on the sky is displayed in Figure 1. The background spectrum was measured at one of four possible chop positions, chosen to be free of other discrete sources of 70-m emission. This depends on the time of observation, and as the observations were scheduled earlier than anticipated, the off-source position was not always empty. Figure 2 shows 70-m close-ups, extracted from the SAGE-LMC Spitzer Legacy Program (Meixner et al. 2006), with the Astronomical Observation Request (AOR) footprints overlain.
The raw data were processed with the standard pipeline version S16.1.1, and the spectra were extracted and calibrated using the dat software, v3.06 (Gordon et al. 2005). Spectra were extracted from the on-off background-subtracted frame, unless the spectrum at the off position was affected by discrete sources; then the spectrum of the source was extracted from the on-source observation only. The extraction aperture was five pixels wide in the cross-dispersion direction, and the (remaining) background level was determined in a-few-pixel-wide apertures at either side of, and at some distance from, the extraction aperture. The extracted spectrum was corrected to an infinite aperture and converted to physical units, providing an absolute flux calibrated spectrum (cf. Lu et al. 2008). The spectra extracted from the on-source frames may be affected by detector artifacts, which are otherwise cancelled by subtracting the off-source frame. The quality of the spectrum extraction (a subjective assessment) is listed in Table 2, along with other MIPS-SED descriptors.
In our analysis of the MIPS-SED data, we shall also make use of associated photometry, from SAGE at 24, 70, and 160 m with MIPS.
2.2. Target selection
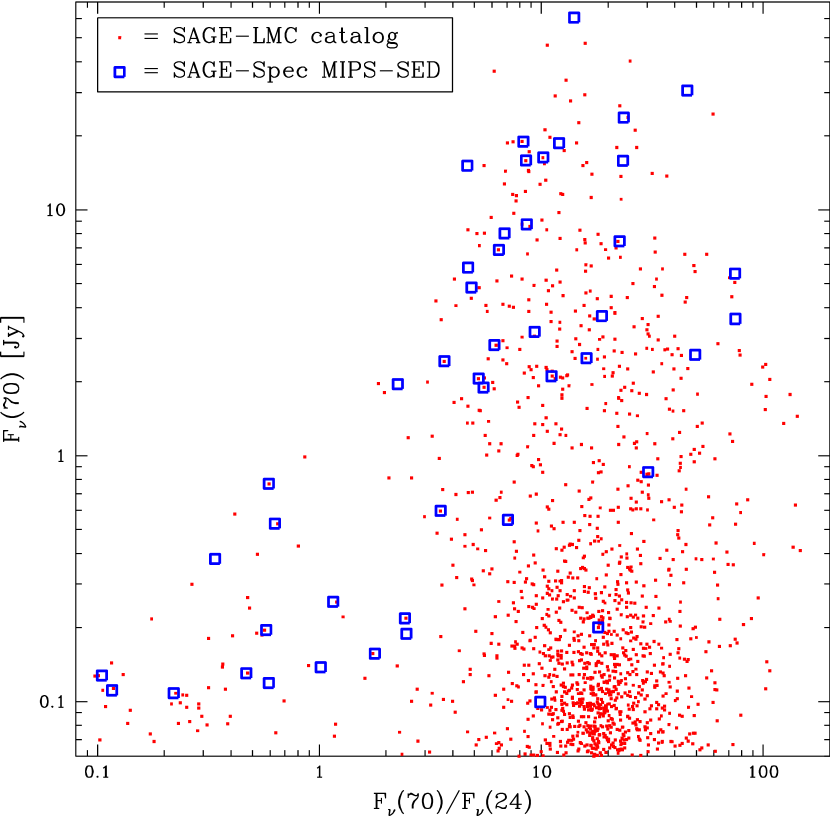
The targets were selected on the basis of the following criteria: (i) point source appearance at 70 m, and (ii) a minimum flux density at 70 m of Jy (for MIPS-SED detection purposes). Further criteria were applied to reduce the large sample of potential targets to within a reasonable time request: (iii) requirement at the time of proposal submission to have a Spitzer IRS spectrum in the archive or be a target for a planned IRS observation, (iv) aim to cover the F vs. F/F diagram uniformly, and (v) aim to maximize the diversity of objects as far as identifications existed. Table 3 summarizes the MIPS photometric properties of the selected targets, and Figure 3 shows them in the F vs. F/F diagram in comparison to the entire population of 70-m point sources from SAGE-LMC.
The variability at 24 m is defined here as:
| (1) |
and listed in Table 3. There is a fair correlation between this index and known large-amplitude, long-period variability. For example, MSX-LMC 349 is a carbon star and IRAS 052986957 is an OH/IR star, both showing the variability expected in these evolutionary stages and indeed observed for these sources at shorter wavelengths (see §3). In some cases, the index may be affected by source confusion, and it is helpful in interpreting the photometry and its reliability, and the nature of the MIPS-SED target. Examples where this is likely to have happened are N 159-P2, UFO 1 and MSX-LMC 956. An interesting large-amplitude variable source is the YSO 30 Dor-17, showing a variation by a factor 1.6.
The targets cover a range of object types as well as IR luminosities, and they are well-spread across the LMC galaxy (Figs. 1 & 3). The targets are affected by high, complex background emission and source confusion to a varying degree; some sit well-isolated in an IR-quiet patch whilst others — even though bright — can be difficult to extract from surrounding diffuse emission (Fig. 2). Although there is a slight tendency towards luminous YSOs and compact H ii regions in the prominent star-forming regions of the LMC, this bias is rather mild. In fact, many of the most luminous point sources were not observed, and some well-known objects did not make it to the selection, for instance the LBVs S Dor and R 127. But several objects are observed, which are closely grouped together in the molecular ridge South of the 30 Doradus mini-starburst region. This might allow to catch a glimpse of evolutionary hierarchy.
3. Comments on individual objects
In the remainder of this paper, we shall refer to objects from the Henize (1956) catalog as “N [number]”; the full designation would be “LHA 120-N [number]”. Likewise, objects from the Reid & Parker (2006) catalog shall be referred to as “RP [number]”. Three sources with only a SAGE designation are abbreviated following the IRAS convention (where the last digit of the RA part derives from decimal minutes). Table 1 describes all MIPS-SED targets, with literature references checked until Spring 2009.
Most targets have been studied before, and brief summaries of their nature are given below. However, next to nothing is known about SAGE 043746754, SAGE 052236841, MSX-LMC 577, IRAS 052817126, MSX-LMC 741, UFO 1 (we note here, from inspection of ESO B-band images, a coincidence with a faint optical point source very close to another bright point source), RP 85, and SAGE 054077011.
3.1. SMP-LMC 11 (#2)
Discovered as a PN candidate by Sanduleak, MacConnell & Philip (1978), it was classified as an extreme AGB star by Blum et al. (2006). The central star was not detected (Villaver, Stanghellini & Shaw 2007). Shaw et al. (2006) found it to be the most compact bipolar PN in the LMC, with an outer arc which they speculate could be part of a faint halo (or a bow-shock?). Dopita, Ford & Webster (1985) and Dopita et al. (1988) already noted the complex and energetic internal dynamics of the ionized nebula. Leisy & Dennefeld (2006) classified its optical line emission spectrum as Type “i”: nitrogen-rich (compared to oxygen), helium-poor, metal-poor. SMP-LMC 11 has the lowest argon abundance of all their LMC objects, 1.2 dex below the LMC average, and only one of their SMC objects is (marginally) more metal-poor. The oxygen abundance is equally low, which was already noted by Morgan (1984) who found it low for its (high) excitation class. It has likely a low-mass progenitor, in line with the upper limit on the ionized mass in the nebula of M⊙ (Wood et al. 1987). Zijlstra et al. (1994) identified it with an IRAS source. Bernard-Salas et al. (2006) presented the Spitzer IRS spectrum, which shows acetylene, polyacetylenic chains, and benzene, all in absorption against a 330 K dust emission continuum, but no Polycyclic Aromatic Hydrocarbons (PAHs) nor nitrogen-bearing molecules.
3.2. IRAS 045306916 (#3)
This was first thought to be a RSG. Wood et al. (1992) suggested small-amplitude variability with a period of d, but this was not confirmed (Whitelock et al. 2003). The ISO (12–60 m) colors clearly pointed at oxygen-rich dust (Trams et al. 1999). Van Loon et al. (1999b) estimated a very high mass-loss rate on the premise that it is a dust-enshrouded RSG. Being a very bright far-IR source, van Loon et al. (2001b) were subsequently surprised that no maser emission could be detected, and on inspection of the IRAS color–color diagram suggested that it could be a YSO. Van Loon et al. (2005a) provided evidence in support of this assertion, in the form of an optical spectrum showing a B[e]-type emission-line spectrum on top of a composite of a warm and cold continuum. Sloan et al. (2008) presented the Spitzer IRS spectrum, which displays Class A PAH emission pointing also at a star-forming nature, and silicate absorption against a cool dust emission continuum. It excites the nebula N 81A (Henize 1956) = DEM L 15a (Davies, Elliott & Meaburn 1976). It was detected in the radio survey of Filipović et al. (1995), as source LMC B04536917. The nebula’s radio and IR properties are commensurate with it being an H ii region (Filipović et al. 1998c; see also Voges et al. 2008).
3.3. IRAS 045376922 (#4)
The exciting star of N 82 (Henize 1956), Brey 3a was suggested by Heydari-Malayeri et al. (1990) to be a WC9-type Wolf-Rayet (WR) star, the first to have been discovered in the Magellanic Clouds. They detected C iii lines and found it nitrogen-rich and oxygen-poor. They also found evidence for another component, possibly a main-sequence O8-type companion. Breysacher, Azzopardi & Testor (1999) still listed this as its likely nature, even though Moffat (1991) had already argued that it is not a WC9 star but more likely a WNL or Of star. This was confirmed by Heydari-Malayeri & Melnick (1992), who noted the narrow C iv line (200–300 km s-1) and suggested it may be a transition object between an Of or Of?p star and a WR star. It was already discovered as an emission-line star by Lindsay & Mullan (1963), LM 1-6; Meynadier & Heydari-Malayeri (2007) included it in their new class of low-excitation blobs. We note the similarity with SMC LMC 11. Egan, van Dyk & Price (2001) associated the IR source with the M3-type red giant GV 60, which is only away from Brey 3a. This star had been listed as an M-type supergiant in Westerlund, Olander & Hedin (1981), as WOH S 60. Although emission in the Spitzer IRAC, IRS and MIPS 24-m observations might have a contribution from this cool giant, there is no indication that it should be bright in the MIPS-SED range and in the MIPS 70-m filter. We therefore consider Brey 3a the source of the far-IR emission.
3.4. N 89 (#5)
The emission-line star LM 1-8 (Lindsay & Mullan 1963) was recognized as a very low-excitation nebula by Sanduleak & Philip (1977). An association with a nearby IRAS source was made in Loup et al. (1997). Considering it a compact H ii region, Joblin et al. (2008) discussed the Spitzer IRS spectrum of this object, showing evidence for both neutral and positively-charged PAHs (cations) as well as a population of very small grains. This suggests a photon-dominated region, either associated with an irradiated dust shell of an evolved object or with an H ii–molecular cloud interface in a star-forming region.
3.5. WOH G064 (#6)
WOH G064 was discovered by Westerlund et al. (1981) as an unremarkable red giant. It was soon found out by Elias, Frogel & Schwering (1986) to be a very luminous RSG; their mid-IR photometry revealed a thick dust shell with the 10-m silicate dust feature in self-absorption. They classified the optical spectrum as M7.5. Forbidden-line emission and at least some of the H emission were shown by van Loon et al. (2001b) to arise in the ISM. The self-absorbed silicate feature was confirmed in a groundbased 8–13 m spectrum (Roche, Aitken & Smith 1993), IRAS LRS spectrum (Kwok, Volk & Bidelman 1997), ISOPHOT-S spectrum (Trams et al. 1999), and Spitzer IRS spectrum (Buchanan et al. 2006). Van Loon et al. (1999b, 2005a) estimated a mass-loss rate, M⊙ yr-1, and luminosity, – L⊙. Ohnaka et al. (2008) resolved the dust shell using the VLTI, proving the suspected bipolar geometry, leading to a down-ward revision of the luminosity, L⊙. They derived a circumstellar envelope mass of 3–9 M⊙, for a gas-to-dust ratio –500. WOH G064 varies with an amplitude mag and a period (Whitelock et al. 2003) – 930 d (Wood et al. 1992).
Wood, Bessell & Whiteoak (1986) detected 1612 MHz OH maser emission from the wind; Wood et al. (1992) also presented the detection of one of the main lines at 1665 MHz. Van Loon et al. (1996) detected 86 GHz SiO maser emission, challenging the interpretation of the OH maser profile and the low wind speed derived from it. Van Loon et al. (1998b) detected 22 GHz H2O maser emission coincident with the SiO maser peak. They also presented an echelle spectrum of the Ca ii IR triplet showing light scattered off the expanding circumstellar dust envelope. Van Loon et al. (2001b) presented an improved SiO maser emission profile, possibly revealing absorption of the receding part, as well as an improved H2O maser profile showing also the satellite peaks indicating an accelerating wind. Finally, Marshall et al. (2004) detected the red peak of the OH maser emission, confirming the revised wind speed of km s-1.
3.6. IRAS 045576639 (#7)
This object is situated at the South-Western rim of the bubble created by the OB association LH 9 that gives the second largest star-forming complex in the LMC, N 11, its characteristic shape. It is embedded in the molecular cloud N11-03 (Caldwell & Kutner 1996; Israel et al. 2003) and the H ii region N 11I (Henize 1956). Rosado et al. (1996) noted that the embedded star in N 11I is unknown — we may now have found it. We identify it with the Herbig Ae/Be star #25 in Hatano et al. (2006), with mag.
3.7. IRAS 045626641 (#8)
On the Southern rim of N 11 (Henize 1956), and close to the molecular cloud N 11-02 (Caldwell & Kutner 1996; Israel et al. 2003), we identify this source with the Herbig Ae/Be star #44 in Hatano et al. (2006), with mag.
3.8. R 66 (#9)
S 73 in Henize (1956), better known as R 66, was typified by Feast, Thackeray & Wesselink (1960) as Aeq, where “e” stands for emission lines and “q” for P Cygni-type line profiles. It is now classified as a B8 Ia supergiant showing the B[e] phenomenon (Lamers et al. 1998b). Stahl et al. (1983) derived a temperature K, luminosity L⊙, stellar mass M⊙, and mass-loss rate M⊙ yr-1. It displays photometric Cyg-type variability, and may be a precursor of an S Dor-type LBV (van Genderen & Sterken 2002). It is also variable at near-IR wavelengths, mag (Wood et al. 1992). It is below the Humphreys-Davidson limit and rather cool (Zickgraf et al. 1986), and we thus suggest that it may be a blue-loop star on its way back to becoming a RSG. Nebular lines of low ionization energy indicated a PN-like shell (Stahl & Wolf 1986). Modelling of Fe ii lines suggested that apart from the 300 km s-1 wind there is a disc (Muratorio & Friedjung 1988); this was corroborated by CO -overtone emission at 2.3 m (McGregor, Hyland & Hillier 1988) and polarization measurements (Magalhães 1992). Kastner et al. (2006) presented the Spitzer IRS spectrum showing a flat continuum with silicate emission, including crystalline material as well as (weak) PAHs. They point out the similarity with Herbig Ae/Be discs. Given the composition this may be a debris disc, although it would have had to survive for Myr.
3.9. R 71 (#10)
S 155 in Henize (1956), better known as R 71, is one of the few LBVs in the LMC (for a review on LBVs see Humphreys & Davidson 1994). Feast et al. (1960) determined a spectral type B2.5 Iep at minimum light, whilst Thackeray (1974) determined a much cooler type of B9ep–A1eq at maximum light; a similar spectral change was observed from 2006 to 2008 (Munari et al. 2009). Lennon et al. (1993) determined a spectroscopic mass M⊙, and an initial mass –45 M⊙ based on the temperature –17,500 K and luminosity . They note the small oxygen-to-nitrogen ratio, implying strong CNO processing. It is in the S Dor instability strip (e.g., Smith, Vink & de Koter 2004), possibly post-RSG, and expected to explode as a supernova type Ib/c (Smith & Conti 2008). Van Genderen (1989) shows that R 71, like other S Dor variables can be distinguished from -Cyg-type variables by the higher amplitude of its micro-variability. Weak [N ii] nebular emission was detected by Stahl & Wolf (1986) who also measured a wind velocity of km s-1 from the H line profile. Glass (1984) detected 10-m emission from circumstellar dust. Wolf & Zickgraf (1986) then identified it with an IRAS source. Roche et al. (1993) detected the 10-m silicate feature in emission, and surmised that the longer-wavelength portion of the SED implies expulsion of significant amounts of dust yr ago. Voors et al. (1999) detected crystalline silicates and PAHs in an ISOCAM+SWS spectrum, and derived a dust mass of M⊙, ejected at a rate M⊙ yr-1 over the past 3000 yr. They noted that the far-IR emission implies M⊙ of additional dust ejected before that. They ascribed also the inner dust shell to previous RSG mass loss, but we note that it takes yr to evolve from the RSG to where we find R 71 today (van Genderen 2001). The presence of PAHs in the oxygen-rich wind may indicate non-equilibrium chemistry. That R 71 has already lost a significant fraction of its mass is further corroborated by the large -values of its pulsations (Lamers et al. 1998b).
3.10. IRAS 050476644 (#11)
We identify this IR source with the PN candidate RP 1933. Although centred away from the IR position, the PN has a diameter of (Reid & Parker 2006) and thus easily encompasses the IR source. Buchanan et al. (2006) presented the Spitzer IRS spectrum, displaying strong PAHs on a rising continuum; they estimated an IR luminosity of L⊙. This appears to make the object more luminous than the classical AGB limit, and casts doubt on a classification as a canonical PN. It must have a more massive progenitor.
3.11. SMP-LMC 21 (#12)
HST observations (Stanghellini et al. 1999; Vassiliadis et al. 1998b) of this high-excitation PN (Morgan 1984) revealed a -diameter quadrupolar nebula, with an expansion velocity of 27 km s-1 — we note that Dopita et al. (1988) measured km s-1. Reid & Parker (2006) listed a much larger diameter, so it may have an extended halo. The PN is oxygen-poor compared to nitrogen as well as argon, which suggests a relatively massive AGB progenitor, normal for Type I PNe (Leisy & Dennefeld 2006; cf. Dufour & Killen 1977; Leisy & Dennefeld 1996 — who also noted a strong, red continuum in the optical spectrum). Peña et al. (1994) claimed the central star is a WC-type WR star, at odds with a relatively massive AGB progenitor. Barlow (1987), Wood et al. (1987) and Boffi & Stanghellini (1994) determined an ionized mass in the nebula of 0.6, and 0.243 M⊙, respectively. Stanghellini et al. (2007) presented the Spitzer IRS spectrum showing crystalline silicates and both low- and high-excitation nebular emission lines, on a 130 K dust continuum. It has by far the strongest IR excess of the PNe in their sample.
3.12. SMP-LMC 28 (#13)
This is a compact PN () composed of three emission blobs, one is centred on the central star and the other two are faint arms particularly bright in [N ii] (Shaw et al. 2001). The PN expands at 55 km s-1 (Dopita et al. 1988) and is particularly rich in nitrogen (Stanghellini et al. 2005). Villaver, Stanghellini & Shaw (2003) derived a luminosity, , and temperature, K, which would suggest a M⊙ AGB progenitor. The ionized mass in the nebula is M⊙ (Wood et al. 1987). Zijlstra et al. (1994) identified the PN with IRAS 050816855. The Spitzer IRS spectrum (Bernard-Salas et al. 2009) shows a high neon abundance (Bernard-Salas et al. 2008).
3.13. SMP-LMC 36 (#14)
Van Loon et al. (2006) noticed the proximity of the PN to the mid-IR source MSX-LMC 45 = IRAS 051086839, but rule out that they are the same: the PN is distant from a very red near-IR point source that dominates also at mid-IR wavelengths. Classified as an OH/IR star by Egan et al. (2001), the IRAS/MSX source was identified on the basis of a 2.8–4.1 m spectrum by van Loon et al. (2006) as a luminous, , dust-enshrouded carbon star with an estimated mass-loss rate M⊙ yr-1. Although it is conceivable that the carbon star has a cold dust shell, we expect that the PN will dominate at far-IR wavelengths (Hora et al. 2008). The Spitzer IRS spectrum is dominated by emission lines and some PAHs, and thus clearly that of the PN (Bernard-Salas et al. 2008). The PN has unremarkable abundances, except for a high helium abundance of (de Freitas Pacheco, Costa & Maciel 1993; cf. Henry 1990). An expansion velocity of 35 km s-1 was measured by Dopita et al. (1988).
3.14. IRAS 051376914 (#15)
Coinciding with the H ii object N 112 (Henize 1956) = DEM L 109 (Davies et al. 1976), powered by the star cluster OGLE-CL LMC241 (Pietrzyński et al. 1999), the mid-IR source is associated with a bright, unresolved radio continuum source, and is likely a compact H ii region (Mathewson et al. 1985). Bojičić et al. (2007) carried out a detailed analysis of radio and optical data, which beautifully show its location at the NE edge of the SNR B0513692 (Mathewson et al. 1985). They found a second SNR J0513276911 due SE from the IRAS source. Although they did not see any evidence for interaction between the two SNRs and either of the SNRs and the compact H ii region they are all clearly associated with the same star-forming region. A molecular cloud was detected with an unusually narrow CO profile, km s-1 (Israel et al. 1993).
3.15. MSX-LMC 222 (#16)
Buchanan et al. (2006) presented a Spitzer IRS spectrum, which they argued lacks the high-ionization lines typical of PNe. This, and the extended mid-IR emission seen in the MSX band A image, they argued suggests that MSX-LMC 222 is associated with star formation. The nearby (), possibly associated cold IRAS source, IRAS 051416938, was searched for methanol emission by Beasley et al. (1996); no such emission was detected.
3.16. MSX-LMC 349 (#17)
Egan et al. (2001) classified this red source as an OH/IR star, but a 3-m spectrum revealed it to be a dust-enshrouded carbon star (van Loon et al. 2006). This was confirmed with a Spitzer IRS spectrum showing strong SiC emission at 11.3 m and MgS emission at m (Zijlstra et al. 2006). Groenewegen et al. (2007) derived a luminosity of L⊙ and a mass-loss rate of M⊙ yr-1; they also determined a period of d for its variability.
3.17. IRAS 052166753 (#18)
The nature of the bright H knot N 44A (Henize 1956) is elusive. Reid & Parker (2006) classified it as a “true” PN, albeit with a rather large H diameter of . It is a very luminous IRAS source, though, and unlikely to be a PN descending from an AGB star. Roche et al. (1987) detected emission from silicate dust in a groundbased 10-m spectrum of the associated bright, cool mid-IR source IRAS 052166753 = TRM 11. The global SED and lack of conspicuous variability bear resemblance to IRAS 045306910 (Wood et al. 1992). Indeed, in both cases van Loon et al. (2001b) suspected it is a dust-enshrouded, but hot, massive star (cf. Zijlstra et al. 1996). Chen et al. (2009) performed an in-depth assessment of all available data and concluded that the ionizing power requires an O9 I star, but that it is unclear whether it is young or evolved.
3.18. HS 270-IR1 (#20)
Egan et al. (2001) classified this cool mid-IR source as an OH/IR star. Van Loon, Marshall & Zijlstra (2005) subsequently associated it with a heavily reddened near-IR point source in the star cluster HS 270 (Hodge & Sexton 1966); from modelling the SED they inferred a possible nature as a post-AGB star. However, CO2 ice was tentatively detected in the Spitzer IRS spectrum (Oliveira et al. 2009) and we thus reclassify it as a YSO.
3.19. SMP-LMC 62 (#21)
IRAS 052577135 is associated with the emission-line object N 201 (Henize 1956; Loup et al. 1997; Leisy et al. 1997). This is a high-excitation PN, SMP-LMC 62 (Westerlund & Smith 1964; Sanduleak et al. 1978; Morgan 1984). Hora et al. (2008) presented the Spitzer SED, Bernard-Salas et al. (2009) the Spitzer IRS spectrum, and Vassiliadis et al. (1998b) an HST image showing a highly flattened ellipsoidal ring with a diameter (Villaver et al. 2007). The PN is oxygen-rich; the ionized mass is 0.44–0.59 M⊙ (Barlow 1987; Aller et al. 1987; Dopita & Meatheringham 1991; Boffi & Stanghellini 1994). From the FUSE spectrum, Herald & Bianchi (2004) derived K, L⊙, M⊙, mass-loss rate M⊙ yr-1, and wind speed km s-1. Dopita et al. (1988) measured an expansion velocity of the ionized nebula of (O iii) – 47.5 (O ii) km s-1. Dufour (1991) explained the high N/C ratio and normal helium abundance with Hot Bottom Burning (Renzini & Voli 1981), but Leisy & Dennefeld (1996) argued that this is inconsistent with the relatively low N/O ratio. Vassiliadis et al. (1998a) used HST spectra to derive a rather high helium abundance, and in particular a high Si/C ratio. The latter might be explained by re-accreted products from circumstellar grain destruction. Webster (1976) noted a similarity with the optical spectra of dusty symbiotic stars; Feibelman & Aller (1987) confirmed this possibility on the basis of the low C iii /Si iii ratio. Herald & Bianchi (2004) noted the O vi 1032,1038 nebular emission lines, a rarity for PNe. Like other LMC PNe in their sample, the FUSE spectrum of SMP-LMC 62 showed that hot ( K) H2 is present. They argued that a mixture of photo-excitation and shocks is needed to explain the spectrum. Uniquely in their sample, the H i in SMP-LMC 62 appears to be located within a volume of similar size to that of the ionized nebula. Interestingly, this was also one of the first extra-galactic radio PNe (Filipović et al. 2009); its detection at low frequencies is curious as this is more typical of optically-thick ionized regions which tend to have ionized masses M⊙. Filipović et al. argue for a class of “Super-PNe” where the radio emission is determined by environmental effects, with some similarity to SNRs. In conclusion, SMP-LMC 62 may not be the product of (canonical) AGB evolution.
3.20. N 51-YSO1 (#22)
This IR source was classified as an H ii source by Egan et al. (2001). It is situated in LH 54, a rich association with stars as early as O8 (Oey 1996), whose stellar winds may have created superbubble DEM L 192 = N 51D (Oey & Smedley 1998). The well-studied WR binary HD 36402 is only to the North-East. MSX-LMC 824 is located in between YSO1 and YSO2 discovered by Chu et al. (2005) in Spitzer images. YSO1 is the brighter of the two, and the target of the MIPS-SED observation. Chu et al. modelled the SED, deriving L⊙ (equivalent to a B2–3 main-sequence star) and an infall rate of M⊙ yr-1; the envelope may be as massive as 700 M⊙. Seale et al. (2009) presented the Spitzer IRS spectrum, displaying silicate dust absorption at 10 m, weak CO2 ice absorption at 15 m, weak fine-structure emission lines, and very weak PAH emission.
3.21. N 49 (#23)
N 49 (Henize 1956) = DEM L 190 (Davies et al. 1976) was first recognized as a SNR by Mathewson & Healey (1964), on the basis of its radio properties, and by Westerlund & Mathewson (1966), on the basis of strong [S ii] emission lines indicating shocks. It is listed in the Henry-Draper catalog as HD 271255 (see Morel 1984), with spectral type “N” (for nebular). Situated in the Myr-old association LH 53, its progenitor mass is likely M⊙ (Hill et al. 1995). Dynamical age estimates for the SNR range from 4400 yr (Hughes et al. 1998) to 6400 yr (Long, Helfand & Grabelsky 1981), consistent with the age of the associated -ray burster pulsar, of 5000 yr (Rothschild, Kulkarni & Lingenfelter 1994). The multi-phased shocked nature of the interaction between the ejecta and the ISM is shown beautifully in X-ray images (e.g., Park et al. 2003), far-UV spectra (Sankrit, Blair & Raymond 2004), and [Ne v] images at 0.34 m (Rakowski, Raymond & Szentgyorgyi 2007); see also the HST images presented by Bilikova et al. (2007), and the earlier work by Shull et al. (1985), for modelling, and Vancura et al. (1992b), for a high-resolution multi-wavelength synthesis. Brogan et al. (2004) detected an OH 1720 MHz maser in the Western part of N 49.
Graham et al. (1987) explained IR emission from the SNR by collisionally heated dust of 40 K. Williams et al. (2006), based on Spitzer IRAC and MIPS 24- and 70-m images, argued for a lack of PAHs and very small grains, possibly due to destruction by far-UV radiation from the shock precursor. They also described the Spitzer IRS spectrum, of the bright SE side of the 17-pc-diameter SNR ring (cf. Mathewson et al. 1983; Shull 1983), which lacks continuum emission from hot dust; Williams et al. thus argued that most of the mid- and far-IR emission arises from line emission. Our MIPS-SED observation was taken of the same bright spot. Cold CO (Sorai et al. 2001) emission was detected from — or just outside of — the same region, with a virial mass of the molecular cloud (Banas et al. 1997) or M⊙ (Mizuno et al. 2001). Modelling of the X-ray spectrum suggested that the SNR has swept up M⊙ of ISM (Hughes, Hayashi & Koyama 1998). Dopita (1976) already argued that the overabundant oxygen and especially nitrogen in the shocked regions might be due to the release of volatiles as icy grains are destroyed — Dennefeld (1986) also argued in favor of grain destruction.
3.22. IRAS 052806910 (#26)
Wood et al. (1992) associated this IR source with the cluster NGC 1984, and suggested it is a supergiant with a birth mass of –20 M⊙. Van Loon et al. (2005b) used high-resolution IR imaging to identify the stellar counterpart, the dust-enshrouded star NGC 1984-IR1; they proved it is not the M1 RSG WOH G347, at only a few arcseconds distance — this star (NGC 1984-IR2) is much brighter at near-IR wavelengths than IR1 but much fainter in the mid-IR — and neither the PN SMP-LMC 64, which is almost an arcminute away. This was confirmed by the different slopes of the 3-m spectra of IR1 and IR2 (van Loon et al. 2006). Double-peaked OH 1612 MHz maser emission was detected, as well as an OH 1665 MHz emission peak at a velocity outside of the 1612 MHz velocity range (Wood et al. 1992) and H2O 22 GHz maser emission within the OH 1612 MHz velocity range (van Loon et al. 2001b).
3.23. IRAS 052916700 (#27)
This red variable star, GRV 05296700 was discovered by Glass & Reid (1985). Reid, Glass & Catchpole (1988) determined a period of d, but this was revised to d by Whitelock et al. (2003) and d by Groenewegen et al. (2007) (who flagged the variability as being relatively regular, and note a long secondary period of 3020 d). Van Loon, Zijlstra & Groenewegen (1999) presented a 3-m spectrum showing C2H2+HCN absorption: evidence that it is a carbon star. The Spitzer IRS spectrum is noisy and rather featureless (Zijlstra et al. 2006), but confirms the carbon star classification. Groenewegen et al. (2007) derived a luminosity of L⊙ and a mass-loss rate of M⊙ yr-1, but their model fit does not reproduce the sharp upturn at m. It is rather puzzling why this unremarkable carbon star should be so bright at 70 m.
3.24. IRAS 052986957 (#28)
The classical example of an oxygen-rich massive AGB star, IRAS 052986957 shows the most beautiful double-peaked OH 1612 MHz profile of all Magellanic OH/IR stars (Wood et al. 1992); its large-amplitude variability with a very long period of d (Wood et al. 1992) is entirely consistent with that. The 3-m spectrum (van Loon et al. 1999a) and self-absorbed silicate feature at 10 m in the ISOCAM-CVF spectrum (Trams et al. 1999) confirm the oxygen-rich nature. Van Loon et al. (1998) noticed its location in the cluster HS 327 (Hodge & Sexton 1966), which led van Loon et al (2001a) to estimate a birth mass of M⊙. Van Loon et al. (1999b) derived a mass-loss rate of M⊙ yr-1.
3.25. IRAS 053256629 (#29)
Smith, Beall & Swain (1990) mistakenly identified this IRAS source with the High-Mass X-ray Binary LMC-X4, which however is away. Egan et al. (2001) classified it as a PN. Indebetouw, Johnson & Conti (2004), using high-resolution radio continuum observations, classified it as an ultra-compact H ii region within N 55A (Henize 1956), estimating a B0 V central star. Buchanan et al. (2006) reached the same conclusion, based on the environment and on the Spitzer IRS spectrum — characterized by prominent PAH and atomic line emission.
3.26. IRAS 053286827 (#30)
Identified with a near-IR counterpart by van Loon (2000), it was first presumed to be an evolved star; Egan et al. 2001 classified it as an OH/IR star. The 3-m and Spitzer IRS spectra, however, revealed characteristics of a YSO: water ice at 3 m, CO2 ice at 15 m, possibly methanol ice, and strong absorption from silicates at 10 and 20 m (van Loon et al. 2005c; Oliveira et al. 2009). It is located in the relatively isolated N 148 (Henize 1956) star-forming region.
3.27. RP 775 (#31)
Although Reid & Parker (2006) included it in their list of PNe, they noted it is half-hidden in a more extended H ii region. We therefore keep open the possibility that it is a young, or at least massive, stellar object.
3.28. IRAS 053296708 (#32)
Identified as a dust-enshrouded star by Reid, Tinney & Mould (1990), it was one of the first Magellanic AGB stars from which OH 1612 MHz maser emission was detected (Wood et al. 1992). It has the usual characteristics of an OH/IR star, such as a very long period of its large-amplitude variability, –1295 d (Wood et al. 1992; Wood 1998; Whitelock et al. 2003), and a strong 10-m silicate feature in (self-)absorption (Groenewegen et al. 1995; Zijlstra et al. 1996; Trams et al. 1999; Sloan et al. 2008). A mass-loss rate of M⊙ yr-1 was derived by van Loon et al. (1999b).
3.29. MSX-LMC 783 (#33)
Initially classified as a candidate OH/IR star by Egan et al. (2001), a Spitzer IRS spectrum clearly revealed it is a carbon star (Leisenring et al. 2008). We note here that the IRS spectrum displayed a dramatic upturn at m, but there is no obvious reason why this source should be so bright at 70 m.
3.30. HV 2671 (#34)
Alcock et al. (1996, 2001) discovered this variable star to be of the R Coronae Borealis type, carbon-rich objects experiencing sudden dimmings followed by slow recovery, with an atypically high K; the optical spectrum at maximum light displays C ii emission lines. De Marco et al. (2002) favoured an interpretation as a “born-again” post-AGB object, i.e. a star which has experienced a late thermal pulse whilst already on the post-AGB track; they estimated a luminosity of L⊙.
3.31. R 126 (#36)
This B[e] star — S 127 in Henize (1956) — has been known to display Balmer line emission for well over a century (Pickering & Fleming 1897); Fe ii and [Fe ii] lines have been seen in emission too (e.g., Stahl et al. 1985). The spectral type of B0.5 Ia+ corresponds to K and L⊙ (Zickgraf et al. 1985; cf. Shore & Sanduleak 1984), making it one of the most luminous stars known. Zickgraf et al. (1985) suggested a birth mass of –80 M⊙. They detected a stellar wind with km s-1. Van Genderen & Sterken (2002) detected small-amplitude brightness variations, and suggested a link to S Dor-type instability. The star appears to dip in brightness by 0.2–0.3 visual magnitudes, briefly, in a semi-regular way on a timescale of about a year (see van Genderen et al. 2006). Smith (1957) noticed the steep Balmer decrement; Allen & Glass (1976) argued that this is not caused by reddening (cf. Koornneef & Code 1981), but they did supply early evidence for circumstellar dust. Roche et al. (1993) noticed the weakness of the 10-m silicate emission feature. Kastner et al. (2006) presented the Spitzer IRS spectrum, which is dominated by emission from amorphous silicates. They estimated that M⊙ is present within an envelope of radius 2500 AU, illuminated by only 15% of the stellar luminosity. Detailed models including an equatorial disc were presented by Porter (2003) and Kraus, Borges Fernandes & de Araújo (2007) (cf. Zsargó, Hillier & Georgiev 2008).
3.32. 30 Dor-17 (#37)
Despite its location in the 30 Doradus mini-starburst region, in the N 157B nebula (Henize 1956), this is a little-documented molecular cloud with a virial mass M⊙ (Johansson et al. 1998). It harbors an embedded YSO (Blum et al. 2006) and CO2 ice was detected in the Spitzer IRS spectrum (Oliveira et al. 2009). At at either side are an emission-line object (Reid & Parker 2006) and an O7 V star (Schild & Testor 1992); cf. Oliveira et al. (2006) for IR and 22 GHz observations of N 157B.
3.33. N 158B (#38)
The Spitzer IRS spectrum (Buchanan et al. 2006) of this bright knot in the N 158B nebula (Henize 1956) is that of a typical H ii region, with emission from PAHs, atomic lines, and dust. It is likely to harbor a massive star or stellar aggregate, but its age is uncertain.
3.34. N 159-P2 (#39)
IRAS 054016947, in N 159A (Henize 1956), was resolved into two components using the ISOCAM instrument, viz. LI-LMC 1501E and W (Comerón & Claes 1998). The Eastern component had been identified by Jones et al. (1986) as the second extra-galactic protostar, P2, using Kuiper Airborne Observatory 50- and 100-m and groundbased near-IR data. It was characterized on the basis of Spitzer IRAC images as a Class I protostar of moderate luminosity, L⊙ (Jones et al. 2005). Jones et al. refuted an association between the protostar and the radio continuum emission, which instead they attributed to the nearby O5 and O7 stars (Deharveng & Caplan 1992). Nakajima et al. (2005) identified a near-IR stellar counterpart, which was subsequently resolved by Testor et al. (2006) into two equally bright and very red (–4.77 mag) stars apart.
3.35. N 160-1 (#40)
This far-IR source is close to a molecular cloud with an uncertain virial mass, M⊙ (Johansson et al. 1998) or M⊙ (Indebetouw et al. 2008). One may suspect it is a YSO, but the association between the IR source and CO emission is not certain; cf. Oliveira et al. (2006) for 22 GHz observations of N 160A.
3.36. N 159S (#41)
Located in the molecular ridge due South of the 30 Dor complex, N 159S is the brightest knot in the ring-shaped nebula N 159E (Henize 1956; Israel & Koornneef 1991). On Spitzer IRAC images, N 159S appears very compact but noticeably extended (Jones et al. 2005). It is near a quiescent molecular cloud, which has a temperature K and density cm-3 (Heikkilä, Johansson & Olofsson 1998). This was confirmed by Bolatto et al. (2000) in spite of it being the brightest [C i] source in the region. A large virial mass of M⊙ was estimated by Minamidani et al. (2008).
3.37. WOH G457 (#43)
Although identified with the AGB variable star WOH G457, the MIPS-SED pointing differs by . This region contains several molecular clouds, and an association with an optically inconspicuous compact dust cloud or YSO is perhaps more likely. The same may be true for the nearby, anonymous MIPS-SED target UFO 1.
3.38. MSX-LMC 1794 (#46)
At the edge of a more extended H ii region, this is an unremarkable (ultra)compact H ii source except for the fact (which we note here) that in the Spitzer IRS spectrum (Buchanan et al. 2006) the 17-m PAH complex is relatively strong and the continuum emission in the 20–35 m range resembles a power-law more than a dust emission continuum.
3.39. MSX-LMC 956 (#47)
The IR source appears as a bright knot on the rim of the H ii region N 176 (Henize 1956) = DEM L 280 (Davies et al. 1976) (cf. Indebetouw et al. 2008). Somewhat further West lie two molecular clouds, viz. 30 Dor Center 6 (Kutner et al. 1997) and 30 Dor-C07 (Caldwell & Kutner). Though both named central to 30 Dor, they are really part of the Southern molecular ridge distinguished from the 30 Dor giant H ii region (the Tarantula Nebula).
3.40. BSDL 2959 (#48)
Maybe associated with IRAS 054586710, BSDL 2959 is one of a pair (with BSDL 2956) of small star clusters with associated nebulosity (Bica et al. 1999), located within the N 74A H ii region (Henize 1956).
4. Results


The MIPS-SED spectra of all 48 targets are presented in Figure 4. Four sources have poor or bad spectra. One of these, MSX-LMC 349, was not detected (a spectrum was extracted nonetheless, but no trace of the target could be detected in the 2-D frames); it is clearly detected in the broad MIPS 70-m band, but at a level similar to the structured background (see Fig. 2). Table 4 summarizes properties derived from the Spitzer data.
Often, one or two fine-structure emission lines can be seen, [O i] 3P(1–2) and [O iii] 3P(0–1), at and 88.4 m, respectively. These are discussed in §5.1. There is no convincing detection of the [N iii] 2P(1/2–3/2) transition at m, and we discuss the implication in §5.2. There is evidence for additional discrete features in the spectra of some objects, but their identification is uncertain. They are discussed in §5.4. The slope of the continuum is generally either steeply rising (most common) or steeply declining (less common); this is an indication of differences in dust temperature and is discussed in §5.3.
4.1. Clarification of the nature of selected objects
4.1.1 IRAS 045376922/GV 60 (#4), WOH G457 (#43)
The MIPS-SED spectra of IRAS 045376922 and WOH G457 are definitely not typical of M-type giants with warm circumstellar dust, and therefore unlikely to be due to GV 60 and WOH G457, respectively. We confirm that the MIPS-SED spectrum of IRAS 045376922 is that of the WR-type star Brey 3a. The true MIPS-SED source associated with the WOH G457 pointing is likely a YSO (see Indebetouw et al. 2008).
4.1.2 The B[e] star IRAS 045306916 (#3)
The question here is, whether this B[e] star is an evolved object or a young, embedded star. The MIPS-SED spectrum looks very much like that of YSOs, with a steeply rising dust continuum and an [O i] emission line. This is very different from the MIPS-SED spectra of the known evolved B[e] stars in our sample, R 66 and R 126, that have a declining dust continuum. We thus conclude that IRAS 045306916 is young, not an evolved star.
4.1.3 The very low excitation nebula N 89 (#5)
This object has a MIPS-SED spectrum very much like that of the young B[e] star IRAS 045306916 described above, and we thus tentatively conclude that N 89 too is a young object.
4.1.4 The (proto-)Planetary Nebulae (candidates): SMP-LMC 11 (#2), -21 (#12), -28 (#13), -36 (#14), and -62 (#21), and RP 85 (#44) and IRAS 050476644 (#11)
These objects show very similar and characteristic MIPS-SED spectra, with a rather faint and flat dust continuum and no — or weak — emission lines. This includes SMP-LMC 62, which lacks evidence for either strong shocks (strong [O i], see §5.1.1) or a high electron density (strong [O iii]) and which might therefore not be so extra-ordinary but a normal PN. It also includes RP 85, confirming its likelihood of being a normal PN.
However, the exception is IRAS 050476644, whose PN nature was in doubt for its huge size and super-AGB luminosity. The MIPS-SED spectrum of this source is totally different from the PNe, with a rising continuum and strong emission lines. We suggest this object is more likely to be a luminous, i.e. massive, object and not a genuine PN.
4.1.5 The H ii blobs: IRAS 051376914 (#15), IRAS 053256629 (#29), RP 775 (#31), N 158B (#38), and MSX-LMC 1794 (#46), and the nebulous star cluster BSDL 2959 (#48)
These (ultra?)compact H ii regions have similar spectra, with a rising dust continuum and one or two emission lines. They are probably young, massive stars in the process of sculpting an ionized cavity inside their dust cocoons.
The dust in N 158B seems somewhat warmer, and together with the rather strong [O i] line its MIPS-SED spectrum resembles more that of IRAS 050476644. Hence, we classify N 158B as a high-mass star, but are undecided about its youthfulness.
4.1.6 The unclassified sources: MSX-LMC 577 (#24), IRAS 052817126 (#25), MSX-LMC 741 (#35), UFO 1 (#42), SAGE 054077011 (#45), and MSX-LMC 956 (#47)
These six sources lack classification in the literature. The latter three are almost certainly YSOs (see Indebetouw et al. 2008). The MIPS-SED spectra of the first two also resemble YSOs.
The spectrum of MSX-LMC 741 is rather noisy as the object is faint at 70 m. The MIPS photometry and MIPS-SED spectral slope both suggest a lack of cold dust. It is in fact similar to the high-mass stellar object IRAS 052166753; we concur that both are likely to represent mature or evolved evolutionary stages.
4.1.7 The extra-galactic nature of SAGE 043746754 (#1) and SAGE 052236841 (#19)
Two of the three SAGE-named objects show a rising continuum but no conspicuous emission lines at the expected positions (hence their classification as C0, see §4.3). At least one of them, SAGE 043746754 is a background galaxy: the Spitzer IRS spectrum of this isolated, very red object, which is seen toward the outskirts of the LMC, undoubtedly reveals a redshift of (Woods et al., in prep.). We speculate that the other, SAGE 052236841 is a background galaxy too. In most galaxies the [O i] line at 63 m is brighter than the [O iii] line at 52 m, e.g., in the nearby starburst galaxy M 82 (Colbert et al. 1999), the giant elliptical Active Galactic Nucleus Cen A (Unger et al. 2000), and the normal spiral galaxy NGC 4414 (Braine & Hughes 1999). The ratio of the [O i] line flux to the far-IR flux is typically just over , while for the [O iii] line (at 52 m) it is usually a few times less than that (Negishi et al. 2001), though not always (cf. Lord et al. 1996). If the line at 80 m observed in the MIPS-SED spectrum of SAGE 052236841 is the redshifted [O i] line then the redshift would be ; if it is the [O iii] line then it would be .
4.2. Serendipitous spectra

A number of additional spectra could be extracted from the 2-D frames (Table 5 and Fig. 5). These sources were not generally well-centered within the slit, which will have led to flux losses — no attempt was made to correct for this. In three instances the serendipitous spectra were of principal targets, viz. N 49 (although a different portion of the SNR), SAGE 054077011, and MSX-LMC 956. The spectrum of this part of N 49 does not exhibit as strong an [O i] line as the principal target position. The spectra of the other two re-observed sources are consistent with the original observations.
4.2.1 LH 55 (#24B)
The stellar association LH 55 (Lucke & Hodge 1970) sits in an H ii region from which were detected soft X-rays (Wang & Helfand 1991) and radio continuum emission (Filipović, Jones & White 2003, and references therein).
4.2.2 IRAS 053306826 (#30B)
This IR source (also MSX-LMC 770) is likely a compact H ii region (Egan et al. 2001; Kastner et al. 2008) and a weak source of radio continuum emission (#49 in Marx, Dickey & Mebold 1997). It was imaged in the peak-up array while acquiring the IRS spectrum of IRAS 053286827 (van Loon et al. 2005c). The MIPS-SED spectrum is of good quality, and is characterized by a cold continuum on top of which there is some line emission from [O i] and [O iii] (Fig. 5).
4.2.3 [H88b] 86 (#38B)
This IR source is possibly associated with the dark cloud [H88b] 86 (Hodge 1988), measuring pc2. This is commensurate with the MIPS-SED spectrum which is rather featureless and steeply increasing (Fig. 5), suggesting a quiescent, cold dust cloud.
4.2.4 N 160-3 (#40B)
The MIPS-SED spectrum (Fig. 5) of the compact far-IR source within this molecular cloud resembles that of (ultra)compact H ii regions, with a clear [O iii] line.
4.2.5 N 159-K4 (#41B)
This near-IR source is only moderately red (Gatley, Hyland & Jones 1982); the MIPS-SED spectrum (Fig. 5) is rather flat, suggesting that N 159-K4 may be a hot, massive star inside a molecular cloud.
4.2.6 BSDL 2955 (#48B)
The association BSDL 2955 (also MSX-LMC 1432) is in fact closer to IRAS 054586710 (and brighter at 70 m) than the MIPS-SED principal target, BSDL 2959.
4.3. A simple MIPS-SED classification scheme
The limits in resolution and spectral range result in few conspicuous spectral features that nonetheless vary considerably between sources. It thus remains meaningful to devise a simple classification scheme, based on the spectral appearance. We dub this “The Keele System”. The primary spectral type is defined as follows:
-
An upper-case letter denotes the continuum slope, for a spectrum expressed in Fν as a function of : C = rising (e.g., cold dust); F = flat (this includes spectra with a peak mid-way the MIPS-SED range); W = declining (e.g., warm dust);
-
Following the upper-case letter, a number denotes the presence of the [O i] and [O iii] lines: 0 = no oxygen lines are present; 1 = the [O i] line is present, but the [O iii] line is not; 2 = both [O i] and [O iii] lines are present; 3 = the [O iii] line is present, but the [O i] line is not.
A secondary classification is based on additional features: a lower-case letter “b” may follow the primary type in the presence of a bump in the –80 m region.
Clearly, the primary type can be a diagnostic of the dust temperature and the excitation conditions in the gas. The secondary type has less immediate diagnostic value, but it may be used to isolate special classes of objects. This can be explored by investigating how the spectral types vary among the different classes of targets, and the degree at which secondary and primary subclasses are correlated. This we shall do in §5.
We have classified all MIPS-SED spectra (Tables 4 & 5). We have erred on the side of caution with respect to the detection of spectral lines. So, for instance, an object with spectral type C0 may still display weak oxygen lines in a higher-quality spectrum..
5. Discussion
We first discuss the prominent oxygen fine-structure emission lines (§5.1), followed by the nitrogen line (§5.2), and then the dust continuum (§5.3) and discrete features possibly due to ice, molecules or minerals (§5.4). At the end of this section, we summarize the population MIPS-SED characteristics (§5.5).
5.1. Oxygen
The [O i] and [O iii] lines at and 88 m, respectively, are of great diagnostic value with regard to the excitation conditions of the gas within the objects, even if these lines are absent. Unfortunately, the [O iii] 3P(1–2) transition at m is just outside the spectral range covered by MIPS-SED; the [O i]63/[O iii]52 flux ratio is a good measure of the electron density (e.g., Liu et al. 2001), but the [O i]63/[O iii]88 line ratio can also be used for that (Giannini et al. 2000; Rubin et al. 1994). The line luminosities can be found in Table 4, for an assumed distance of 50 kpc. They were computed by summing the three spectral points centered on the line after subtracting a continuum obtained by linear interpolation between the spectral points immediately adjacent to the integration interval. The error was computed by adding in quadrature the errors in the three spectral points that were summed, and three times the error in the mean of the two continuum anchors (to account for the error in the continuum estimate at each of the three spectral points).
We first describe the use of the [O i] line as a diagnostic of fast shocks, in the context of its prominence in the MIPS-SED spectrum of the only known SNR in our sample, N 49. Then, we discuss the appearance of the lines, first in H ii regions, molecular clouds, and YSOs within them, and then in evolved objects. After that, we assess their contribution to broadband photometry, which will be useful in interpreting the MIPS photometric properties of objects for which no spectral information is available.
5.1.1 Shocks versus photon-dominated regions
The [O i] line is the main cooling transition in the dense post-shocked regions of dissociative J-type shocks (e.g., Giannini, Nisini & Lorenzetti 2001; cf. Hollenbach & McKee 1989). Whereas in C-type shocks it is only a minor coolant, H2 being the dominant coolant (Le Bourlot et al. 2002). J-type shocks are more powerful ( km s-1) and associated with strong sources of feedback, C-type shocks ( km s-1) are more typical of the ambient ISM. So, in a SNR for instance a J-type shock might be anticipated. Indeed, this was observed in the SNR IC 443, which is seen to be interacting with a molecular cloud (Burton et al. 1990; Rho et al. 2001). In the absence of such strong interaction the [O i] line is fainter than the [O iii] line, as observed in the Crab Nebula (Green, Tuffs & Popescu 2004) and in SN 1987A (Lundqvist et al. 1999).
With an excitation temperature of K, the [O i] line also forms in photon-dominated regions (PDRs), such as the interface between an H ii region and a molecular cloud (Giannini et al. 2000; cf. Tielens & Hollenbach 1985). It is the main coolant of infalling envelopes around YSOs (Ceccarelli, Hollenbach & Tielens 1996). In contrast, the [O iii] line is strong in highly-ionized diffuse gas (Mizutani, Onaka & Shibai 2002), as observed with the KAO in 30 Dor by Lester et al. (1987).
5.1.2 Shocks in the SNR N 49
The only known SNR in our sample, N 49 exhibits a phenomenally strong [O i] line, by far the strongest with respect to the continuum in our entire sample. This is an impressive confirmation of the work of strong shocks in the interaction interface of the SNR with an adjacent molecular cloud. It is testimony of the destructive effect SNe have on dust in the surrounding ISM. One could anticipate N 49 to be a bright source of -rays, resulting from particle acceleration in these shocks.
5.1.3 Oxygen in star-forming regions and YSOs
Ultra-compact H ii regions always show the [O i] line, but not always the [O iii] line (Peeters et al. 2002). And though the former generally outshines the latter, there are cases in which the [O iii] line is dominant. For instance, Lerate et al. (2006) found in the Orion KL region [O i] and [O iii] to be comparatively similar in strength; Giannini et al. (2000) found that in the molecular cloud associated with NGC 2024, [O i] is more than ten times brighter than [O iii]. Higdon et al. (2003) found that H ii regions in M 33 exhibit [O iii] lines of similar strength to [O i] or (much) stronger, e.g., in NGC 604. Thus, there may exist a chronological sequence from [O i]-dominated molecular clouds to [O iii]-dominated giant H ii regions.
[O i] is observed in dark clouds, due to shocks (Nisini et al. 1999a). Although some embedded outflow sources exhibit a rather featureless spectrum (Froebrich et al. 2003), weak [O i] emission is seen on top of the cold continuum of Class O protostar L 1448-mm (Nisini et al. 1999b; Ceccarelli et al. 1998). Van den Ancker, Tielens & Wesselius (2000) compared the flat-continuum sources S 106 IR and Cep A East: [O i] is strong in S 106 IR but very weak in Cep A East; the former is dominated by a PDR (cf. Schneider et al. 2003) whereas the latter is heavily embedded.
Shocked gas was found in the vicinity of the pre-main sequence system T Tauri (Van den Ancker et al. 1999). Van den Ancker, Wesselius & Tielens (2000) showed that in Herbig Ae/Be stars, [O i] is considerably stronger than [O iii] (cf. Lorenzetti et al. 2002). However, [O iii] is sometimes seen in Herbig Ae/Be stars (e.g., V645 Cyg; Lorenzetti et al. 1999), and also in the outflow protostar TC 4 in the Trifid Nebula (Lefloch & Cernicharo 2000); it is stronger than [O i] also in the molecular cloud core M 17-North (Henning et al. 1998). This may be due to massive protostars already carving out an ultra-compact H ii region whilst still heavily embedded. We thus take the [O iii] line as a diagnostic of (ultra-)compact H ii regions surrounding massive stars, and the [O i] line as a diagnostic of shocks or PDRs in earlier stages or less massive protostars.
The YSOs 30 Dor-17 and N 159-P2 are exquisite examples of intense [O iii] emitters. These must contain compact H ii regions, with shocks due to molecular outflows only playing a minor rôle.
5.1.4 Oxygen in evolved objects
Haas & Glassgold (1993) and Haas, Glassgold & Tielens (1995) detected [O i] in the famous RSGs Betelgeuse, Antares and Rasalgethi ( Herculis), and they argued that the line is formed in the inner part of the dense wind, roughly where dust condenses. The line would therefore be a very useful probe of this critical region in the outflow. In our sample, the line is indeed visible in the cool, very luminous RSG WOH G064 (see §5.1.5), but not in any of the other OH/IR stars in our sample.
In objects evolving beyond a cool, dusty phase, such as proto-planetary nebulae (the early transition stage between AGB and PN), the relative intensities of the [O i] and [O iii] lines may act as a chronometer: Castro-Carrizo et al. (2001) and Fong et al. (2001) found that fine-structure lines are only seen in evolved stars with K, i.e. they arise from PDRs not shocked regions. [O i] is stronger than [O iii] in PNe with plenty of (warm) dust, but much the opposite in PNe lacking (warm) dust (e.g., Bernard-Salas & Tielens 2005). For example, [O i] is seen on top of a warm continuum in the proto-planetary nebula IRAS 165944656 (García-Lario et al. 1999), and even in the carbon-rich proto-planetary nebula CRL 618 (Herpin & Cernicharo 2000); on the other hand, no fine-structure lines were detected in the carbon-rich proto-planetary nebula AFGL 2688 (the Egg Nebula; Cox et al. 1996) which has a warm continuum too.
Interestingly, of the seven (proto-)PNe in our sample, four are classified F0, whilst the spectra of the others are slowly-rising but no or hardly any trace of oxygen line emission; the only exception being IRAS 050476644 which shows cold dust and both oxygen lines (and an additional feature at 78 m). The latter may not be a PN, though (see §3.10). No oxygen lines are detected in any of the four carbon-rich objects in our sample.
5.1.5 Detection of oxygen fine-structure line emission in the RSG WOH G064
With a line flux of W m-2, the [O i] line in WOH G064 is only times as dim as the line in Betelgeuse and Antares, which are only pc away rendering the line in WOH G064 times as powerful. This may be due in part to the much higher mass-loss rate of WOH G064, M⊙ yr-1 (van Loon et al. 1999b; Ohnaka et al. 2008) compared to a few M⊙ yr-1 for Betelgeuse and M⊙ yr-1 for Antares (Haas et al. 1995). But this still leaves unexplained a factor –6 difference. The dust-free zones in metal-poor envelopes appear to extend further than those in metal-richer, dustier envelopes (van Loon et al. 2005a), and the outflow velocities are lower leading to higher densities in the wind (Marshall et al. 2004); this would help explain the bright line in WOH G064.
We may speculate that a larger (weakly) ionized region might facilitate Alfvén waves to couple to the circumstellar gas reservoir and thus (help) drive a wind, where in neutral media Alfvén waves would not couple and quickly damp (see Hartmann & MacGregor 1980).
Alternatively, we may have sampled emission from the ISM surrounding WOH G064, as in the case of the optical fine-structure lines.
5.1.6 The contribution of oxygen fine-structure line emission to MIPS 70-m broadband photometry
The MIPS 70-m band peaks around m, and the filter response function, , drops to half the peak value at and m. At the positions of the [O i] and [O iii] lines, and , respectively. Thus, in particular a very strong [O i] line can make a considerable contribution to the total flux in the MIPS 70-m band. To assess the extent to which this is the case, we determined the ratio of the bandpass-convolved [O i] line flux to the bandpass-convolved integrated MIPS-SED spectrum.
The SNR N 49 has a strong contribution from [O i]: 11% of the MIPS 70-m flux is due to this line. We thus caution the use of the 70-m band to determine dust content of SNRs — as is the case for the 24-m band. Still, the effect is modest even for the intense line in N 49. The next most extreme [O i] emitters (in terms of line-to-continuum ratio), IRAS 050476644, IRAS 051376914 and N 158B are only affected at the 1% level. The most extreme [O iii] emitters, N 159-P2 and 30 Dor-17 are only affected by the [O iii] line emission by 1%, in spite of their huge line-to-continuum ratio of about two.
5.2. Nitrogen
The ionization potentials of the first four stages of nitrogen and oxygen are very similar — 14.5/13.6, 29.6/35.1, 47.4/54.9, and 77.5/77.4 eV for N0/O0, N+/O+, N2+/O2+, and N3+/O3+, respectively — and thus the nitrogen-to-oxygen abundance ratio (Lester et al. 1987; Simpson et al. 1995; Liu et al. 2001). The emissivity ratio increases from at cm-3 to at cm-3 (Liu et al. 2001).
PNe range from to , where 0.12 is the solar value (Dinerstein et al. 1995; Rubin et al. 1997; Liu et al. 2001). Lester et al. (1987) used KAO data to perform measurements also in 30 Dor; –0.40 in Galactic H ii regions but in 30 Dor (Rubin et al. 1988; Simpson et al. 1995). Rudolph et al. (2006) summarize similar results: in ultra-compact H ii regions in the central regions of the Milky Way, , but it decreases to beyond Galactocentric distances of kpc (Rudolph et al. 1997); values in the LMC are and even lower in the SMC (Roelfsema et al. 1998).
Can we place interesting upper limits? [O iii] is faint in most of our targets, so it would be difficult to detect the [N iii] line. But in the objects with the strongest [O iii] line, 30 Dor-17 and N 159-P2, we would have expected to detect the [N iiii] line at times the continuum. This is clearly not the case. Recognizing that a 3- detection would amount to of the flux in the [O iii] line in N 159-P2, we place a firm upper limit of , but quite possibly as low as as the strong [O iii] line compared to the dust continuum indicates a high electron density.
5.3. Dust continuum
We define the continuum slope as follows:
| (2) |
such that in a flat spectrum and in the Rayleigh-Taylor approximation of a relatively hot Planck curve. These values were computed from the mean values of the three spectral points centered at 55 and 85-m, respectively, and are listed in Tables 4 & 5. The error was computed by propagation of the standard deviations in the two sets of three spectral points used.
The MIPS-SED continua of the objects of our study are due to emission from relatively cool dust (typically 20–200 K). The 70-m band is dominated by emission from big grains, 15–110 nm in size, in contrast to the 24-m band which is dominated by the emission from very small grains (VSGs; if present), 1.2–15 nm in size (Désert, Boulanger & Puget 1990; Galliano et al. 2003). The MIPS-SED spectra can not yield reliable dust masses, but far-IR emission or the lack thereof can place constraints on the production of dust by evolved stars in the distant past. In YSOs and molecular clouds only a rather meaningless lower limit to the dust mass can be obtained as contributions from (even) colder dust are not probed adequately. In the following, we first estimate dust temperatures, before making attempts to quantify the amount of dust and the timing of its origin.
5.3.1 Dust temperatures

The dust temperature characterizing the MIPS-SED range is a powerful discriminant between warm circumstellar envelopes of evolved stars and cold molecular clouds in star-forming regions. We have estimated the dust temperature by comparison with a single grey-body:
| (3) |
where is a Planck emission curve at the dust temperature , the optical depth , and –2, here assumed (cf. Goldsmith, Bergin & Lis 1997) and thus to very good approximation in the MIPS-SED range . Representative curves are plotted in Figure 6, along with a graph of the relation between the spectral slope (Eq. 2) and temperature. The temperatures estimated from the spectral slopes are listed in Table 4.
The YSOs and other objects intimately associated with the process of star formation have temperatures in the range –44 K. This compares well with H ii regions in M 33, which have typically –50 K. The temperatures in molecular cloud cores can be lower; ISO-LWS measurements in the Serpens molecular cloud core yield –33 K (Larsson et al. 2000). In our sample, only the galaxy SAGE 043746754 and the carbon star MSX-LMC 349 (cf. S 5.3.2) display such low (apparent) temperature. Higher temperatures were derived in the Cygnus X cloud DR 21, –42 K (Jakob et al. 2007), which again is similar to the range in temperatures in our LMC sample of YSOs.
The dust surrounding SN 1987A is of similar temperature to the YSOs and compact H ii regions, viz. K (Lundqvist et al. 1999). The dust in the SNR N 49 appears to be somewhat warmer, K, possibly because the dust is heated in the prominent shocks that characterize that object.
The RSGs WOH G064 and IRAS 052806910 have no important contribution from dust much colder than K. This limits the amount of dust produced in the past (see §5.3.2). The same is true for the LBV R 71.
5.3.2 The origin of cold dust in evolved objects
Following Sopka et al. (1985), the dust equilibrium temperature in an optically thin envelope falls off with distance to the photosphere as , where . So, in our case we assume . Applying this to the RSGs WOH G064 and IRAS 052806910, assuming typical values for the inner radius of the dust envelope, km, and dust condensation temperature, K, one would estimate dust of a temperature –130 K to be located at a distance few km. At a wind speed of km s-1 (Marshall et al. 2004) this would have taken a few thousand years to get there. This strongly suggests that the mass-loss rate had increased quite dramatically around that time (the onset of the “superwind”; cf. Suh & Jones 1997, who model the SED resulting from an enhanced mass-loss episode).
The MIPS-SED data of the other two OH/IR stars, IRAS 052986957 and IRAS 053296708, is of lower quality but if the lower dust temperatures of –94 K may be believed this could imply a longer duration of the prolific dust production. Because of their lower luminosity compared to the RSGs discussed above, the dust condenses closer to these stars in absolute terms, at few km, resulting in a distance km at which K. At a slower wind speed, km s-1 (Marshall et al. 2004), the dust was produced a few thousand years ago, at a very similar time as the cool dust in WOH G064 and IRAS 052806910. This suggests that the duration of the superwind is several thousand years and does not differ very much between massive AGB stars and RSGs. Given that the mass-loss rate during this phase scales approximately with mass (van Loon et al. 1999b), this means that in proportion to their birth mass, RSGs and (massive) AGB stars lose a similar amount of mass during the superwind phase.
Similar estimates can be made for the LBV R 71: for a stellar radius of R⊙, a dust equilibrium temperature of 107 K is reached at few km. Assuming a constant outflow speed km s-1, this material was expelled yr ago — or several times longer if it originated in a slower RSG wind. This now seems to reconcile the post-RSG evolutionary timescale with an origin of the cool dust in a RSG superwind (see §3.9) as described above.
The origin of the cold dust apparently associated with the carbon stars, MSX-LMC 349, IRAS 052916700 and MSX-LMC 783, is rather puzzling. Its inference is more based on the 70-m photometry than on the MIPS-SED data. These are indeed faint point sources seen against a relatively bright, non-uniform background (Fig. 2). This suggests that the detected carbon stars may be seen plowing through relatively dense ISM, and swept-up ISM is the cause for the far-IR emission rather than dust produced in the winds of these carbon stars. To some extent this may be true also for the PNe in our sample.
5.3.3 The amount of swept-up ISM in the SNR N 49
To estimate the amount of material associated with the piled-up dust in N 49, we first estimate the dust mass following Evans et al. (2003), adopting for the absorption coefficient at m a typical value, cm2 g-1 (Mennella et al. 1998). The Jy of continuum emission from 45-K dust sampled in N 49 (Fig. 4; 20% less than the photometric estimate listed in Table 3) thus corresponds to M⊙. For a gas-to-dust mass ratio of this yields M⊙ in total — much less than that in the adjacent molecular clouds but very similar to the 200 M⊙ of swept-up ISM estimated from X-ray emission (Hughes et al. 1998) and the 150 M⊙ of matter collected from a sphere of 17 pc diameter filled with 1 particle cm-3.
5.4. Ice, molecules, and minerals
Roughly half of the sample show an additional discrete spectral feature in the –80 m region. This might be due to molecular or solid-state (dust or ice) material. In this section we assess the possibility that we detect water ice, molecular emission or minerals.
5.4.1 Water ice
Crystalline water ice has a strong band in the MIPS-SED spectral range. The position varies between –66 m and the feature can extend beyond 70 m (e.g., Malfait et al. 1999; Dijkstra et al. 2006). Apart from YSOs it is also sometimes seen in detached shells around highly-evolved stars: e.g., the post-AGB objects IRAS 09371+1212 (Frosty Leo, Omont et al. 1990) and AFGL 4106 (Molster et al. 1999), and the PN NGC 6302 (e.g., Barlow 1998) (cf. Sylvester et al. 1999).
In the low-resolution MIPS-SED data, it can be hard to distinguish between the water ice band and the[O i] line at 63 m even though the ice band would be resolved. Unfortunately, we do not have the sharp 44-m band for confirmation, as it falls between the IRS and MIPS-SED coverages. Thus, we can only reasonably argue for the presence of crystalline water ice if the feature is strong, so one can distinguish its broad shape from an unresolved atomic line, or it peaks around or 66 m, i.e. clearly displaced from the [O i] line.
This appears to be the case in N 51-YSO1, MSX-LMC 577, MSX-LMC 783, UFO 1, and MSX-LMC 1794. These are all heavily embedded, cold sources associated with star formation. Interestingly, all these objects also show a broad bump around m. CO2 ice was already detected in the Spitzer IRS spectrum of N 51-YSO1 (Seale et al. 2009).
The only other YSOs in the MIPS-SED sample that are known to contain ice are HS 270-IR1, IRAS 053286827 and 30 Dor-17 (Oliveira et al. 2009). There is no evidence for crystalline water ice in the MIPS-SED spectra of HS 270-IR1 or 30 Dor-17, but the broad hump around 60–66 m in IRAS 053286827 might possibly be due to a weak ice feature.
5.4.2 Molecules
The MIPS-SED spectral range covers numerous transitions in water (H2O), hydroxyl (OH) and carbon-monoxide (CO) molecules; see, for instance the line survey of the Orion KL region by Lerate et al. (2006). The CO lines are generally too weak, with stronger lines beyond 100 m (Justtanont et al. 2000). The M-giant R Cas shows very weak molecular lines, on top of a warm dust continuum (Truong-Bach et al. 1999). We would not expect to be able to detect and sufficiently resolve such line emission. However, blends of strong emission lines could, in principle, appear as features in the MIPS-SED spectrum of a few-m wide.
The strongest gas-phase H2O line often appears at 67 m (Harwit et al. 1998). It is usually seen in conjunction with other lines, e.g., at 79 and 90 m (Barlow et al. 1996). Strong OH lines are those at 79.15 and 84.51 m; the latter is generally the stronger of the two, but not in IRC +10 420 (Sylvester et al. 1997), or Cep E (Moro-Martín et al. 2001). Again, these lines are usually seen in conjunction with others, such as those at 65.2 and 71.2 m (e.g., Spinoglio et al. 2000). Neither these OH nor H2O lines are generally seen in the presence of [O iii] (Barlow et al. 1996; Maret et al. 2002; Lorenzetti et al. 1999); but the o-H2O 321–212 transition at 75.4 m (304 K excitation) is seen alongside [O iii], e.g., in bright-rimmed globule IC 1396 N (Saraceno et al. 1996) and in Cep E (Moro-Martín et al. 2001).
It might be possible that the sharp peak around 79 m in SNR N 49 and the PN or high-mass star IRAS 050476644 is due to a blend of the cluster of relatively strong transitions of H2O and OH emission lines (Lerate et al. 2006). Indeed, water vapour is produced in abundance in C-type shocks (Bergin, Neufeld & Melnick 1998), and is observed in YSO molecular outflows and SNRs in the Galaxy (Bjerkeli et al. 2009). If true, this would suggest that both water-dissociating and water-producing regions exist within the N 49–ISM interface. We find no evidence for molecular line emission in other MIPS-SED spectra.
5.4.3 Minerals
Of the spectra classified with the suffix “b”, the majority (13 out of 20) do not show the [O iii] line and the vast majority (16) have cold dust. However, this is entirely consistent with the distribution of objects over principal spectral types: there are 13 “b” sources among 35 objects without [O iii] — i.e. % — and there are 5 “b” sources among 13 objects with [O iii] — i.e. %; of 4 objects with [O iii] but not [O i], 2 are also a “b” source — i.e. %. Likewise, 15 out of 30 “C” types bear suffix “b” — i.e. % — but so do 2 out of 8 “W” types — i.e. %. There is thus not a clear link between the spectral features responsible for the unidentified bumps and the temperature and irradiation field. Rather than a gaseous or cryogenic origin, a mineralogical explanation seems more likely.
A weak emission feature is seen around m, e.g., in the warm (but neutral) envelopes of the LBV R 71 and RSG IRAS 052806910, and perhaps in IRAS 051376914. This might be due to crystalline forsterite (Mg2SiO4), which is seen both in post- and pre-main sequence objects, at –69.7 m (Bowey et al. 2002); these would remain unresolved in the MIPS-SED spectra. The similar mineral, crystalline ortho-enstatite (MgSiO3) has two peaks at either side of 70 m (Molster, Waters & Tielens 2002), which together would appear as a single feature in the MIPS-SED spectrum. Alternatively, chlorite (an aluminum-containing hydrous silicate, which has nothing to do with chlorine) peaks at m (Koike & Shibai 1990); it also has a strong peak at m, but that is so broad that it will be difficult to recognise in the MIPS-SED spectrum.
Some objects display a bump around m, e.g., the YSO N 159S. An unidentified blend of weak, narrow features was also observed around 74–75 m in the PN NGC 7027 (Liu et al. 1996), but the broad feature we observe is more alike that seen in the high-mass star-forming core G 05.89 (Hatchell & van der Tak 2003, who do not discuss it) — the latter also has an ice band around 66 m, and no oxygen emission lines.
Bumps around m are seen, prominently in N 89, N 51-YSO1, MSX-LMC 577, and UFO 1. These are all (candidate) YSOs. In the Milky Way, HH 53 shows a somewhat narrower feature (see Nisini et al. (1996), although it is not discussed). It sits on a cold continuum and only the [O i] is seen — i.e. no (other) lines of water or OH, for instance. It is thus unlikely to be due to o-H2O 423–312.
WOH G064, the source near WOH G457, and RP 85 seem to have a bump nearer to 80 m. This is also seen in the M0-type T Tauri star AA Tau and Herbig Ae star MWC 480 (Creech-Eakman et al. 2002).
These features remain unidentified, and it is not clear to what extent the carriers of the features around 75, 78 and 80 m are related. Interestingly, serpentine (a magnesium/iron-containing hydrous silicate) peaks at m (Koike & Shibai 1990) and could be a viable carrier for some of these observed spectral features.
Calcite (a carbonate) peaks at 90 m and starts at 80 m; it is seen in the PNe NGC 6302 (Kemper et al. 2002) and NGC 6537 (Chiavassa et al. 2005) and possibly protostar NGC 1333-IRAS 4 (Ceccarelli et al. 2002). Given that the feature is at the edge of the MIPS-SED spectral range it will be difficult to convincingly argue for its presence in, for instance, IRAS 053286827 or BSDL 2959.
5.5. Trends in the line strengths and continuum slope
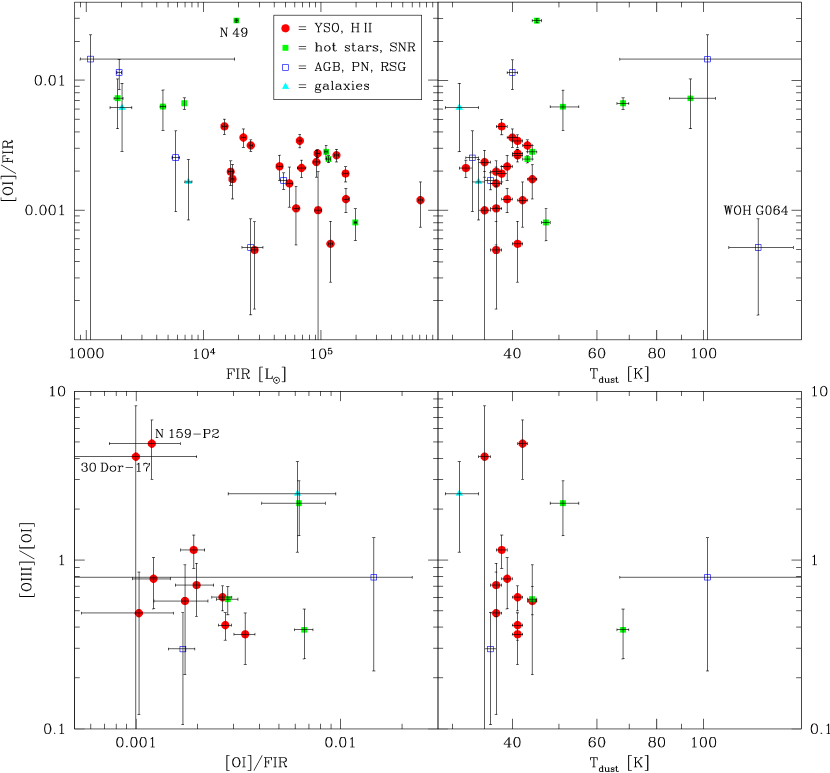
The MIPS-SED spectra can be described in terms of the oxygen line ratios and line-to-continuum ratios, and the IR flux density and spectral slope. We use these metrics to construct diagnostic diagrams, and investigate to what extent these can be used to isolate sources of a particular nature (Fig. 7). To make these diagrams as physically meaningful as possible, we make use of the dust temperature derived from the spectral slope (§5.3.1); while for the continuum we estimate the luminosity of the grey-body corresponding to that dust temperature:
| (4) |
where we assumed a distance kpc and calibrated the grey-body (Eq. 3) to the observed continuum interpolated across the oxygen lines at reference wavelengths of 63 and 88 m. Note that for a black-body, and the integral yields the familiar .
The far-IR luminosities derived in this way broadly agree with expectations; for instance, it is always less than the stellar luminosity in the evolved stars, but reaching significant fractions in the dusty RSG WOH G064 (%) and especially in the heavily-embedded RSG IRAS 052806910 (%). The brightest YSOs and compact H ii regions have far-IR luminosities exceeding L⊙, and these are likely powered by more than one source, or additional luminosity is generated via accretion.
The clearest, if unsurprising, result arising from these diagrams (Fig. 7) is that the objects associated with star formation (YSOs and compact H ii regions) separate quite well from the evolved stars by the former having colder dust, K. The few evolved stars that intrude into this cold regime are likely to have swept-up ISM; evolved stars with unperturbed circumstellar envelopes have dust of K. No YSOs or compact H ii regions are seen to exhibit warm dust, but the embedded massive hot stars — which are likely unevolved — occupy the regime of intermediate temperatures (44–100 K).
The [O iii]/[O i] ratio shows scatter over an order of magnitude, but no relation to the line-to-IR ratio or dust temperature (Fig. 7, bottom panels). This is in stark contrast to the clear correlation between the [O iii]/[O i] ratio and dust temperature seen in H ii regions in M 33 (Higdon et al. 2003). Two objects stand out, viz. N 159-P2 and 30 Dor-17, with their very strong [O iii] lines.
In PDRs, the [O i] line is the dominant cooling line for high density gas. The IR luminosity is a measure of the input energy into the molecular cloud surface (the dust acts as a calorimeter). The ratio of the [O i] line to IR luminosity is therefore an approximate measure of the efficiency of the photo-electric heating process which is thought to dominate the heating in these PDRs. This efficiency appears to be –0.3% for most of the YSOs and compact H ii regions (Fig. 7, top left panel, in which N 49 stands out for its shock-excited [O i] line).
6. Conclusions
We have presented the 52–93 m spectra of 48 compact far-IR sources in the Large Magellanic Cloud, obtained with MIPS-SED onboard the Spitzer Space Telescope as part of the SAGE-Spec Legacy Program. The spectra were classified using a simple classification scheme introduced here for the first time. We measured the intensity of the fine-structure lines of oxygen — [O i] at 63 m and [O iii] at 88 m — as well as the slope of the dust continuum emission spectrum which we translated into a dust temperature and far-IR luminosity. Some of the most interesting results arising from this analysis may be summarized as follows:
-
Young Stellar Objects (YSOs) separate rather well from more evolved objects by the steeper slope of the far-IR spectrum (i.e. lower dust temperature) and to some extent brighter fine-structure line emission. The contributions from [O i] and [O iii] show large variations among the sample, likely due to different excitation mechanisms at play.
-
The supernova remnant N 49 displays spectacular [O i] line emission, contributing 11% to the MIPS 70-m broad-band flux. We interpret this as arising from shocked gas at the interface of the expanding supernova ejecta and the local ISM. A possible detection of water vapour and/or OH emission is reported. From the dust continuum emission we estimate that 0.2 M⊙ of dust is associated, consistent with the expected amount of collected ISM.
-
Equally spectacular emission is seen in the [O iii] line in 30 Dor-17 and N 159-P2. These objects are associated with regions of active star formation and are probably YSOs harboring an (ultra-)compact H ii region.
-
The ratio of [O i] to IR (dust-processed) luminosity is used to estimate the efficiency of photo-electric heating in the interfaces between ionized gas and molecular clouds in YSOs and compact H ii regions; we find it is –0.3%.
-
We derive a low nitrogen content of H ii regions in the LMC, with a nitrogen-to-oxygen ratio of , possibly . This confirms the sparse evidence previously available from far-IR fine-structure lines.
-
The [O i] line is detected in the extreme red supergiant WOH G064. It is strong compared to the line detected in Galactic red supergiants, hinting at a larger dust-free cavity at lower metallicity. The implication may be a larger contribution of Alfvén waves to the wind driving at lower metallicity.
-
The circumstellar envelopes of the OH/IR stars in our sample lack cold dust. We estimate that dust production must have increased dramatically only a few thousands years ago, for the red supergiants and massive AGB stars alike. We further estimate that the fractional mass lost in this “superwind” phase is rather similar for these stars in spite of their different birth masses.
-
The Luminous Blue Variable R 71 also lacks cold dust, but the timescales are somewhat longer and the coolest dust may have formed a few yr ago; this would be consistent with an origin in the wind of a red supergiant progenitor to R 71, as suggested previously by others.
-
In the case of the carbon stars in our sample, which show far-IR excess emission over that expected from a circumstellar shell, and possibly also some planetary nebulae, we interpret the far-IR emission as arising from swept-up ISM and not due to dust produced by the stars themselves.
-
Broad (several m wide) emission features are seen in many sources, both young and evolved. It is likely that these arise from modes within solid state material, probably minerals, but the exact carriers could not be identified (maybe hydrous silicates).
-
Emission in the 60–70 m region due to crystalline water ice is detected tentatively in several YSOs.
References
- Alcock et al. (1996) Alcock, C., Allsman, R. A., Alves, D. R., et al. 1996, ApJ, 470, 583
- Alcock et al. (2001) Alcock, C., Allsman, R. A., Alves, D. R., et al. 2001, ApJ, 554, 298
- Allen & Glass (1976) Allen, D. A., Glass, I. S. 1976, ApJ, 210, 666
- Aller et al. (1987) Aller, L. H., Keyes, C. D., Maran, S. P., Gull, T. R., Michalitsianos, A. G., Stecher, Th. P. 1987, ApJ, 320, 159
- Ardeberg et al. (1972) Ardeberg, A., Brunet, J.-P., Maurice, E., Prévot, L. 1972, A&AS, 6, 249
- Banas et al. (1997) Banas, K. R., Hughes, J. P., Bronfman, L., Nyman, L.-Å. 1997, ApJ, 480, 607
- Barlow (1987) Barlow, M. J. 1987, MNRAS, 227, 161
- Barlow (1998) Barlow, M. J. 1998, Ap&SS, 255, 315
- Barlow et al. (1996) Barlow, M. J., Nguyen-Q-Rieu, Truong-Bach, et al. 1996, A&A, 315, L241
- Beasley et al. (1996) Beasley, A. J., Ellingsen, S. P., Claussen, M. J., Wilcots, E. 1996, ApJ, 459, 600
- Bergin, Neufeld & (1998) Bergin, E. A., Neufeld, D. A., Melnick, G. J. 1998, ApJ, 499, 777
- Bernard-Salas & Tielens (2005) Bernard-Salas, J., Tielens, A. G. G. M. 2005, A&A, 431, 523
- Bernard-Salas et al. (2006) Bernard-Salas, J., Peeters, E., Sloan, G. C., Cami, J., Guiles, S., Houck, J. R. 2006, ApJ, 652, L29
- Bernard-Salas et al. (2008) Bernard-Salas, J., Pottasch, S. R., Gutenkunst, S., Morris, P. W., Houck, J. R. 2008, ApJ, 672, 274
- Bernard-Salas et al. (2009) Bernard-Salas, J., Peeters, E., Sloan, G. C., Gutenkunst, S., Matsuura, M., Tielens, A. G. G. M., Zijlstra, A. A., Houck, J. R. 2009, ApJ, 699, 1541
- Bica et al. (1999) Bica, E. L. D., Schmitt, H. R., Dutra, C. M., Oliveira, H. L. 1999, AJ, 117, 238
- Bilikova et al. (2007) Bilikova, J., Williams, R. N. M., Chu, Y.-H., Gründl, R. A., Lundgren, B. F. 2007, AJ, 134, 2308
- Bjerkeli et al. (2009) Bjerkeli, P., Liseau, R., Olberg, M., et al. 2009, A&A, in press (arXiv:0908.4341)
- Blades et al. (1992) Blades, J. C., Barlow, M. J., Albrecht, R., et al. 1992, ApJ, 398, L41
- Blair et al. (2000) Blair, W. P., Sanskrit, R., Shelton, R., et al. 2000, ApJ, 538, L61
- Blum et al. (2006) Blum, R. D., Mould, J. R., Olsen, K. A., et al. 2006, AJ, 132, 2034
- Boffi & Stanghellini (1994) Boffi, F. R., Stanghellini, L. 1994, A&A, 284, 248
- Bojičić et al. (2007) Bojičić, I. S., Filipović, M. D., Parker, Q. A., Payne, J. L., Jones, P. A., Reid, W., Kawamura, A., Fukui, Y. 2007, MNRAS, 378, 1237
- Bolatto et al. (2000) Bolatto, A. D., Jackson, J. M., Israel, F. P., Zhang, X., Kim, S. 2000, ApJ, 545, 234
- Bolton & Butler (1975) Bolton, J. G., Butler, P. W. 1975, AuJPA, 34, 33
- Bowey et al. (2002) Bowey, J. E., Barlow, M. J., Molster, F. J., et al. 2002, MNRAS, 331, L1
- Braine & Hughes (1999) Braine, J., Hughes, D. H. 1999, A&A, 344, 779
- Breysacher, Azzopardi & Testor (1999) Breysacher, J., Azzopardi, M., Testor, G. 1999, A&AS, 137, 117
- Brogan et al. (2004) Brogan, C. L., Goss, W. M., Lazendić, J. S., Green, A. J. 2004, AJ, 128, 700
- Buchanan et al. (2006) Buchanan, C. L., Kastner, J. H., Forrest, W. J., et al. 2006, AJ, 132, 1890
- Burton et al. (1990) Burton, M. G., Hollenbach, D. J., Haas, M. R., Erickson, E. F. 1990, ApJ, 355, 197
- Caldwell & Kutner (1996) Caldwell, D. A., Kutner, M. L. 1996, ApJ, 472, 611
- Castro-Carrizo et al. (2001) Castro-Carrizo, A., Bujarrabal, V., Fong, D., Meixner, M., Tielens, A. G. G. M., Latter, W. B., Barlow, M. J. 2001, A&A, 367, 674
- Ceccarelli, Hollenbach & Tielens (1996) Ceccarelli, C., Hollenbach, D., Tielens, A. G. G. M. 1996, ApJ, 471, 400
- Ceccarelli et al. (1998) Ceccarelli, C., Caux, E., White, G. J., et al. 1998, A&A, 331, 372
- Ceccarelli et al. (2002) Ceccarelli, C., Caux, E., Tielens, A. G. G. M., Kemper, F., Waters, L. B. F. M., Phillips, T. 2002, A&A, 395, L29
- Chen et al. (2009) Chen, C.-H. R., Chu, Y.-H., Gründl, R. A., Gordon, K. D., Heitsch, F. 2009, ApJ, 695, 511
- Chiavassa et al. (2005) Chiavassa, A., Ceccarelli, C., Tielens, A. G. G. M., Caux, E., Maret, S. 2005, A&A, 432, 547
- Chu (1997) Chu, Y.-H. 1997, AJ, 113, 1815
- Chu & Kennicutt (1988) Chu, Y.-H., Kennicutt, R. C., Jr. 1988, AJ, 95, 1111
- Chu et al. (2005) Chu, Y.-H., Gründl, R. A., Chen, C.-H. R., et al. 2005, ApJ, 634, L189
- Cioni et al. (2000) Cioni, M.-R. L., van der Marel, R. P., Loup, C., Habing, H. J. 2000, A&A, 359, 601
- Clegg et al. (1996) Clegg, P. E., Ade, P. A., Armand, C., et al. 1996, A&A, 315, L38
- Colbert et al. (1999) Colbert, J. W., Malkan, M. A., Clegg, P. E., et al. 1999, AJ, 511, 721
- Comerón & Claes (1998) Comerón, F., Claes, P. 1998, A&A, 335, L13
- Cox et al. (1996) Cox, P., González-Alfonso, E., Barlow, M. J., et al. 1996, A&A, 315, L265
- Creech-Eakman et al. (2002) Creech-Eakman, M. J., Chiang, E. I., Joung, R. M. K., Blake, G. A., van Dischoeck, E. F. 2002, A&A, 385, 546
- Davies, Oudmaijer & Vink (2005) Davies, B., Oudmaijer, R. D., Vink, J. S. 2005, A&A, 439, 1107
- Davies, Elliott & Meaburn (1976) Davies, R. D., Elliott, K. H., Meaburn, J. 1976, MmRAS, 81, 89
- de Freitas Pacheco, Costa & Maciel (1993) de Freitas Pacheco, J. A., Costa, R. D. D., Maciel, W. J. 1993, A&A, 279, 567
- Deharveng & Caplan (1992) Deharveng, L., Caplan, J. 1992, A&A, 259, 480
- De Marco et al. (2002) De Marco, O., Clayton, G. C., Herwig, F., Pollacco, D. L., Clark, J. S., Kilkenny, D. 2002, AJ, 123, 3387
- Dennefeld (1986) Dennefeld, M. 1986, A&A, 157, 267
- Désert, Boulanger & Puget (1990) Désert, F.-X., Boulanger, F., Puget, J. L. 1990, A&A, 237, 215
- Dickel & Milne (1994) Dickel, J. R., Milne, D. K. 1994, PASAu, 11, 99
- Dickel & Milne (1998) Dickel, J. R., Milne, D. K. 1998, AJ, 115, 1057
- Dijkstra et al. (2006) Dijkstra, C., Dominik, C., Bouwman, J., de Koter, A. 2006, A&A, 449, 1101
- Dinerstein et al. (1995) Dinerstein, H. L., Haas, M. R., Erickson, E. F., Werner, M. W. 1995, in: Airborne Symposium on the Galactic Ecosystem: From Gas to Stars to Dust, ASPC, 73, 387
- Dopita (1976) Dopita, M. A. 1976, ApJ, 209, 395
- Dopita & Meatheringham (1991) Dopita, M. A., Meatheringham, S. J. 1991, ApJ, 377, 480
- Dopita, Ford & Webster (1985) Dopita, M. A., Ford, H. C., Webster, B. L. 1985, ApJ, 297, 593
- Dopita et al. (1988) Dopita, M. A., Meatheringham, S. J., Webster, B. L., Ford, H. C. 1988, ApJ, 327, 639
- Dufour (1991) Dufour, R. J. 1991, PASP, 103, 857
- Dufour & Killen (1977) Dufour, R., Killen, R. M. 1977, ApJ, 211, 68
- Egan, Van Dyk & Price (2001) Egan, M. P., Van Dyk, S. D., Price, S. D. 2001, AJ, 122, 1844
- Elias, Frogel & Schwering (1986) Elias, J. H., Frogel, J. A., Schwering, P. B. W. 1986, ApJ, 302, 675
- Elvis et al. (1992) Elvis, M., Plummer, D., Schachter, J., Fabbiano, G. 1992, ApJS, 80, 257
- Erickson et al. (1984) Erickson, E. F., Houck, J. R., Harwit, M. O., et al. 1984, in: Airborne Astronomy Symposium, p.313
- Evans et al. (2003) Evans, A., Stickel, M., van Loon, J. Th., Eyres, S. P. S., Hopwood, M. E. L., Penny, A. J. 2003, A&A, 408, L9
- Fazio et al. (2004) Fazio, G. G., Hora, J. L., Allen, L. E., et al. 2004, ApJS, 154, 10
- Feast, Thackeray & Wesselink (1960) Feast, M. W., Thackeray, A. D., Wesselink, A. J. 1960, MNRAS, 121, 337
- Feibelman & Aller (1987) Feibelman, W. A., Aller, L. H. 1987, ApJ, 319, 407
- Filipović, Jones & White (2003) Filipović, M. D., Jones, P. A., White, G. L. 2003, SerbAJ, 166, 31
- Filipović et al. (1995) Filipović, M. D., Haynes, R. F., White, G. L., Jones, P. A., Klein, U., Wielebinski, R. 1995, A&AS, 111, 311
- Filipović et al. (1996) Filipović, M. D.,White, G. L., Haynes, R. F., Jones, P. A., Meinert, D., Wielebinski, R., Klein, U. 1996, A&AS, 120, 77
- Filipović et al. (1998a) Filipović, M. D., Pietsch, W., Haynes, R. F., et al. 1998a, A&AS, 127, 119
- Filipović et al. (1998b) Filipović, M. D., Haynes, R. F., White, G. L., Jones, P. A. 1998b, A&AS, 130, 421
- Filipović et al. (1998c) Filipović, M. D., Jones, P. A., White, G. L., Haynes, R. F. 1998c, A&AS, 130, 441
- Filipović et al. (2009) Filipović, M. D., Cohen, M., Reid, W. A., et al. 2009, MNRAS, in press (arXiv:0906.4588)
- Fong et al. (2001) Fong, D., Meixner, M., Castro-Carrizo, A., Bujarrabal, V., Latter, W. B., Tielens, A. G. G. M., Kelly, D. M., Sutton, E. C. 2001, A&A, 367, 652
- Froebrich et al. (2003) Froebrich, D., Smith, M. D., Hodapp, K.-W., Eislöffel, J. 2003, MNRAS, 346, 163
- Galliano et al. (2003) Galliano, F., Madden, S. C., Jones, A. P., Wilson, C. D., Bernard, J.-P., Le Peintre, F. 2003, A&A, 407, 159
- García-Lario et al. (1999) García-Lario, P., Manchado, A., Ulla, A., Manteiga, M. 1999, ApJ, 513, 941
- Gatley, Hyland & Jones (1982) Gatley, I., Hyland, A. R., Jones, T. J. 1982, MNRAS, 200, 521
- Giannini et al. (2001) Giannini, T., Nisini, B., Lorenzetti, D. 2001, ApJ, 555, 40
- Giannini et al. (2000) Giannini, T., Nisini, B., Lorenzetti, D., et al. 2000, A&A, 358, 310
- Glass (1974) Glass, I. S. 1974, MNRAS, 168, 249
- Glass (1984) Glass, I. S. 1984, MNRAS, 209, 759
- Glass & Reid (1985) Glass, I. S., Reid, N. 1985, MNRAS, 214, 405
- Goldsmith, Bergin & Lis (1997) Goldsmith, P., Bergin, E. A., Lis, D. C. 1997, ApJ, 491, 615
- Gordon et al. (2005) Gordon, K. D., Rieke, G. H., Engelbracht, C. W., et al. 2005, PASP, 117, 503
- Graham et al. (1987) Graham, J. R., Evans, A., Albinson, J. S., Bode, M. F., Meikle, W. P. S. 1987, ApJ, 319, 126
- Green, Tuffs & Popescu (2004) Green, D. A., Tuffs, R. J., Popescu, C. C. 2004, MNRAS, 355, 1315
- Groenewegen (2004) Groenewegen, M. A. T. 2004, A&A, 425, 595
- Groenewegen et al. (2007) Groenewegen, M. A. T., Wood, P. R., Sloan, G. C., et al. 2007, MNRAS, 376, 313
- Groenewegen et al. (1995) Groenewegen, M. A. T., Smith, C. H., Wood, P. R., Omont, A., Fujiyoshi, T. 1995, ApJ, 449, L119
- Haas & Glassgold (1993) Haas, M. R., Glassgold, A. E. 1993, ApJ, 410, L111
- Haas, Glassgold & Tielens (1995) Haas, M. R., Glassgold, A. E., Tielens, A. G. G. M. 1995, in: Airborne Astronomy Symposium on the Galactic Ecosystem: From Gas to Stars to Dust, ASPC, 73, 397
- Haberl & Pietsch (1999) Haberl, F., Pietsch, W. 1999, A&AS, 139, 277
- Hartmann & MacGregor (1980) Hartmann, L., MacGregor, K. B. 1980, ApJ, 242, 260
- Harwit et al. (1998) Harwit, M., Neufeld, D. A., Melnick, G. J., Kaufman, M. J. 1998, ApJ, 497, L105
- Hatano et al. (2006) Hatano, H., Kadowaki, R., Nakajima, Y., et al. 2006, AJ, 132, 2653
- Hatchell & van der Tak (2003) Hatchell, J., van der Tak, F. F. S. 2003, A&A, 409, 589
- Heikkilä, Johansson & Olofsson (1998) Heikkilä, A., Johansson, L. E. B., Olofsson, H. 1998, A&A, 332, 493
- Henize (1956) Henize, K. G. 1956, ApJS, 2, 315
- Henning et al. (1998) Henning, T., Klein, R., Launhardt, R., Lemke, D., Pfau, W. 1998, A&A, 332, 1035
- Henry (1990) Henry, R. B. C. 1990, ApJ, 356, 229
- Herald & Bianchi (2004) Herald, J. E., Bianchi, L. 2004, ApJ, 611, 294
- Herpin & Cernicharo (2000) Herpin,F., Cernicharo, J. 2000, ApJ, 530, L129
- Heydari-Malayeri & Melnick (1992) Heydari-Malayeri, M., Melnick, J. 1992, A&A, 258, L13
- Heydari-Malayeri, Melnick & van Drom (1990) Heydari-Malayeri, M., Melnick, J., van Drom, E. 1990, A&A, 236, L21
- Higdon et al. (2003) Higdon, S. J. U., Higdon, J. L., van der Hulst, J. M., Stacey, G. J. 2003, ApJ, 592, 161
- Hill et al. (1995) Hill, R. S., Cheng, K.-P., Bohlin, R. C., O’Connell, R. W., Roberts, M. S., Smith, A. M., Stecher, T. P. 1995, ApJ, 446, 622
- Hodge (1988) Hodge, P. W. 1988, PASP, 100, 346
- Hodge & Sexton (1966) Hodge, P. W., Sexton, J. A. 1966, AJ, 71, 363
- Hodge & Wright (1967) Hodge, P. W., Wright, F. W. 1967, The Large Magellanic Cloud, Smithsonian Publ. 4699 (Washington: Smithsonian Press)
- Hollenbach & McKee (1989) Hollenbach, D., McKee, C. F. 1989, ApJ, 342, 306
- Hora et al. (2008) Hora, J. L., Cohen, M., Ellis, R. G., et al. 2008, AJ, 135, 726
- Hughes, Hayashi & Koyama (1998) Hughes, J. P., Hayashi, I., Koyama, K. 1998, ApJ, 505, 732
- Humphreys & Davidson (1994) Humphreys, R. M., Davidson, K. 1994, PASP, 106, 1025
- Hutchings (1966) Hutchings, J. B. 1966, MNRAS, 132, 433
- Hutchings (1980) Hutchings, J. B. 1980, ApJ, 235, 413
- Indebetouw, Johnson & Conti (2004) Indebetouw, R., Johnson, K. E., Conti, P. 2004, AJ, 128, 2206
- Indebetouw et al. (2008) Indebetouw, R., Whitney, B. A., Kawamura, A., et al. 2008, AJ, 136, 1442
- Israel & Koornneef (1991) Israel, F. P., Koornneef, J. 1991, A&A, 248, 404
- Israel et al. (1993) Israel, F. P., Johansson, L. E. B., Lequeux, J., et al. 1993, A&A, 276, 25
- Israel et al. (2003) Israel, F. P., de Graauw, T., Johansson, L. E. B., et al. 2003, A&A, 401, 99
- Jakob et al. (2007) Jakob, H., Kramer, C., Simon, R., Schneider, N., Ossenkopf, V., Bontemps, S., Graf, U. U., Stutzki, J. 2007, A&A, 461, 999
- Joblin et al. (2008) Joblin, C., Szczerba, R., Berné, O., Szyszka, C. 2008, A&A, 490, 189
- Johansson et al. (1998) Johansson, L. E. B., Greve, A., Booth, R. S., et al. 1998, A&A, 331, 857
- Jones et al. (1986) Jones, T. J., Hyland, A. R., Straw, S., Harvey, P. M., Wilking, B. A., Joy, M., Gatley, I., Thomas, J. A. 1986, MNRAS, 219, 603
- Jones et al. (2005) Jones, T. J., Woodward, C. E., Boyer, M. L., Gehrz, R. D., Polomski, E. 2005, ApJ, 620, 731
- Justtanont et al. (2000) Justtanont, K., Barlow, M. J., Tielens, A. G. G. M., et al. 2000, A&A, 360, 1117
- Kastner et al. (2006) Kastner, J. H., Buchanan, C. L., Sargent, B., Forrest, W. J. 2006, ApJ, 638, L29
- Kastner et al. (2008) Kastner, J. H., Thorndike, S. L., Romanczyk, P. A., Buchanan, C. L., Hrivnak, B. J., Sahai, R., Egan, M. 2008, AJ, 136, 1221
- Keller & Wood (2006) Keller, S. C., Wood, P. R. 2006, ApJ, 642, 834
- Kemper et al. (2002) Kemper, F., Jäger, C., Waters, L. B. F. M., Henning, Th., Molster, F. J., Barlow, M. J., Lim, T., de Koter, A. 2002, Nature, 415, 295
- Kemper et al. (2009) Kemper, F., Gordon, K. D., Shiao, B., et al. 2009, AJ, submitted
- Kessler et al. (1996) Kessler, M. F., Steinz, J. A., Anderegg, M. E., et al. 1996, A&A, 315, L27
- Klein et al. (1989) Klein, U., Wielebinski, R., Haynes, R. F., Malin, D. F. 1989, A&A, 211, 280
- Klose et al. (2004) Klose, S., Henden, A. A., Geppert, U., et al. 2004, ApJ, 609, L13
- Koike & Shibai (1990) Koike, C., Shibai, H. 1990, MNRAS, 246, 332
- Koornneef & Code (1981) Koornneef, J., Code, A. D. 1981, ApJ, 247, 860
- Kraus, Borges Fernandes & de Araújo (2007) Kraus, M., Borges Fernandes, M., de Araújo, F. X. 2007, A&A, 463, 627
- Kurochkin (1992) Kurochkin, N. E. 1992, Sov. Astron. Lett., 18, 410
- Kutner et al. (1997) Kutner, M. L., Rubio, M., Booth, R. S, et al. 1997, A&AS, 122, 255
- Kwok, Volk & Bidelman (1997) Kwok, S., Volk, K., Bidelman, W. P. 1997, ApJS, 112, 557
- Lamers et al. (1998a) Lamers, H. J. G. L. M., Bastiaanse, M. V., Aerts, C., Spoon, H. W. W. 1998a, A&A, 335, 605
- Lamers et al. (1998b) Lamers, H. J. G. L. M., Zickgraf, F.-J., de Winter, D., Houziaux, L., Zorec, J. 1998b, A&A, 340, 117
- Larsson et al. (2000) Larsson, B., Liseau, R., Men’shchikov, A. B., et al. 2000, A&A, 363, 253
- Le Bourlot et al. (2002) Le Bourlot, J., Pineau des Forêts, G., Flower, D. R., Cabrit, S. 2002, MNRAS, 332, 985
- Lefloch & Cernicharo (2000) Lefloch, B., Cernicharo, J. 2000, ApJ, 545, 340
- Leisenring, Kemper & Sloan (2008) Leisenring, J. M., Kemper, F., Sloan, G. C. 2008, ApJ, 681, 1557
- Leisy & Dennefeld (1996) Leisy, P., Dennefeld, M. 1996, A&AS, 116, 95
- Leisy & Dennefeld (2006) Leisy, P., Dennefeld, M. 2006, A&A, 456, 451
- Leisy et al. (1997) Leisy, P., Dennefeld, M., Alard, C., Guibert, J. 1997, A&AS, 121, 407
- Lennon et al. (1993) Lennon, D. J., Wobig, D., Kudritzki, R.-P., Stahl, O. 1993, Space Science Reviews, 66, 207
- Lerate et al. (2006) Lerate, M. R., Barlow, M. J., Swinyard, B. M., et al. 2006, MNRAS, 370, 597
- Lester et al. (1987) Lester, D. F., Dinerstein, H. L., Werner, M. W., Watson, D. M., Genzel, R., Storey, J. W. V. 1987, ApJ, 320, 573
- Levesque et al. (2009) Levesque, E., Massey, P., Plez, B., Olsen, K. A. G. 2009, AJ, 137, 4744
- Lindsay & Mullan (1963) Lindsay, E. M., Mullan, D. J. 1963, IrAJ, 6,51
- Liu et al. (1996) Liu, X.-W., Barlow, M. J., Nguyen-Q-Rieu, et al. 1996, A&A, 315, L257
- Liu et al. (2001) Liu, X.-W., Barlow, M. J., Cohen, M., et al. 2001, MNRAS, 323, 343
- Long, Helfand & Grabelsky (1981) Long, K. S., Helfand, D. J., Grabelsky, D. A. 1981, ApJ, 248, 925
- Lord et al. (1996) Lord, S. D., Malhotra, S., Lim, T., et al. 1996, A&A, 315, L117
- Lorenzetti et al. (1999) Lorenzetti, D., Tommasi, E., Giannini, T., et al. 1999, A&A, 346, 604
- Lorenzetti et al. (2002) Lorenzetti, D., Giannini, T., Nisini, B., Benedettini, M., Elia, D., Campeggio, L., Strafella, F. 2002, A&A, 395, 637
- Loup et al. (1997) Loup, C., Zijlstra, A. A., Waters, L. B. F. M., Groenewegen, M. A. T. 1997, A&AS, 125, 419
- Lu et al. (2008) Lu, N., Smith, P. S., Engelbracht, C. W. 2008, PASP, 120, 328
- Lucke & Hodge (1970) Lucke, P. B., Hodge, P. W. 1970, AJ, 75, 171
- Lundqvist et al. (1999) Lundqvist, P., Sollerman, J., Kozma, C. Larsson, B., Spyromilio, J., Crotts, A. P. S., Danziger, J., Kunze, D. 1999, A&A, 347, 500
- Maeder, Grebel & Mermilliod (1999) Maeder, A., Grebel, E. K., Mermilliod, J.-C. 1999, A&A, 346, 459
- Magalhães (1992) Magalhães, A. M. 1992, ApJ, 398, 286
- Malfait et al. (1999) Malfait, K., Waelkens, C., Bouwman, J., de Koter, A., Waters, L. B. F. M. 1999, A&A, 345, 181
- Manfroid et al. (1991) Manfroid, J., Sterken, C., Bruch, A., et al. 1991, A&AS, 87, 481
- Maret et al. (2002) Maret, S., Ceccarelli, C., Caux, E., Tielens, A. G. G. M., Castets, A. 2002, A&A, 395, 573
- Marsden et al. (1996) Marsden, D., Rothschild, R. E., Lingenfelter, R. E., Pütter, R. C. 1996, ApJ, 470, 513
- Marshall et al. (2004) Marshall, J. R., van Loon, J. Th., Matsuura, M., Wood, P. R., Zijlstra, A. A., Whitelock, P. A. 2004, MNRAS, 355, 1348
- Marx, Dickey & Mebold (1997) Marx, M., Dickey, J. M., Mebold, U. 1997, A&AS, 126, 325
- Mathewson & Clarke (1973) Mathewson, D. S., Clarke, J. N. 1973, ApJ, 180, 725
- Mathewson & Healey (1964) Mathewson, D. S., Healey, J. R. 1964, IAUS, 20, 283
- Mathewson et al. (1983) Mathewson, D. S., Ford, V. L., Dopita, M. A., Tuohy, I. R., Long, K. S., Helfand, D. J. 1983, ApJS, 51, 345
- Mathewson et al. (1985) Mathewson, D. S., Ford, V. L., Tuohy, I. R., Mills, B. Y., Turtle, A. J., Helfand, D. J. 1985, ApJS, 58, 197
- Matsuura et al. (2006) Matsuura, M., Wood, P. R., Sloan, G. C., et al. 2006, MNRAS, 371, 415
- McGee, Brooks & Batchelor (1972) McGee, R. X., Brooks, J. W., Batchelor, R. A. 1972, AuJPh, 25, 581
- McGee, Newton & Butler (1978) McGee, R. X., Newton, L. M., Butler, P. W. 1978, MNRAS, 183, 799
- McGregor, Hyland & Hillier (1988) McGregor, P. J., Hyland, A. R., Hillier, D. J. 1988, ApJ, 334, 639
- Meatheringham & Dopita (1991) Meatheringham, S. J., Dopita, M. A. 1991, ApJS, 76, 1085
- Meixner et al. (2006) Meixner, M., Gordon, K. D., Indebetouw, R., et al. 2006, AJ, 132, 2268
- Mennella et al. (1998) Mennella, V., Brucato, J. R., Colangeli, L., Palumbo, P., Rotundi, A., Bussoletti, E. 1998, ApJ, 496, 1058
- Merrill & Burwell (1933) Merrill, P. W., Burwell, C. G. 1933, ApJ, 78, 87
- Meynadier & Heydari-Malayeri (2007) Meynadier, F., Heydari-Malayeri, M. 2007, A&A, 461, 565
- Milne, Caswell & Haynes (1980) Milne, D. K., Caswell, J. L., Haynes, R. F. 1980, MNRAS, 191, 469
- Minamidani et al. (2008) Minamidani, T., Mizuno, N., Mizuno, Y., et al. 2008, ApJS, 175, 485
- Mizuno et al. (2001) Mizuno, N., Yamaguchi, R., Mizuno, A., et al. 2001, PASJ, 53, 971
- Mizutani, Onaka & Shibai (2002) Mizutani, M., Onaka, T., Shibai, H. 2002, A&A, 382, 610
- Moffat (1991) Moffat, A. F. J. 1991, A&A, 244, L9
- Molster, Waters & Tielens (2002) Molster, F. J., Waters, L. B. F. M., Tielens, A. G. G. M. 2002, A&A, 382, 222
- Molster et al. (1999) Molster, F. J., Waters, L. B. F. M., Trams, N. R., et al. 1999, A&A, 350, 163
- Monk, Barlow & Clegg (1988) Monk, D. J., Barlow, M. J., Clegg, R. E. S. 1988, MNRAS, 234, 583
- Morel (1984) Morel, M. 1984, BICDS, 27, 57
- Morgan (1984) Morgan, D. H. 1984, MNRAS, 208, 633
- Morgan & Parker (1998) Morgan, D. H., Parker, Q. A. 1998, MNRAS, 296, 921
- Moro-Martín et al. (2001) Moro-Martín, A., Noriega-Crespo, A., Molinari, S., Testi, L., Cernicharo, J., Sargent, A. 2001, ApJ, 555, 146
- Munari et al. (2009) Munari, U., Siviero, A., Bienaymé, O., et al. 2009, A&A, 503, 511
- Muratorio & Friedjung (1988) Muratorio, G., Friedjung, M. 1988, A&A, 190, 103
- Nakajima et al. (2005) Nakajima, Y., Kato, D., Nagata, T., et al. 2005, AJ, 129, 776
- Negishi et al. (2001) Negishi, T., Onaka, T., Chan, K.-W., Röllig, T. L. 2001, A&A, 375, 566
- Neugebauer et al. (1984) Neugebauer, G., Habing, H. J., van Duinen, R. 1984, ApJ, 278, L1
- Nisini et al. (1996) Nisini, B., Lorenzetti, D., Cohen, M., et al. 1996, A&A, 315, L321
- Nisini et al. (1999a) Nisini, B., Benedettini, M., Giannini, T., et al. 1999a, A&A, 343, 266
- Nisini et al. (1999b) Nisini, B., Benedettini, M., Giannini, T., et al. 1999b, A&A, 350, 529
- Oey (1996) Oey, M. S. 1996, ApJS, 104, 71
- Oey & Smedley (1998) Oey, M. S., Smedley, S. A. 1998, AJ, 116, 1263
- Ohnaka et al. (2008) Ohnaka, K., Driebe, T., Hofmann, K.-H., Weigelt, G., Wittkowski, M. 2008, A&A, 484, 371
- Oliva, Moorwood & Danziger (1989) Oliva, E., Moorwood, A. F. M., Danziger, I. J. 1989, A&A, 214, 307
- Oliveira (2009) Oliveira, J. M. 2009, in: The Magellanic System: Stars, Gas, and Galaxies, eds. J. Th. van Loon & J. M. Oliveira, IAUS, 256, 191
- Oliveira et al. (2006) Oliveira, J. M., van Loon, J. Th., Stanimirović, S., Zijlstra, A. A. 2006, MNRAS, 372, 1509
- Oliveira et al. (2009) Oliveira, J. M., van Loon, J. Th., Chen, H.-L. R., et al. 2009, ApJ, submitted
- Omont et al. (1990) Omont, A., Forveille, T., Moseley, S. H., Glaccum, W. J., Harvey, P. M., Likkel, L., Loewenstein, R. F., Lisse, C. M. 1990, ApJ, 355, L27
- Park et al. (2003) Park, S., Burrows, D. N., Garmire, G. P., Nousek, J. A., Hughes, J. P., Williams, R. M. 2003, ApJ, 586, 210
- Parker et al. (1998) Parker, J. W., Hill, J. K., Cornett, R. H., et al. 1998, AJ, 116, 180
- Payne, White & Filipović (2008) Payne, J. L., White, G. L., Filipović, M. D. 2008, MNRAS, 383, 1175
- Peeters et al. (2002) Peeters, E., Martín-Hernández, N. L., Damour, F., et al. 2002, A&A, 381, 571
- Peña et al. (1994) Peña, M., Olgín, L., Ruiz, M. T., Torres-Peimbert, S. 1994, Rev. Mex. A&A, 28, 27
- Pickering & Fleming (1897) Pickering, E. C., Fleming, W. P. 1897, ApJ, 6, 459
- Pietrzyński et al. (1999) Pietrzyński, G., Udalski, A., Kubiak, M., Szymański, M., Woźniak, P., ebruń, K. 1999, AcA, 49, 521
- Porter (2003) Porter, J. M. 2003, A&A, 398, 631
- Rakowski, Raymond & Szentgyorgyi (2007) Rakowski, C. E., Raymond, J. C., Szentgyorgyi, A. H. 2007, ApJ, 655, 885
- Reid (1991) Reid, N. 1991, ApJ, 382, 143
- Reid & Parker (2006) Reid, W. A., Parker, Q. A. 2006, MNRAS, 373, 521
- Reid, Glass & Catchpole (1988) Reid, N., Glass, I. S., Catchpole, R. M. 1988, MNRAS, 232, 53
- Reid, Tinney & Mould (1990) Reid, N., Tinney, C., Mould, J. 1990, ApJ, 348, 98
- Renzini & Voli (1981) Renzini, A., Voli, M. 1981, A&A, 94, 175
- Rho et al. (2001) Rho, J., Jarrett, T. H., Cutri, R. M., Reach, W. T. 2001, ApJ, 547, 885
- Rieke et al. (2004) Rieke, G. H., Young, E. T., Engelbracht, C. W., et al. 2004, ApJS, 154, 25
- Roche, Aitken & Smith (1987) Roche, P. F., Aitken, D. K., Smith, C. H. 1987, MNRAS, 228, 269
- Roche, Aitken & Smith (1993) Roche, P. F., Aitken, D. K., Smith, C. H. 1993, MNRAS, 262, 301
- Roelfsema et al. (1998) Roelfsema, P. R., Cox, P., Kessler, M. F., Baluteau, J.-P. 1998, in: Star Formation with the Infrared Space Observatory, eds. J. Yun & R. Liseau, ASPC, 132, 76
- Rosado et al. (1996) Rosado, M., Laval, A., Le Coarer, E., et al. 1996, A&A, 308, 588
- Rothschild, Kulkarni & Lingenfelter (1994) Rothschild, R. E., Kulkarni, S. R., Lingenfelter, R. E. 1994, Nature, 368, 432
- Rubin et al. (1988) Rubin, R. H., Simpson, J. P., Erickson, E. F., Haas, M. R. 1988, ApJ, 327, 377
- Rubin et al. (1994) Rubin, R. H., Simpson, J. P., Lord, S. D., Colgan, S. W. J., Erickson, E. F., Haas, M. R. 1994, ApJ, 420, 772
- Rubin et al. (1997) Rubin, R. H., Colgan, S. W. J., Haas, M. R., Lord, S. D., Simpson, J. P. 1997, ApJ, 479, 332
- Rudolph et al. (1997) Rudolph, A. L., Simpson, J. P., Haas, M. R., Erickson, E. F., Fich, M. 1997, ApJ, 489, 94
- Rudolph et al. (2006) Rudolph, A. L., Fich, M., Bell, G. R., Norsen, T., Simpson, J. P., Haas, M. R., Erickson, E. F. 2006, ApJS, 162, 346
- Russell & Dopita (1990) Russell, S. C., Dopita, M. A. 1990, ApJS, 74, 93
- Sanduleak & Philip (1977) Sanduleak, K. N., Philip, A. G. D. 1977, PASP, 89, 792
- Sanduleak, MacConnell & Philip (1978) Sanduleak, K. N., MacConnell, D. J., Philip, A. G. D. 1978, PASP, 90, 621
- Sankrit, Blair & Raymond (2004) Sankrit, R., Blair, W. P., Raymond, J. C. 2004, AJ, 128, 1615
- Saraceno et al. (1996) Saraceno, P., Ceccarelli, C., Clegg, P., et al. 1996, A&A, 315, L293
- Sasaki, Haberl & Pietsch (2000) Sasaki, M., Haberl, F., Pietsch, W. 2000, A&AS, 143, 391
- Schild & Testor (1992) Schild, H., Testor, G. 1992, A&AS, 92, 729
- Schmidt-Kaler et al. (1999) Schmidt-Kaler, T., Gochermann, J., Oestreicher, M. O., et al. 1999, MNRAS, 306, 279
- Schneider et al. (2003) Schneider, N., Simon, R., Kramer, C., Kraemer, K., Stutzki, J., Mookerjea, B. 2003, A&A, 406, 915
- Seale et al. (2009) Seale, J. P., Looney, L. W., Chu, Y.-H., et al. 2009, ApJ, 699, 150
- Shaw et al. (2001) Shaw, R. A., Stanghellini, L., Mutchler, M., Balick, B., Blades, J. C. 2001, ApJ, 548, 727
- Shaw et al. (2006) Shaw, R. A., Stanghellini, L., Villaver, E., Mutchler, M. 2006, ApJS, 167, 201
- Shore & Sanduleak (1984) Shore, S. N., Sanduleak, N. 1984, ApJS, 55, 1
- Shull et al. (1985) Shull, P., Jr., Dyson, J. E., Kahn, F. D., West, K. A. 1985, MNRAS, 212, 799
- Simpson et al. (1995) Simpson, J. P., Colgan, S. W. J., Rubin, R. H., Erickson, E. F., Haas, M. R. 1995, ApJ, 444, 721
- Sloan et al. (2008) Sloan, G. C., Kraemer, K. E., Wood, P. R., Zijlstra, A. A., Bernard-Salas, J., Devost, D., Houck, J. R. 2008, ApJ, 686, 1056
- Smith (1957) Smith, H. J. 1957, PASP, 69, 137
- Smith & Conti (2008) Smith, N., Conti, P. S. 2008, ApJ, 679, 1467
- Smith, Beall & Swain (1990) Smith, H. A., Beall, J. H., Swain, M. R. 1990, AJ, 99, 273
- Smith, Vink & de Koter (2004) Smith, N., Vink, J. S., de Koter, A. 2004, ApJ, 615, 475
- Sopka et al. (1985) Sopka, R. J., Hildebrand, R., Jaffe, D. T., Gatley, I., Roellig, T., Werner, M., Jura, M., Zuckerman, B. 1985, ApJ, 294, 242
- Sorai et al. (2001) Sorai, K., Hasegawa, T., Booth, R. S., et al. 2001, ApJ, 551, 794
- Spinoglio et al. (2000) Spinoglio, L., Giannini, T., Nisini, B., et al. 2000, A&A, 353, 1055
- Spoon et al. (1994) Spoon, H. W. W., de Koter, A., Sterken, C., Lamers, H. J. G. L. M., Stahl, O. 1994, A&AS, 106, 141
- Stahl & Wolf (1986) Stahl, O., Wolf, B. 1986, A&A, 158, 371
- Stahl et al. (1983) Stahl, O., Wolf, B., Zickgraf, F.-J., Bastian, U., de Groot, M. J. H., Leitherer, C. 1983, A&A, 120, 287
- Stahl et al. (1985) Stahl, O., Wolf, B., Leitherer, C., de Groot, M. 1985, A&AS, 61, 237
- Stanghellini, Shaw & Gilmore (2005) Stanghellini, L., Shaw, R. A., Gilmore, D. 2005, ApJ, 622, 294
- Stanghellini et al. (1999) Stanghellini, L., Blades, J. C., Osmer, S. J., Barlow, M. J., Liu, X.-W. 1999, ApJ, 510, 687
- Stanghellini et al. (2002) Stanghellini, L., Shaw, R. A., Mutchler, M., Palen, S., Balick, B., Blades, J. C. 2002, ApJ, 575, 178
- Stanghellini et al. (2007) Stanghellini, L., García-Lario, P., Anibal García-Hernández, D., et al. 2007, ApJ, 671, 1669
- Stasińska, Richer & McCall (1998) Stasińska, G., Richer, M. G., McCall, M. L. 1998, A&A, 336, 667
- Sterken et al. (1993) Sterken, C., Manfroid, J., Anton, K., et al. 1993, A&AS, 102, 79
- Suh & Jones (1997) Suh, K.-W., Jones, T. J. 1997, ApJ, 479, 918
- Sylvester et al. (1997) Sylvester, R. J., Barlow, M. J., Nguyen-Q-Rieu, et al. 1997, MNRAS, 291, L42
- Sylvester et al. (1999) Sylvester, R. J., Kemper, F., Barlow, M. J., de Jong, T., Waters, L. B. F. M., Tielens, A. G. G. M., Omont, A. 1999, A&A, 352, 587
- Testor et al. (2006) Testor, G., Lemaire, J. L., Field, D., Diana, S. 2006, A&A, 453, 517
- Thackeray (1974) Thackeray, A. D. 1974, MNRAS, 168, 221
- Tielens & Hollenbach (1985) Tielens, A. G. G. M., Hollenbach, D. 1985, ApJ, 291, 722
- Trams et al. (1999) Trams, N. R., van Loon, J. Th., Waters, L. B. F. M., et al. 1999, A&A, 346, 843
- Truong-Bach et al. (1999) Truong-Bach, Sylvester, R. J., Barlow, M. J., et al. 1999, A&A, 345, 925
- Tuohy (1980) Tuohy, I. R. 1980, PASAu, 4, 4
- Unger et al. (2000) Unger, S. J., Clegg, P. E., Stacey, G. J., et al. 2000, A&A, 355, 885
- Vancura et al. (1992a) Vancura, O., Blair, W.P., Long, K. S., et al. 1992a, ApJ, 401, 220
- Vancura et al. (1992b) Vancura, O., Blair, W.P., Long, K. S., Raymond, J. C. 1992b, ApJ, 394, 158
- van den Ancker, Tielens & Wesselius (2000) van den Ancker, M. E., Tielens, A. G. G. M., Wesselius, P. R. 2000, A&A, 358, 1035
- van den Ancker, Wesselius & Tielens (2000) van den Ancker, Wesselius, P. R., Tielens, A. G. G. M. 2000, A&A, 355, 194
- van den Ancker et al. (1999) van den Ancker, M. E., Wesselius, P. R., Tielens, A. G. G. M., van Dishoeck, E. F., Spinoglio, L. 1999, A&A, 348, 877
- Vandenbussche et al. (2002) Vandenbussche, B., Beintema, D., de Graauw, T., et al. 2002, A&A, 390, 1033
- van Genderen (1970) van Genderen, A. M. 1970, A&A, 7, 49
- van Genderen (1979a) van Genderen, A. M. 1979a, A&AS, 38, 151
- van Genderen (1979b) van Genderen, A. M. 1979b, A&AS, 38, 381
- van Genderen (1982) van Genderen, A. M. 1982, A&A, 112, 61
- van Genderen (1989) van Genderen, A. M. 1989, A&A, 208, 135
- van Genderen (1998) van Genderen, A. M. 1998, Journal of Astronomical Data, 4, 10
- van Genderen (2001) van Genderen, A. M. 2001, A&A, 366, 508
- van Genderen & Sterken (2002) van Genderen, A. M., Sterken, C. 2002, A&A, 386, 926
- van Genderen, de Groot & Sterken (1997) van Genderen, A. M., de Groot, M., Sterken, C. 1997, A&AS, 124, 517
- van Genderen, Groot & Thé (1983) van Genderen, A. M., Groot, M., Thé, P. S. 1983, A&A, 117, 53
- van Genderen, Jones & Sterken (2006) van Genderen, A. M., Jones, A. F., Sterken, C. 2006, The Journal of Astronomical Data, 12, 4
- van Genderen et al. (1985) van Genderen, A. M., Steemers, W. J. G., Feldbrugge, P. T. M., Groot, M., Damen, E., van den Boogaart, A. K. 1985, A&A, 153, 163
- van Genderen et al. (1988) van Genderen, A. M., Thé, p. S., Augusteijn, T., et al. 1988, A&AS, 74, 453
- van Loon (2000) van Loon, J. Th. 2000, A&A, 354, 125
- van Loon, Zijlstra & Groenewegen (1999) van Loon, J. Th., Zijlstra, A. A., Groenewegen, M. A. T. 1999a, A&A, 346, 805
- van Loon, Marshall & Zijlstra (2005) van Loon, J. Th., Marshall, J. R., Zijlstra, A. A. 2005b, A&A, 442, 597
- van Loon et al. (1996) van Loon, J. Th., Zijlstra, A. A., Bujarrabal, V., Nyman, L.-Å. 1996, A&A, 306, L29
- van Loon et al. (1998a) van Loon, J. Th., Zijlstra, A. A., Whitelock, P. A., et al. 1998a, A&A, 329, 169
- van Loon et al. (1998b) van Loon, J. Th., te lintel Hekkert, P., Bujarrabal, V., Zijlstra, A. A., Nyman, L.-Å. 1998b, A&A, 337, 141
- van Loon et al. (1999b) van Loon, J. Th., Groenewegen, M. A. T., de Koter, A., et al. 1999b, A&A, 351, 559
- van Loon et al. (2001a) van Loon, J. Th., Zijlstra, A. A., Kaper, L., Gilmore, G. F., Loup, C., Blommaert, J. A. D. L. 2001a, A&A, 368, 239
- van Loon et al. (2001b) van Loon, J. Th., Zijlstra, A. A., Bujarrabal, V., Nyman, L.-Å. 2001b, A&A, 368, 950
- van Loon et al. (2005a) van Loon, J. Th., Cioni, M.-R. L., Zijlstra, A. A., Loup, C. 2005a, A&A, 438, 273
- van Loon et al. (2005c) van Loon, J. Th., Oliveira, J. M., Wood, P. R., et al. 2005c, MNRAS, 364, L71
- van Loon et al. (2006) van Loon, J. Th., Marshall, J. R., Cohen, M., Matsuura, M., Wood, P. R., Yamamura, I., Zijlstra, A. A. 2006, A&A, 447, 971
- van Loon et al. (2008) van Loon, J. Th., Cohen, M., Oliveira, J., et al. 2008, A&A, 487, 1055
- van Loon et al. (2009) van Loon, J. Th., Oliveira, J. M., Gordon, K. D., Sloan, G. C., Engelbracht, C. W. 2009, AJ, to be submitted very soon (Paper II)
- van Paradijs et al. (1996) van Paradijs, J., Waters, L. B. F. M., Groot, P. J., et al. 1996, A&A, 314, 146
- Vassiliadis et al. (1992) Vassiliadis, E., Dopita, M. A., Morgan, D. H., Bell, J. F. 1992, ApJS, 83, 87
- Vassiliadis et al. (1998a) Vassiliadis, E., Dopita, M. A., Bohlin, R. C., et al. 1998a, ApJS, 114, 237
- Vassiliadis et al. (1998b) Vassiliadis, E., Dopita, M. A., Meatheringham, S. J., et al. 1998b, ApJ, 503, 253
- Villaver, Stanghellini & Shaw (2003) Villaver, E., Stanghellini, L., Shaw, R. A. 2003, ApJ, 597, 298
- Villaver, Stanghellini & Shaw (2007) Villaver, E., Stanghellini, L., Shaw, R. A. 2007, ApJ, 656, 831
- Voges et al. (2008) Voges, E. S., Oey, M. S., Walterbos, R. A., Wilkinson, T. M. 2008, AJ, 135, 1291
- Voors et al. (1999) Voors, R. H. M., Waters, L. B. F. M., Morris, P. W., Trams, N. R., de Koter, A., Bouwman, J. 1999, A&A, 341, L67
- Wang & Helfand (1991) Wang, Q., Helfand, D. J. 1991, ApJ, 373, 497
- Wang et al. (1991) Wang, Q., Hamilton, T., Helfand, D. J., Wu, X. 1991, ApJ, 374, 475
- Webster (1976) Webster, B. L. 1976, MNRAS, 174, 513
- Weis (2003) Weis, K. 2003, A&A, 408, 205
- Werner et al. (2004) Werner, M. W., Röllig, T. L., Low, F. J., et al. 2004, ApJS, 154, 1
- Westerlund & Mathewson (1966) Westerlund, B. E., Mathewson, D. S. 1966, MNRAS, 131, 371
- Westerlund & Smith (1964) Westerlund, B. E., Smith, L. F. 1964, MNRAS, 127, 449
- Westerlund, Olander & Hedin (1981) Westerlund, B. E., Olander, N., Hedin, B. 1981, A&AS, 43, 267
- Whitelock et al. (2003) Whitelock, P. A., Feast, M. W., van Loon, J. Th., Zijlstra, A. A. 2003, MNRAS, 342, 86
- Whitney et al. (2008) Whitney, B. A., Sewilo, M., Indebetouw, R., et al. 2008, AJ, 136, 18
- Williams, Chu & Gründl (2006) Williams, R. M., Chu, Y.-H., Gründl, R. 2006, AJ, 132, 1877
- Williams et al. (1999) Williams, R. M., Chu, Y.-H., Dickel, J. R., Petre, R., Smith, R. C., Tavarez, M. 1999, ApJS, 123, 467
- Wolf (1975) Wolf, B. 1975, A&A, 41, 471
- Wolf & Zickgraf (1986) Wolf, B., Zickgraf, F.-J. 1986, A&A, 164, 435
- Wood (1998) Wood, P. R. 1998, A&A, 338, 592
- Wood, Bessell & Whiteoak (1986) Wood, P. R., Bessell, M. S., Whiteoak, J. B. 1986, ApJ, 306, L81
- Wood et al. (1987) Wood, P. R., Meatheringham, S. J., Dopita, M. A., Morgan, D. H. 1987, ApJ, 320, 178
- Wood et al. (1992) Wood, P. R., Whiteoak, J. B., Hughes, S. M. G., Bessell, M. S., Gardner, F. F., Hyland, A. R. 1992, ApJ, 397, 552
- Wright et al. (1994) Wright, A. E., Griffith, M. R., Burke, B. F., Ekers, R. D. 1994, ApJS, 91, 111
- Yamaguchi et al. (2001) Yamaguchi, R., Mizuno, N., Mizuno, A., et al. 2001, PASJ, 53, 985
- Zickgraf et al. (1985) Zickgraf, F.-J., Wolf, B., Stahl, O., Leitherer, C., Klare, G. 1985, A&A, 143, 421
- Zickgraf et al. (1986) Zickgraf, F.-J., Wolf, B., Stahl, O., Leitherer, C., Appenzeller, I. 1986, A&A, 163, 119
- Zickgraf et al. (1989) Zickgraf, F.-J., Wolf, B., Stahl, O., Humphreys, R. M. 1989, A&A, 220, 206
- Zijlstra et al. (1994) Zijlstra, A. A., van Hoof, P. A. M., Chapman, J. M., Loup, C. 1994, A&A, 290, 228
- Zijlstra et al. (1996) Zijlstra, A. A., Loup, C., Waters, L. B. F. M., Whitelock, P. A., van Loon, J. Th., Guglielmo, F. 1996, MNRAS, 279, 32
- Zijlstra et al. (2006) Zijlstra, A. A., Matsuura, M., Wood, P. R., et al. 2006, MNRAS, 370, 1961
- Zsargó, Hillier & Georgiev (2008) Zsargó, J., Hillier, D. J., Georgiev, L. N. 2008, A&A, 478, 543
| # | Principal name aaNames of the type “N [number]” are “LHA 120-N [number]” in full; names of the type “RP” are from the Reid & Parker (2006) catalog. | Alternative name aaNames of the type “N [number]” are “LHA 120-N [number]” in full; names of the type “RP” are from the Reid & Parker (2006) catalog. | Object type bbType between parentheses if (re)classified on the basis of SAGE-Spec data — see §3 and §4.1. Used acronyms: AGB = Asymptotic Giant Branch star; B[e] = B-type star showing forbidden line emission; C = Carbon star; H ii = region of ionized Hydrogen; HAeBe = Herbig Ae/Be pre-main sequence star; HMS = Hot, Massive star; LBV = Luminous Blue Variable; Mol = molecular cloud; OH/IR = dusty star which exhibits OH maser emission; PN = Planetary Nebula; RCB = R Coronae Borealis type star; RSG = Red Supergiant; NC = Nebulous star Cluster; SNR = SuperNova Remnant; VLE - Very Low Excitation (PN-like) nebula; WR = Wolf-Rayet star; YSO = Young Stellar Object. | RA and Dec (J2000) | References |
|---|---|---|---|---|---|
| 1 | SAGE 043746754 ccAbbreviation of SSTISAGE1C J043727.59675435.1 (following the IRAS convention). | (Galaxy) | 4 37 27.61 67 54 35.0 | none | |
| 2 | SMP-LMC 11 | IRAS 045156710 | proto-PN | 4 51 37.82 67 05 17.0 | 9,10,16,38,39,42,71,94,95,100,122,123,147,153,205,222,229 |
| 3 | IRAS 045306916 | B[e], YSO ? | 4 52 45.70 69 11 49.4 | 30,42,47,51,63,84,100,155,170,193,195,196,206,214,223,230 | |
| 4 | IRAS 045376922 | Brey 3a | WR ? | 4 53 30.11 69 17 49.3 | 21,42,63,66,67,84,98,100,115,119 |
| 5 | N 89 | LM 1-8 | VLE | 4 55 06.53 69 17 08.5 | 42,63,79,84,98,100,146 |
| 6 | WOH G064 | IRAS 045536825 | RSG, OH/IR | 4 55 10.48 68 20 29.9 | 23,42,43,84,90,97,100,104,128,144,170,174,188,190,192,193,195,196,199,213 |
| 214,221,223,230 | |||||
| 7 | IRAS 045576639 | [HKN2006] 25 | HAeBe | 4 55 50.59 66 34 34.7 | 42,61 |
| 8 | IRAS 045626641 | [HKN2006] 44 | HAeBe | 4 56 22.59 66 36 56.8 | 61,100 |
| 9 | R 66 | HD 268835, IRAS 045716954 | B[e] | 4 56 47.08 69 50 24.8 | 42,45,63,73,74,83,84,100,101,112,125,154,159,160,161,181,183,184,223,227,228 |
| 10 | R 71 | HD 269006, IRAS 050277124 | LBV | 5 02 07.40 71 20 13.0 | 3,29,42,45,53,54,63,84,91,96,100,102,124,144,150,158,159,161,167,169,176,177 |
| 178,179,180,182,185,186,207,210,218,219 | |||||
| 11 | IRAS 050476644 | RP 1933 | PN ? (HMS ?) | 5 04 47.00 66 40 30.3 | 23,42,84,140 |
| 12 | SMP-LMC 21 | N 97 | PN | 5 04 51.97 68 39 09.5 | 4,7,17,39,41,46,63,93,94,95,120,122,134,140,147,163,165,201,203,212,222 |
| 13 | SMP-LMC 28 | IRAS 050816855 | PN | 5 07 57.62 68 51 47.3 | 10,11,39,95,100,122,123,140,147,152,162,164,204,222,229 |
| 14 | SMP-LMC 36 | N 107 | PN | 5 10 39.60 68 36 04.9 | 10,11,31,39,63,64,71,95,100,120,122,140,147,166,212 |
| 15 | IRAS 051376914 | N 112 | H ii | 5 13 24.66 69 10 48.1 | 18,23,30,42,47,49,50,51,60,63,78,84,85,108,136 |
| 16 | MSX-LMC 222 | IRAS 051416938 ? | YSO | 5 13 41.99 69 35 26.7 | 8,23,42,84 |
| 17 | MSX-LMC 349 | C | 5 17 26.93 68 54 58.7 | 42,58,92,109,198,231 | |
| 18 | IRAS 052166753 | TRM 11, N 44A | HMS | 5 21 29.68 67 51 06.6 | 24,42,63,84,100,140,142,143,195,223,230 |
| 19 | SAGE 052236841 ddAbbreviation of SSTISAGE1C J052222.92684101.1 (following the IRAS convention). | (Galaxy ?) | 5 22 22.96 68 41 01.1 | none | |
| 20 | HS 270-IR1 | IRAS 052467137 | (YSO) | 5 23 53.93 71 34 43.8 | 42,69,130,189 |
| 21 | SMP-LMC 62 | IRAS 052577135, N 201 | PN | 5 24 55.08 71 32 56.1 | 4,7,10,11,14,17,37,39,40,46,52,63,64,65,71,93,95,100,113,120,122,123,140,147 |
| 153,202,203,205,209,212,222 | |||||
| 22 | N 51-YSO1 | MSX LMC 824 | YSO | 5 26 01.22 67 30 11.9 | 27,42,63,127,151 |
| 23 | N 49 | SNR B052566.1 | SNR | 5 26 03.10 66 05 17.2 | 6,13,15,20,22,25,26,30,33,34,35,36,44,47,48,49,50,51,56,60,63,68,72,86,99,103 |
| 105,106,107,110,111,116,118,121,129,131,132,133,138,145,148,149,157,171,172 | |||||
| 173,200,208,211,216,217,224,225 | |||||
| 24 | MSX-LMC 577 | IRAS 052666743 ? | (YSO ?) | 5 26 30.60 67 40 36.7 | 42 |
| 25 | IRAS 052817126 | (YSO ?) | 5 27 23.14 71 24 26.3 | none | |
| 26 | IRAS 052806910 | NGC 1984-IR1 | RSG, OH/IR | 5 27 40.06 69 08 04.6 | 100,104,189,195,198,199,223 |
| 27 | IRAS 052916700 | GRV 05296700 | C | 5 29 07.59 66 58 15.1 | 55,58,100,141,188,191,214,230,231 |
| 28 | IRAS 052986957 | HS 327E-IR1 | AGB, OH/IR | 5 29 24.53 69 55 15.9 | 42,84,100,170,188,189,191,193,194,223,230 |
| 29 | IRAS 053256629 | N 55A | H ii | 5 32 31.95 66 27 15.2 | 23,42,63,75,84 |
| 30 | IRAS 053286827 | MSX-LMC 771 | YSO | 5 32 38.59 68 25 22.4 | 42,84,100,130,187,197,199,215 |
| 31 | RP 775 | MSX-LMC 797 | H ii | 5 32 44.40 69 30 05.5 | 42,140 |
| 32 | IRAS 053296708 | TRM 60 | AGB, OH/IR | 5 32 51.36 67 06 51.8 | 42,59,84,100,139,142,155,170,188,191,193,195,214,220,223,230 |
| 33 | MSX-LMC 783 | C | 5 32 55.44 69 20 26.6 | 42,92 | |
| 34 | HV 2671 | MSX-LMC 755 | RCB | 5 33 48.92 70 13 23.6 | 1,2,32,42,70,89 |
| 35 | MSX-LMC 741 | (HMS ?) | 5 35 25.83 71 19 56.6 | 42 | |
| 36 | R 126 | HD 37974, IRAS 053686924 | B[e] | 5 36 25.85 69 22 55.7 | 3,5,42,45,63,83,84,87,88,100,101,112,114,135,137,144,154,156,161,175,181,184 |
| 226,227,232 | |||||
| 37 | 30 Dor-17 | MSX-LMC 1786 | YSO | 5 37 28.09 69 08 47.8 | 16,42,80,130,140 |
| 38 | N 158B | MSX-LMC 894 | H ii (HMS ?) | 5 38 44.53 69 24 38.3 | 23,42,63,84 |
| 39 | N 159-P2 | LI-LMC 1501E | YSO | 5 39 41.86 69 46 11.9 | 28,81,82,126,168 |
| 40 | N 160-1 | Mol | 5 39 59.49 69 37 30.3 | 76,80 | |
| 41 | N 159S | MSX-LMC 948 | YSO | 5 40 00.67 69 47 13.4 | 19,42,62,63,77,82,117 |
| 42 | UFO 1 | (YSO ?) | 5 40 11.83 70 10 04.2 | none | |
| 43 | WOH G457 ? | (YSO ?) | 5 40 11.95 70 09 15.7 | 57,213 | |
| 44 | RP 85 | PN ? | 5 40 33.57 70 32 40.3 | 140 | |
| 45 | SAGE 054077011 eeAbbreviation of SSTISAGE1C J054043.15701110.3 (following the IRAS convention). | (YSO ?) | 5 40 43.18 70 11 10.3 | none | |
| 46 | MSX-LMC 1794 | IRAS 054106927 | H ii | 5 40 44.00 69 25 54.5 | 23,42,84 |
| 47 | MSX-LMC 956 | (YSO ?) | 5 40 49.27 70 10 13.6 | 42 | |
| 48 | BSDL 2959 | IRAS 054586710 ? | NC | 5 45 44.80 67 09 28.2 | 12 |
References. — 1. Alcock et al. (1996); 2. Alcock et al. (2001); 3. Allen & Glass (1976); 4. Aller et al. (1987); 5. Ardeberg et al. (1972); 6. Banas et al. (1997); 7. Barlow (1987); 8. Beasley et al. (1996); 9. Bernard-Salas et al. (2006); 10. Bernard-Salas et al. (2008); 11. Bernard-Salas et al. (2009); 12. Bica et al. (1999); 13. Bilikova et al. (2007); 14. Blades et al. (1992); 15. Blair et al. (2000); 16. Blum et al. (2006); 17. Boffi & Stanghellini (1994); 18. Bojičić et al. (2007); 19. Bolatto et al. (2000); 20. Bolton & Butler (1975); 21. Breysacher, Azzopardi & Testor (1999); 22. Brogan et al. (2004); 23. Buchanan et al. (2006); 24. Chen et al. (2009); 25. Chu (1997); 26. Chu & Kennicutt (1988); 27. Chu et al. (2005); 28. Comerón & Claes (1998); 29. Davies, Oudmaijer & Vink (2005); 30. Davies, Elliott & Meaburn (1976); 31. de Freitas Pacheco, Costa & Maciel (1993); 32. De Marco et al. (2002); 33. Dennefeld (1986); 34. Dickel & Milne (1994); 35. Dickel & Milne (1998); 36. Dopita (1976); 37. Dopita & Meatheringham (1991); 38. Dopita, Ford & Webster (1985); 39. Dopita et al. (1988); 40. Dufour (1991); 41. Dufour & Killen (1977); 42. Egan, Van Dyk & Price (2001); 43. Elias, Frogel & Schwering (1986); 44. Elvis et al. (1992); 45. Feast, Thackeray & Wesselink (1960); 46. Feibelman & Aller (1987); 47. Filipović et al. (1995); 48. Filipović et al. (1996); 49. Filipović et al. (1998a); 50. Filipović et al. (1998b); 51. Filipović et al. (1998c); 52. Filipović et al. (2009); 53. Glass (1974); 54. Glass (1984); 55. Glass & Reid (1985); 56. Graham et al. (1987); 57. Groenewegen (2004); 58. Groenewegen et al. (2007); 59. Groenewegen et al. (1995); 60. Haberl & Pietsch (1999); 61. Hatano et al. (2006); 62. Heikkilä, Johansson & Olofsson (1998); 63. Henize (1956); 64. Henry (1990); 65. Herald & Bianchi (2004); 66. Heydari-Malayeri & Melnick (1992); 67. Heydari-Malayeri, Melnick & van Drom (1990); 68. Hill et al. (1995); 69. Hodge & Sexton (1966); 70. Hodge & Wright (1967); 71. Hora et al. (2008); 72. Hughes, Hayashi & Koyama (1998); 73. Hutchings (1966); 74. Hutchings (1980); 75. Indebetouw, Johnson & Conti (2004); 76. Indebetouw et al. (2008); 77. Israel & Koornneef (1991); 78. Israel et al. (1993); 79. Joblin et al. (2008); 80. Johansson et al. (1998); 81. Jones et al. (1986); 82. Jones et al. (2005); 83. Kastner et al. (2006); 84. Kastner et al. (2008); 85. Klein et al. (1989); 86. Klose et al. (2004); 87. Koornneef & Code (1981); 88. Kraus, Borges Fernandes & de Araújo (2007); 89. Kurochkin (1992); 90. Kwok, Volk & Bidelman (1997); 91. Lamers et al. (1998a); 92. Leisenring, Kemper & Sloan (2008); 93. Leisy & Dennefeld (1996); 94. Leisy & Dennefeld (2006); 95. Leisy et al. (1997); 96. Lennon et al. (1993); 97. Levesque et al. (2009); 98. Lindsay & Mullan (1963); 99. Long, Helfand & Grabelsky (1981); 100. Loup et al. (1997); 101. Magalhães (1992); 102. Manfroid et al. (1991); 103. Marsden et al. (1996); 104. Marshall et al. (2004); 105. Mathewson & Clarke (1973); 106. Mathewson & Healey (1964); 107. Mathewson et al. (1983); 108. Mathewson et al. (1985); 109. Matsuura et al. (2006); 110. McGee, Brooks & Batchelor (1972); 111. McGee, Newton & Butler (1978); 112. McGregor, Hyland & Hillier (1988); 113. Meatheringham & Dopita (1991); 114. Merrill & Burwell (1933); 115. Meynadier & Heydari-Malayeri (2007); 116. Milne, Caswell & Haynes (1980); 117. Minamidani et al. (2008); 118. Mizuno et al. (2001); 119. Moffat (1991); 120. Monk, Barlow & Clegg (1988); 121. Morel (1984); 122. Morgan (1984); 123. Morgan & Parker (1998); 124. Munari et al. (2009); 125. Muratorio & Friedjung (1988); 126. Nakajima et al. (2005); 127. Oey (1996); 128. Ohnaka et al. (2008); 129. Oliva, Moorwood & Danziger (1989); 130. Oliveira et al. (2009) 131. Park et al. (2003); 132. Parker et al. (1998); 133. Payne, White & Filipović (2008); 134. Peña et al. (1994); 135. Pickering & Fleming (1897); 136. Pietrzyński et al. (1999); 137. Porter (2003); 138. Rakowski, Raymond & Szentgyorgyi (2007); 139. Reid (1991); 140. Reid & Parker (2006); 141. Reid, Glass & Catchpole (1988); 142. Reid, Tinney & Mould (1990); 143. Roche, Aitken & Smith (1987); 144. Roche, Aitken & Smith (1993); 145. Russell & Dopita (1990); 146. Sanduleak & Philip (1977); 147. Sanduleak, MacConnell & Philip (1978); 148. Sankrit, Blair & Raymond (2004); 149. Sasaki, Haberl & Pietsch (2000); 150. Schmidt-Kaler et al. (1999); 151. Seale et al. (2009); 152. Shaw et al. (2001); 153. Shaw et al. (2006); 154. Shore & Sanduleak (1984); 155. Sloan et al. (2008); 156. Smith (1957); 157. Sorai et al. (2001); 158. Spoon et al. (1994); 159. Stahl & Wolf (1986); 160. Stahl et al. (1983); 161. Stahl et al. (1985); 162. Stanghellini, Shaw & Gilmore (2005); 163. Stanghellini et al. (1999); 164. Stanghellini et al. (2002); 165. Stanghellini et al. (2007); 166. Stasińska, Richer & McCall (1998); 167. Sterken et al. (1993); 168. Testor et al. (2006); 169. Thackeray (1974); 170. Trams et al. (1999); 171. Tuohy (1980); 172. Vancura et al. (1992a); 173. Vancura et al. (1992b); 174. Vandenbussche et al. (2002); 175. van Genderen (1970); 176. van Genderen (1979a); 177. van Genderen (1979b); 178. van Genderen (1982); 179. van Genderen (1989); 180. van Genderen (1998); 181. van Genderen & Sterken (2002); 182. van Genderen, de Groot & Sterken (1997); 183. van Genderen, Groot & Thé (1983); 184. van Genderen, Jones & Sterken (2006); 185. van Genderen et al. (1985); 186. van Genderen et al. (1988); 187. van Loon (2000); 188. van Loon, Zijlstra & Groenewegen (1999); 189. van Loon, Marshall & Zijlstra (2005); 190. van Loon et al. (1996); 191. van Loon et al. (1998a); 192. van Loon et al. (1998b); 193. van Loon et al. (1999b); 194. van Loon et al. (2001a); 195. van Loon et al. (2001b); 196. van Loon et al. (2005a); 197. van Loon et al. (2005c); 198. van Loon et al. (2006); 199. van Loon et al. (2008); 200. van Paradijs et al. (1996); 201. Vassiliadis et al. (1992); 202. Vassiliadis et al. (1998a); 203. Vassiliadis et al. (1998b); 204. Villaver, Stanghellini & Shaw (2003); 205. Villaver, Stanghellini & Shaw (2007); 206. Voges et al. (2008); 207. Voors et al. (1999); 208. Wang et al. (1991); 209. Webster (1976); 210. Weis (2003); 211. Westerlund & Mathewson (1966); 212. Westerlund & Smith (1964); 213. Westerlund, Olander & Hedin (1981); 214. Whitelock et al. (2003); 215. Whitney et al. (2008); 216. Williams, Chu & Gründl (2006); 217. Williams et al. (1999); 218. Wolf (1975); 219. Wolf & Zickgraf (1986); 220. Wood (1998); 221. Wood, Bessell & Whiteoak (1986); 222. Wood et al. (1987); 223. Wood et al. (1992); 224. Wright et al. (1994); 225. Yamaguchi et al. (2001); 226. Zickgraf et al. (1985); 227. Zickgraf et al. (1986); 228. Zickgraf et al. (1989); 229. Zijlstra et al. (1994); 230. Zijlstra et al. (1996); 231. Zijlstra et al. (2006); 232. Zsargó, Hillier & Georgiev (2008).
| # | AOR Key | Integration aaTotal on-source integration time, (s). | Quality | Extraction | Notes |
|---|---|---|---|---|---|
| 1 | 22459648 | 20 10 | good | on–off | |
| 2 | 22450432 | 20 10 | ok | on–off | |
| 3 | 22453504 | 10 3 | good | on–off | |
| 4 | 22457088 | 20 10 | good | on–off | |
| 5 | 22460416 | 8 3 | good | on–off | |
| 6 | 22448640 | 8 10 | good | on–off | |
| 7 | 22457344 | 3 10 | good | on–off | |
| 8 | 22457600 | 6 10 | good | on–off | |
| 9 | 22453760 | 20 10 | good | on–off | |
| 10 | 22454016 | 9 10 | good | on–off | |
| 11 | 22451456 | 8 3 | good | on–off | |
| 12 | 22450688 | 20 10 | good | on–off | |
| 13 | 22450944 | 20 10 | good | on–off | |
| 14 | 22449664 | 20 10 | bad | on only | |
| 15 | 22452992 | 8 3 | good | on–off | |
| 16 | 22451712 | 8 3 | good | on–off | |
| 17 | 22449920 | 20 10 | bad | on–off | b |
| 18 | 22451968 | 8 3 | good | on–off | |
| 19 | 22457856 | 20 10 | good | on–off | |
| 20 | 22458112 | 20 10 | good | on–off | |
| 21 | 22451200 | 20 10 | ok | on–off | |
| 22 | 22458368 | 14 10 | good | on–off | |
| 23 | 22454272 | 20 10 | good | on–off | c |
| 24 | 22455296 | 6 10 | good | on–off | d |
| 25 | 22458624 | 20 10 | ok | on–off | |
| 26 | 22454528 | 8 3 | good | on–off | |
| 27 | 22450176 | 20 10 | good | on–off | |
| 28 | 22448896 | 20 10 | bad | on only | e |
| 29 | 22452224 | 8 3 | good | on–off | |
| 30 | 22452480 | 12 10 | good | on only | f |
| 31 | 22459904 | 10 10 | good | on–off | g |
| 32 | 22449152 | 20 10 | good | on–off | |
| 33 | 22455552 | 20 10 | good | on–off | h |
| 34 | 22454784 | 20 10 | poor | on–off | i |
| 35 | 22455808 | 20 10 | good | on–off | |
| 36 | 22455040 | 20 10 | ok | on–off | |
| 37 | 22452736 | 3 10 | good | on–off | j |
| 38 | 22460672 | 8 3 | good | on–off | |
| 39 | 22453248 | 8 3 | good | on–off | |
| 40 | 22458880 | 5 10 | ok | on only | k |
| 41 | 22459136 | 3 10 | ok | on only | l |
| 42 | 22456064 | 7 10 | good | on–off | |
| 43 | 22449408 | 7 10 | good | on–off | |
| 44 | 22460160 | 20 10 | ok | on–off | |
| 45 | 22456320 | 20 10 | good | on only | m |
| 46 | 22456576 | 3 10 | good | on–off | |
| 47 | 22456832 | 9 10 | good | on only | n |
| 48 | 22459392 | 5 10 | good | on–off | o |
| # | AOR Target | aaThe variability at 24 m is defined as: . | Notes | ||||||
|---|---|---|---|---|---|---|---|---|---|
| [mJy] | [mJy] | [mJy] | [mJy] | [mJy] | [mJy] | ||||
| 1 | SAGE 043746754 | 11.1 | 0.2 | 200 | 4 | 0 | |||
| 2 | SMP-LMC 11 | 489.5 | 1.8 | 108 | 3 | 4 | |||
| 3 | IRAS 045306916 | 3251.5 | 11.9 | 15110 | 287 | 15420 | 290 | 38 | |
| 4 | IRAS0 45376922 | 1295.0 | 4.5 | 768 | 19 | 0 | |||
| 5 | N 89 | 1013.9 | 3.3 | 8725 | 110 | 5908 | 237 | 11 | |
| 6 | WOH G064 | 865.2 | 17.2 | 1954 | 38 | b | |||
| 7 | IRAS 045576639 | 1064.0 | 4.0 | 6870 | 129 | 8242 | 239 | 2 | |
| 8 | IRAS 045626641 | 661.7 | 2.5 | 2420 | 50 | 0 | |||
| 9 | R 66 | 837.5 | 3.9 | 528 | 9 | 6 | |||
| 10 | R 71 | 1858 | 24 | c | |||||
| 11 | IRAS 050476644 | 1593.5 | 5.0 | 16310 | 159 | 10650 | 161 | 1 | |
| 12 | SMP-LMC 21 | 88.2 | 0.4 | 157 | 4 | 4 | |||
| 13 | SMP-LMC 28 | 219.9 | 1.0 | 254 | 7 | 8 | |||
| 14 | SMP-LMC 36 | 200.4 | 1.5 | 119 | 3 | 3 | d | ||
| 15 | IRAS 051376914 | 1551.5 | 9.7 | 18690 | 256 | 40 | |||
| 16 | MSX-LMC 222 | 1006.5 | 3.1 | 23730 | 382 | 23040 | 571 | 9 | |
| 17 | MSX-LMC 349 | 76.2 | 0.4 | 189 | 5 | 62 | e | ||
| 18 | IRAS 052166753 | 670.9 | 21.6 | 30580 | 395 | 16850 | 339 | b,f | |
| 19 | SAGE 052236841 | 77.2 | 0.6 | 547 | 12 | 1712 | 42 | 2 | |
| 20 | HS 270-IR1 | 345.4 | 1.3 | 1894 | 26 | 2 | |||
| 21 | SMP-LMC 62 | 278.0 | 1.4 | 130 | 4 | 3 | |||
| 22 | N 51-YSO 1 | 394.4 | 1.8 | 2057 | 37 | 1476 | 67 | 0 | |
| 23 | N 49 | 47.9 | 0.2 | 3598 | 84 | 3540 | 129 | 15 | g |
| 24 | MSX-LMC 577 | 457.9 | 1.6 | 2814 | 38 | 2831 | 86 | 4 | |
| 25 | IRAS 052817126 | 169.2 | 0.8 | 596 | 13 | 0 | |||
| 26 | IRAS 052806910 | 7349 | 66 | c | |||||
| 27 | IRAS 052916700 | 10.0 | 0.1 | 100 | 3 | 19 | h | ||
| 28 | IRAS 052986957 | 954.0 | 3.6 | 111 | 5 | 23 | |||
| 29 | IRAS 053256629 | 677.6 | 5.1 | 15820 | 403 | 37620 | 811 | 14 | |
| 30 | IRAS 053286827 | 994.7 | 3.9 | 4822 | 142 | 11130 | 231 | 16 | |
| 31 | RP 775 | 189.1 | 0.7 | 2106 | 32 | 2578 | 88 | 1 | |
| 32 | IRAS 053296708 | 1216.0 | 5.3 | 127 | 3 | 8 | |||
| 33 | MSX-LMC 783 | 28.2 | 0.4 | 856 | 15 | 1719 | 44 | 9 | i |
| 34 | HV 2671 | 136.0 | 0.7 | 138 | 6 | 9 | |||
| 35 | MSX-LMC 741 | 338.5 | 1.3 | 195 | 6 | 3 | |||
| 36 | R 126 | 1122.5 | 4.3 | 380 | 24 | 1 | |||
| 37 | 30 Dor-17 | 1175.0 | 7.6 | 8018 | 473 | 20020 | 636 | 59 | |
| 38 | N 158B | 2282.5 | 6.4 | 18950 | 479 | 26260 | 608 | 3 | |
| 39 | N 159-P2 | 4292.5 | 22.6 | 60390 | 2860 | (38) | j | ||
| 40 | N 160-1 | 1246.0 | 4.6 | 5823 | 344 | 9 | |||
| 41 | N 159S | 1854.5 | 8.0 | 15860 | 714 | 1 | |||
| 42 | UFO 1 | 52.0 | 0.5 | 2568 | 55 | 4320 | 238 | (52) | k |
| 43 | WOH G457 ? | 155.7 | 0.6 | 2490 | 59 | 3659 | 299 | 2 | |
| 44 | RP 85 | 89.7 | 0.5 | 218 | 7 | 2 | |||
| 45 | SAGE 054077011 | 197.0 | 0.9 | 3692 | 73 | 4 | l | ||
| 46 | MSX-LMC 1794 | 329.9 | 1.4 | 7442 | 175 | 16910 | 304 | 4 | |
| 47 | MSX-LMC 956 | 73.5 | 0.4 | 5495 | 103 | (46) | m | ||
| 48 | BSDL 2959 | 340.7 | 1.8 | 3181 | 113 | 15510 | 324 | 1 |
| # | AOR Target | Type aaThe spectral classification scheme is described in §4.3. | bbNot detected.Only one 24-m epoch. | ccExtended 63-m line emission.No 24-m data. | ddSpectrum of a bright point source in offset position.There is another source at with mJy. | Notes | ||
|---|---|---|---|---|---|---|---|---|
| [K] | ——————— [L⊙] ——————— | |||||||
| 1 | SAGE 043746754 | C0 | 1 | 3 | ||||
| 2 | SMP-LMC 11 | C0 | 2 | |||||
| 3 | IRAS 045306916 | C1b | 2 | |||||
| 4 | IRAS0 45376922 | W2 | 4 | 1 | ||||
| 5 | N 89 | C2b | 2 | 1 | ||||
| 6 | WOH G064 | W1b | 1 | 1 | 2 | |||
| 7 | IRAS 045576639 | C2b | 2 | 8 | ||||
| 8 | IRAS 045626641 | C1 | ||||||
| 9 | R 66 | W0 | 2 | |||||
| 10 | R 71 | W3 | 1 | 0 | ||||
| 11 | IRAS 050476644 | C2b | 3 | 1 | f | |||
| 12 | SMP-LMC 21 | F0 | 1 | 1 | 1 | |||
| 13 | SMP-LMC 28 | F0b | ||||||
| 14 | SMP-LMC 36 | F0 | ||||||
| 15 | IRAS 051376914 | C2 | 3 | 2 | ||||
| 16 | MSX-LMC 222 | C1 | 1 | 1 | ||||
| 17 | MSX-LMC 349 | F0 | 3 | |||||
| 18 | IRAS 052166753 | F1 | 1 | 4 | ||||
| 19 | SAGE 052236841 | C0b | 1 | |||||
| 20 | HS 270-IR1 | C1 | 3 | 2 | ||||
| 21 | SMP-LMC 62 | F0 | ||||||
| 22 | N 51-YSO 1 | C2b | 3 | e | ||||
| 23 | N 49 | F1b | 55 | 4 | f | |||
| 24 | MSX-LMC 577 | C1 | 8 | 2 | e | |||
| 25 | IRAS 052817126 | C0 | 2 | |||||
| 26 | IRAS 052806910 | W0b | 1 | 8 | 9 | |||
| 27 | IRAS 052916700 | F0 | 1 | |||||
| 28 | IRAS 052986957 | W3b | ||||||
| 29 | IRAS 053256629 | C2b | 3 | 3 | ||||
| 30 | IRAS 053286827 | C0 | e? | |||||
| 31 | RP 775 | C1 | 6 | 1 | ||||
| 32 | IRAS 053296708 | F0 | ||||||
| 33 | MSX-LMC 783 | C0 | 1 | 1 | e | |||
| 34 | HV 2671 | F0 | ||||||
| 35 | MSX-LMC 741 | W0 | 1 | |||||
| 36 | R 126 | W3 | 6 | |||||
| 37 | 30 Dor-17 | C2 | 3 | |||||
| 38 | N 158B | C1b | 2 | 9 | ||||
| 39 | N 159-P2 | C2 | 4 | |||||
| 40 | N 160-1 | C1 | 2 | 6 | ||||
| 41 | N 159S | C3b | 20 | |||||
| 42 | UFO 1 | C0b | 2 | 5 | e | |||
| 43 | WOH G457 ? | C0b | 1 | |||||
| 44 | RP 85 | C1b | 1 | 1 | ||||
| 45 | SAGE 054077011 | C1b | ||||||
| 46 | MSX-LMC 1794 | C1b | 2 | e | ||||
| 47 | MSX-LMC 956 | C1 | 1 | |||||
| 48 | BSDL 2959 | C1b | ||||||
| # | Identification aaNames of the type “N [number]” are “LHA 120-N [number]” in full. | Object type bbThe spectral slope is defined as: . | RA and Dec (J2000) | References | Quality | Extraction | Type ccThe dust temperature was estimated from the spectral slope as described in §5.3.1 (cf. Fig. 6). | ddThe far-IR luminosity was estimated based on the dust temperature as described in §5.5, assuming a distance of 50 kpc. |
|---|---|---|---|---|---|---|---|---|
| 16B | SAGE 051386935 eeOffset position has high background.The associated 70-m source is at .Possible broad crystalline water ice band between –70 m. | (H ii ?) | 5 13 46.5 69 35 10 | none | poor | off | C0 | |
| 23B | N 49 | SNR | 5 26 07 66 05.0 | (Table 1) | poor | off | C1 | |
| 24B | LH 55 | NC | 5 26 38.6 67 39 23 | 3,8,11 | ok | off | F0 | |
| 30B | IRAS 053306826 | H ii | 5 32 48.3 68 23 59 | 2,7,9,10 | good | off | C2 | |
| 31B | SAGE 053286930 ffSpectrum of a bright point source in offset position.The associated 24-m source is at , and there is another source at with mJy.Possible blend of molecular lines of water and/or hydroxyl at m. | (H ii ?) | 5 32 49.4 69 30 37 | none | poor | on | C2 | |
| 38B | [H88b] 86 ? | Mol ? | 5 38 40.9 69 25 14 | 5 | poor | off | C3 | |
| 40B | N 160-3 | Mol (H ii ?) | 5 40 04.4 69 38 21 | 6 | poor | off ggSpectrum of a second bright point source on the slit.The associated 70-m source is at , the associated 160-m source is at , and there is another source at with mJy. | C3 | |
| 41B | N 159-K4 ? | (HMS ?) | 5 39 55.0 69 46 16 | 4 | poor | off | F0 | |
| 45B | MSX-LMC 956 | (YSO ?) | (#47) | (Table 1) | good | off | C1 | |
| 47B | SAGE 054077011 hhExtended continuum emission? See also Figure 3.The associated 70-m source is at , and there is another source at with mJy. | (YSO ?) | (#45) | (Table 1) | ok | off | C1 | |
| 48B | BSDL 2955 | NC | 5 45 43.9 67 09 55 | 1,2 | ok | off | C0 |
References. — 1. Bica et al. (1999); 2. Egan et al. (2001); 3. Filipović, Jones & White (2003); 4. Gatley, Hyland & Jones (1982); 5. Hodge (1988); 6. Johansson et al. (1998); 7. Kastner et al. (2008); 8. Lucke & Hodge (1970); 9. Marx, Dickey & Mebold (1997); 10. van Loon et al. (2005c); 11. Wang & Helfand (1991).