The First Generation of Virgo Cluster Dwarf Elliptical Galaxies?
Abstract
In the light of the question whether most early-type dwarf (dE) galaxies in clusters formed through infall and transformation of late-type progenitors, we search for an imprint of such an infall history in the oldest, most centrally concentrated dE subclass of the Virgo cluster: the nucleated dEs that show no signatures of disks or central residual star formation. We select dEs in a (projected) region around the central elliptical galaxies, and subdivide them by their line-of-sight velocity into fast-moving and slow-moving ones. These subsamples turn out to have significantly different shapes: while the fast dEs are relatively flat objects, the slow dEs are nearly round. Likewise, when subdividing the central dEs by their projected axial ratio into flat and round ones, their distributions of line-of-sight velocities differ significantly: the flat dEs have a broad, possibly two-peaked distribution, whereas the round dEs show a narrow single peak. We conclude that the round dEs probably are on circularized orbits, while the flat dEs are still on more eccentric or radial orbits typical for an infalling population. In this picture, the round dEs would have resided in the cluster already for a long time, or would even be a cluster-born species, explaining their nearly circular orbits. They would thus be the first generation of Virgo cluster dEs. Their shape could be caused by dynamical heating through repeated tidal interactions. Further investigations through stellar population measurements and studies of simulated galaxy clusters would be desirable to obtain definite conclusions on their origin.
Subject headings:
galaxies: dwarf — galaxies: elliptical and lenticular, cD — galaxies: structure — galaxies: evolution — galaxies: kinematics and dynamics — galaxies: clusters: individual: (Virgo)1. Introduction: the variety of early-type dwarfs
Early-type dwarf galaxies largely outnumber all other galaxy types in rich galaxy clusters (e.g., Binggeli et al., 1985), while they are less abundant on average in galaxy groups, and almost absent in the field (Gu et al., 2006). Among dwarf galaxies, the fraction of those with early-type morphology is significantly larger in dynamically more evolved environments (Trentham & Tully, 2002). Apart from this global trend, early-type dwarfs also show a pronounced relation with local galaxy density within a given cluster or group: Binggeli et al. (1987) found that their number strongly increases with local density, analogous to the correlation for giants (Dressler, 1980), and Tully & Trentham (2008) observed that early-type dwarfs strongly cluster around major E/S0 galaxies. These findings have often been interpreted as indicating that early-type dwarfs are actually formed through environmental processes, thereby transforming late-type into early-type objects. Such mechanisms, mainly gas stripping and tidal effects on structure and star formation, have been investigated in various studies (e.g., Moore et al., 1998; van Zee et al., 2004; Sabatini et al., 2005; Boselli et al., 2008), with the main conclusion that one or more of these mechanisms must be responsible for the majority of cluster dEs.
Despite the apparently simple structure of early-type dwarfs, a closer investigation of their characteristics revealed a surprising complexity. Disk signatures, such as bars and weak spiral arms (cf. Jerjen et al., 2000), were identified in a significant fraction of bright Virgo cluster dEs (Lisker et al., 2006a, and references therein), confirming earlier indications of disks (Sandage & Binggeli, 1984; Binggeli & Cameron, 1991). The distribution of projected axial ratios reveals that these objects are not spheroidal, but are rather shaped like thick disk galaxies (Lisker et al., 2007). Similar shapes, though somewhat thicker, are found for the brighter nonnucleated dEs (Ferguson & Sandage, 1989), as well as for those with blue central colors from ongoing or very recent residual star formation (Vigroux et al., 1984; Lisker et al., 2006b). These dE subclasses do not show strong clustering, but are distributed more like the late-type cluster galaxies (Lisker et al., 2007), lending support to the above formation scenarios.
Only the nucleated dEs that do not show disk features or blue cores appear to keep up the image of dEs as spheroidal objects consisting of old stars, concentrated in regions of high local density (Ferguson & Sandage, 1989; Lisker et al., 2007). They are the dE subclass with the oldest stellar populations (Lisker et al., 2008; Paudel et al., 2009), and were concluded to be potential primordial objects in a study of the Coma and Fornax clusters (Rakos & Schombert, 2004). Indeed, semi-analytic galaxy evolution models tied to N-body simulations of hierarchical structure formation show at least qualitative consistency with the observed scaling relations and colors of early-type dwarf and giant galaxies (De Rijcke et al., 2005; Janz & Lisker, 2008, 2009), indicating that a “cosmological” formation of dEs from 3-sigma density peaks on top of the cluster potential is plausible as well. In the study presented here, our goal is to assess whether even the centrally concentrated nucleated dEs of the Virgo cluster show some indication of an infall history, linking their formation process to environmental effects.
2. Sample selection and data
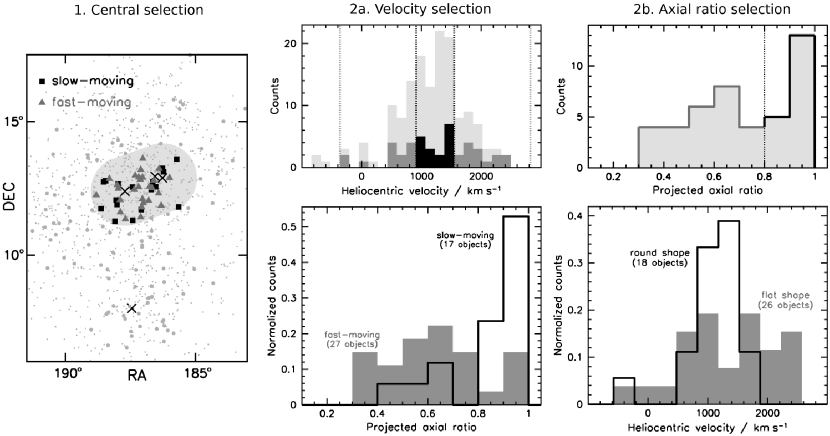
As central cluster region, we select an area encompassing the massive elliptical galaxies M84, M86, and M87, requiring that the projected distance to M87, to M84, or to their connecting axis, is less than 1.27, corresponding to 0.35 Mpc with mag (Fig. 1, left). This selection accounts for the fact that the dEs are not only clustered around M87, which marks the intracluster gas mass center (Boehringer et al., 1994), but their distribution peaks in the region between M84/M86 and M87 (Binggeli et al., 1987).
Based on the study of dE subclasses by Lisker et al. (2007), we select only nucleated dEs ( dE(N)s ) that display no disk features or blue central colors (cf. Lisker et al., 2006a, b). Only certain cluster members (Binggeli et al., 1985, 1993) brighter than mag are taken into account. This is the same magnitude limit up to which the Virgo cluster catalog (VCC, Binggeli et al., 1985) was found to be complete. Our classification of nucleated and non-nucleated dEs relies on the VCC. However, many apparently non-nucleated dEs actually host a faint nucleus hardly detectable with the imaging data on which the VCC was based (Grant et al., 2005; Côté et al., 2006). Nevertheless, using the VCC classification yielded the said differences in structure, color, and distribution of the subclasses, which is why we stick to this definition (also see the discussion in Lisker et al., 2007).
Heliocentric velocities are available for 46 dE(N)s in the central region through the NASA/IPAC Extragalactic Database (NED), of which 29 are provided by the Sloan Digital Sky Survey (SDSS) data release 4 (Adelman-McCarthy et al., 2006), and 17 from other sources (Binggeli et al., 1985, 1993; Conselice et al., 2001; Simien & Prugniel, 2002; Evstigneeva et al., 2007). Outer axial ratios are measured by fitting an ellipse to the -band isophote at a semimajor axis , where defines the half-light aperture (Lisker et al., 2007). Ultraviolet-optical colors (Kim et al. 2009, in preparation) are obtained by combining total far-ultraviolet () and near-ultraviolet () magnitudes provided by GALEX (Galaxy Evolution Explorer, Martin et al., 2005) with total optical magnitudes, measured by Lisker et al. (2008) on SDSS data release 5 images (Adelman-McCarthy et al., 2007).
3. Result: galaxy shape versus velocity
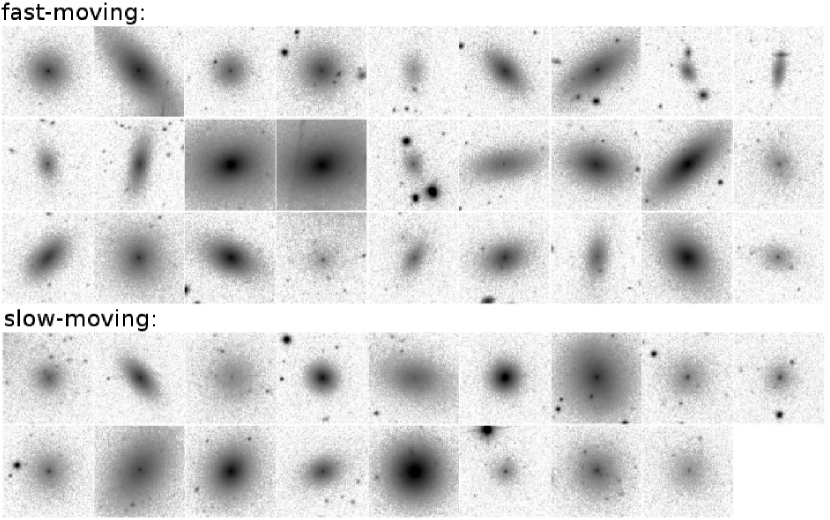
From the heliocentric velocities, we calculate relative line-of-sight velocities, using the median value km/s of all111Velocities are available through NED for 149 of 210 dE(N)s that are certain cluster members. Virgo cluster dE(N)s as zeropoint. We then use the semi-interquartile range km/s of all dE(N)s to divide the central dE(N)s into fast-moving and slow-moving ones with respect to the line of sight, according to their relative velocities (Fig. 1, top middle), not distinguishing between the direction of movement (positive or negative velocities). Two galaxies with velocities beyond are excluded, leaving 27 fast and 17 slow dE(N)s.
The projected axial ratios of fast and slow galaxies turn out to be significantly different (Fig. 1, bottom middle): while the slow ones have nearly round shapes, the fast ones are much more flattened. The median axial ratios are 0.90 and 0.64 for slow and fast galaxies, and the mean values are 0.84 and 0.63, respectively. A K-S test yields a probability of 0.1% that both subsamples are drawn from the same parent distribution.
The existence of two distinct subgroups is confirmed when the selection process is reversed: we now divide the central dE(N)s based on their projected axial ratio (Fig. 1, top right), and compare the resulting distributions of heliocentric velocities. Again, the two subsamples are clearly different. The round galaxies have a narrow, centrally peaked velocity distribution, while the flatter galaxies have a much broader distribution, possibly with a two-peak structure (Fig. 1, bottom right). The velocity dispersion, calculated as standard deviation with one clipping at ( for a normal distribution), is 737 km/s for the flatter subsample, and only 373 km/s for the round subsample. A K-S test on the distribution of velocities relative to the median, considering only absolute values, yields a probability of 0.1%.
4. Discussion
4.1. Subpopulations and their distribution
Following Conselice et al. (2001), the comparably high velocity dispersion of the flatter dE(N)s (737 km/s) could be seen as typical for a galaxy population with an infall history; spiral and irregular galaxies have similar dispersions (776 and 727 km/s, respectively, Conselice et al. 2001). However, there is one caveat to this straightforward interpretation: our galaxies were selected to be in the (projected) central cluster region, and there, the velocity dispersion of all galaxy types was found to increase (Conselice et al., 2001). The conclusion of Conselice et al. was that most galaxies are on radial or highly eccentric orbits. In the light of these observations, the low velocity dispersion of the round central dE(N)s is even more remarkable (373 km/s, as compared to the 462 km/s of giant ellipticals, Conselice et al. 2001). Due to the selection of galaxies in a projected central region, it is the most plausible explanation that those dE(N)s moving slow along the line of sight are on nearly circular orbits, whereas most of those with high line-of-sight velocities should be on more eccentric orbits.
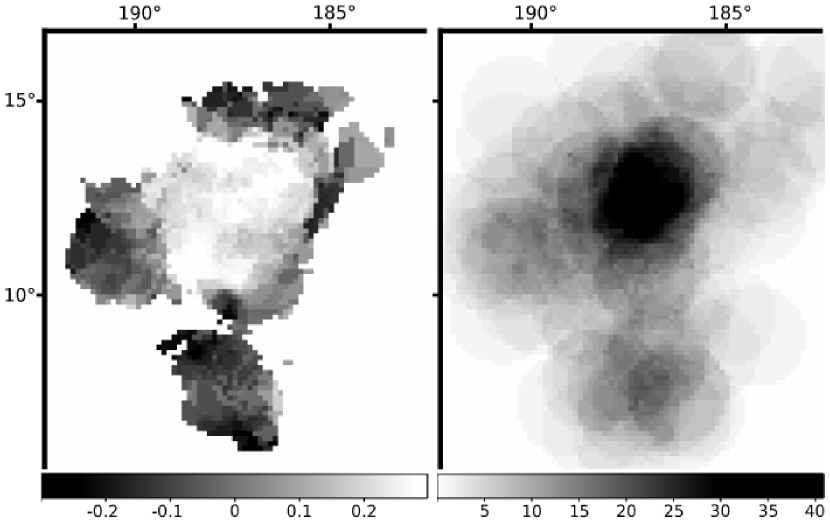
If this was the case, we should see, to some extent, a reverse effect when selecting galaxies in the projected outskirts: those on more circular orbits should now, on average, be the faster-moving ones along the line of sight. Indeed, when defining “slow” and “fast” locally, the clear axial ratio difference seen in the central area does not only disappear towards the outer regions, but is somewhat reversed (Fig. 2), supporting our interpretation. The circularized orbits of the round, slow dE(N)s might thus indicate that they are the first generation of dEs in the Virgo cluster (see also Biviano & Poggianti, 2009). Based on simulated cluster galaxies (Springel et al., 2005) in the semi-analytic model of De Lucia & Blaizot (2007), just above the mass range of dwarfs, we find indications that for galaxies in the projected cluster center, slow-moving galaxies have typically fallen in earlier than faster ones.
While those dE(N)s could represent the low-mass continuation of elliptical galaxies in the framework of CDM structure formation (Janz & Lisker, 2008, 2009), thus being “primordial” dEs (cf. Rakos & Schombert, 2004), one could also imagine that they were formed at early epochs out of other galaxies by transformation processes. On the one hand, the observations appear to be partially consistent with the galaxy harassment scenario (e.g., Moore et al., 1996), in which an infalling disk galaxy experiences several close encounters with massive substructures and is eventually transformed into a dE. In N-body simulations of harassment (Mastropietro et al., 2005), the overall shape of harassed objects becomes rounder with each further encounter. The rounder galaxies could thus have experienced infall and transformation at earlier epochs, having resided in the cluster for a longer time, leading to more tidal interactions. On the other hand, a possible inconsistency appears when considering that the strongest harassment effects occur when galaxies are orbiting within the cluster center, causing significant dynamical heating (Mastropietro et al., 2005). This would imply that the rounder galaxies should be orbiting in the (threedimensional) central region, deep within the Virgo cluster potential well. However, from an analysis of a galaxy cluster in the Millennium-II simulation (Boylan-Kolchin et al., 2009) with a mass comparable to Virgo, we find no significant difference between the clustercentric radii of galaxies moving slow and fast along the line-of-sight.222Unfortunately, good-quality individual distances from surface brightness fluctuations (Mei et al., 2007) are only available for 3 slow and 2 fast galaxies. Moreover, rounder galaxies end up with smaller sizes on average in the simulations, starting from the same progenitor mass. We do not observe such a difference in size; only the scatter is somewhat larger for the rounder/slower than for the flatter/faster ones.
4.2. Stellar population aspects
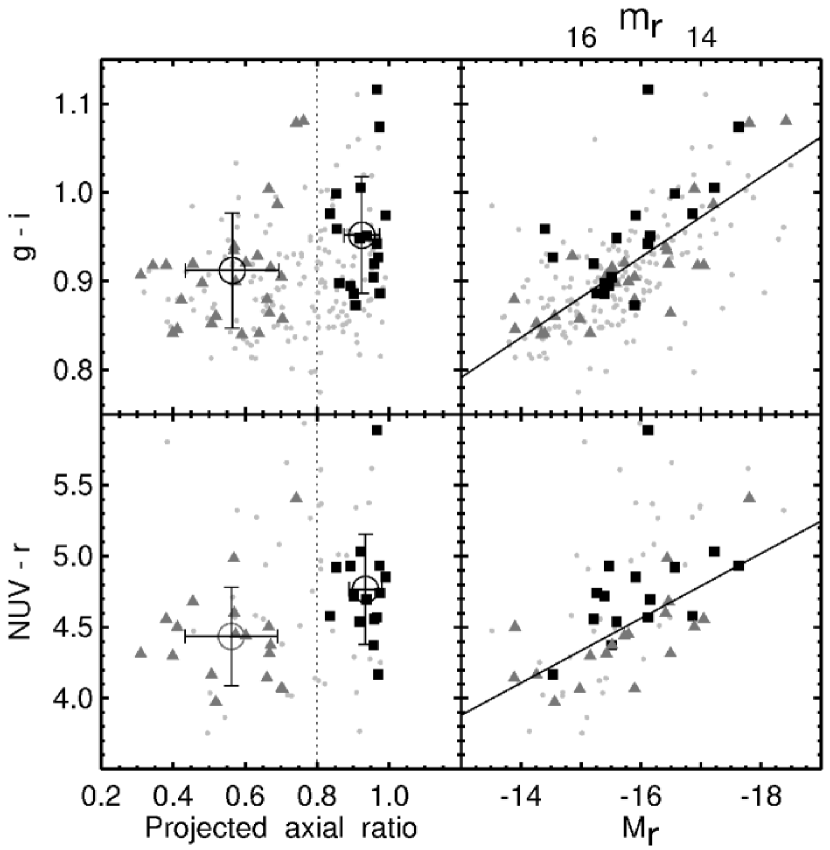
If the flatter dE(N)s experienced more recent infall, their star formation would have been truncated later, which should be reflected in their stellar population characteristics. Indeed, the colors of the round dE(N)s are redder than those of the flat ones (Fig. 3, top left). This is confirmed when examining the color-magnitude relation (CMR, top right). The difference is even clearer when the age-sensitive color is used instead (Fig. 3, bottom). A K-S test on the color residuals about the CMR yields a probability of 5.0% in and 2.1% in for the same parent distribution of the two subsamples. The values change to 7.4% and 3.7% when the reddest galaxy, which is an outlier to the CMR, is omitted. In (not shown), where useful measurements are only available for due to detection limits, the colors of both subsamples show no difference within the errors.
This behavior would be consistent with a small (1 Gyr) age difference between two populations that are already relatively old: as illustrated in Lisker & Han (2008), evolutionary synthesis models show that an aging stellar population continues to become redder with time in , while it reaches a more or less constant value. In fact, when fitting SDSS magnitudes, partly combined with near-infrared band photometry (Gavazzi et al., 2003, with improved reduction by T. Lisker), to GALEV evolutionary synthesis models (Kotulla et al., 2009), more than 60% of round/slow dE(N)s are fit best with an exponentially declining model with Gyr.333 The model grid comprised exponentially declining models with various decay times (0.5, 1, 2, and 4 Gyr), as well as models with constant star formation rate until an age of 2 or 8 Gyr, followed by an exponential decline with of 1 or 3 Gyr. Models with fixed metallicity ( of 0.0, -0.3, -0.7 or -1.7) as well as chemically consistent models were calculated. The fits were performed by the dedicated minimization routine GAZELLE written by R. Kotulla (in preparation). In contrast, the best-fit model of more than 60% of flat/fast dE(N)s has a constant star formation rate for Gyr, followed by an exponential decline with Gyr (Hielscher, 2009).444 A significantly different mean age of the two subsamples is, however, not found. Useful spectroscopic data are only available for 1 slow and 3 fast dE(N)s; a Lick index analysis yields an age of 3 Gyr for one fast dE(N), and ages above 10 Gyr for the remaining objects (Paudel et al., 2009).
So far, we neglected the fact that the relation between axial ratio and color is not only seen for our sample of central dE(N)s, but is actually present, to some extent, for the whole population of Virgo dE(N)s (Fig. 3, grey dots). This is not a new result: Barazza & Binggeli (2002) reported this very correlation, and concluded that it is a metallicity effect. Since outflows of metal-enriched gas occur primarily along the minor axis, flatter galaxies have a lower metallicity. Nevertheless, the star-formation history and starburst episodes determine the gas and metallicity loss, respectively, from dwarf galaxies (Recchi et al., 2006; Valcke et al., 2008). It therefore remains unclear whether these two findings, the correlation between shape and velocity on the one hand and between shape and color on the other hand, are at all related, or whether the latter correlation is simply inherent to all dEs, regardless of their velocity characteristics. More high-quality spectroscopic data are needed to investigate whether differences in age, metallicity, and/or other stellar population characteristics are the primary cause of the observed color differences.
As an aside, we note that a relation might exist between the nucleus “strength” (i.e., its relative light contribution) and the host galaxy’s projected axial ratio: the strongest nuclei were found by Binggeli et al. (2000) to reside in nearly round dE(N)s. However, a similar study by Grant et al. (2005), now using Sérsic instead of King profiles for the host galaxies, did not confirm a significant correlation except for a mild tendency.
5. Conclusions
We have established that different populations, or generations, of Virgo cluster dE galaxies can be distinguished based on their projected shapes and line-of-sight velocities. This is most likely interpreted with the flatter objects moving on radial or highly eccentric orbits, indicating an infalling galaxy population. In contrast, the round dEs have circularized orbits, characteristic for cluster-born galaxies or very early infall. They might thus be the first generation of Virgo cluster dEs. While more detailed stellar population measurements would be necessary for an unambiguous interpretation, the observational findings themselves constitute an important step towards understanding this most abundant galaxy population in clusters. Our results demonstrate the necessity to perform a similar deconvolution of dE populations in any ongoing and future study of dEs, if we aim at tracing back their evolutionary history along with that of their host clusters.
References
- Adelman-McCarthy et al. (2006) Adelman-McCarthy, J. K., et al. 2006, ApJS, 162, 38
- Adelman-McCarthy et al. (2007) —. 2007, ApJS, 172, 634
- Barazza & Binggeli (2002) Barazza, F. D. & Binggeli, B. 2002, A&A, 394, L15
- Binggeli et al. (2000) Binggeli, B., Barazza, F., & Jerjen, H. 2000, A&A, 359, 447
- Binggeli & Cameron (1991) Binggeli, B. & Cameron, L. M. 1991, A&A, 252, 27
- Binggeli et al. (1993) Binggeli, B., Popescu, C. C., & Tammann, G. A. 1993, A&AS, 98, 275
- Binggeli et al. (1985) Binggeli, B., Sandage, A., & Tammann, G. A. 1985, AJ, 90, 1681
- Binggeli et al. (1987) Binggeli, B., Tammann, G. A., & Sandage, A. 1987, AJ, 94, 251
- Biviano & Poggianti (2009) Biviano, A. & Poggianti, B. M. 2009, A&A, 501, 419
- Boehringer et al. (1994) Boehringer, H., Briel, U. G., Schwarz, R. A., Voges, W., Hartner, G., & Trumper, J. 1994, Nature, 368, 828
- Boselli et al. (2008) Boselli, A., Boissier, S., Cortese, L., & Gavazzi, G. 2008, ApJ, 674, 742
- Boylan-Kolchin et al. (2009) Boylan-Kolchin, M., Springel, V., White, S. D. M., Jenkins, A., & Lemson, G. 2009, MNRAS, 398, 1150
- Conselice et al. (2001) Conselice, C. J., Gallagher, III, J. S., & Wyse, R. F. G. 2001, ApJ, 559, 791
- Côté et al. (2006) Côté, P., et al. 2006, ApJS, 165, 57
- De Lucia & Blaizot (2007) De Lucia, G. & Blaizot, J. 2007, MNRAS, 375, 2
- De Rijcke et al. (2005) De Rijcke, S., Michielsen, D., Dejonghe, H., Zeilinger, W. W., & Hau, G. K. T. 2005, A&A, 438, 491
- Dressler (1980) Dressler, A. 1980, ApJ, 236, 351
- Evstigneeva et al. (2007) Evstigneeva, E. A., Gregg, M. D., Drinkwater, M. J., & Hilker, M. 2007, AJ, 133, 1722
- Ferguson & Sandage (1989) Ferguson, H. C. & Sandage, A. 1989, ApJ, 346, L53
- Gavazzi et al. (2003) Gavazzi, G., Boselli, A., Donati, A., Franzetti, P., & Scodeggio, M. 2003, A&A, 400, 451
- Grant et al. (2005) Grant, N. I., Kuipers, J. A., & Phillipps, S. 2005, MNRAS, 363, 1019
- Gu et al. (2006) Gu, Q., Zhao, Y., Shi, L., Peng, Z., & Luo, X. 2006, AJ, 131, 806
- Hielscher (2009) Hielscher, O. 2009, Diploma thesis, University of Heidelberg
- Janz & Lisker (2008) Janz, J. & Lisker, T. 2008, ApJ, 689, L25
- Janz & Lisker (2009) —. 2009, ApJ, 696, L102
- Jerjen et al. (2000) Jerjen, H., Kalnajs, A., & Binggeli, B. 2000, A&A, 358, 845
- Kotulla et al. (2009) Kotulla, R., Fritze, U., Weilbacher, P., & Anders, P. 2009, MNRAS, 539
- Lisker et al. (2006b) Lisker, T., Glatt, K., Westera, P., & Grebel, E. K. 2006b, AJ, 132, 2432
- Lisker et al. (2006a) Lisker, T., Grebel, E. K., & Binggeli, B. 2006a, AJ, 132, 497
- Lisker et al. (2008) —. 2008, AJ, 135, 380
- Lisker et al. (2007) Lisker, T., Grebel, E. K., Binggeli, B., & Glatt, K. 2007, ApJ, 660, 1186
- Lisker & Han (2008) Lisker, T. & Han, Z. 2008, ApJ, 680, 1042
- Martin et al. (2005) Martin, D. C., et al. 2005, ApJ, 619, L1
- Mastropietro et al. (2005) Mastropietro, C., Moore, B., Mayer, L., Debattista, V. P., Piffaretti, R., & Stadel, J. 2005, MNRAS, 364, 607
- Mei et al. (2007) Mei, S., et al. 2007, ApJ, 655, 144
- Moore et al. (1996) Moore, B., Katz, N., Lake, G., Dressler, A., & Oemler, A. 1996, Nature, 379, 613
- Moore et al. (1998) Moore, B., Lake, G., & Katz, N. 1998, ApJ, 495, 139
- Paudel et al. (2009) Paudel, S., Lisker, T., Kuntschner, H., Grebel, E. K., & Glatt, K. 2009, MNRAS, submitted
- Rakos & Schombert (2004) Rakos, K. & Schombert, J. 2004, AJ, 127, 1502
- Recchi et al. (2006) Recchi, S., Hensler, G., Angeretti, L., & Matteucci, F. 2006, A&A, 445, 875
- Sabatini et al. (2005) Sabatini, S., Davies, J., van Driel, W., Baes, M., Roberts, S., Smith, R., Linder, S., & O’Neil, K. 2005, MNRAS, 357, 819
- Sandage & Binggeli (1984) Sandage, A. & Binggeli, B. 1984, AJ, 89, 919
- Simien & Prugniel (2002) Simien, F. & Prugniel, P. 2002, A&A, 384, 371
- Smith et al. (2000) Smith, R. J., Lucey, J. R., Hudson, M. J., Schlegel, D. J., & Davies, R. L. 2000, MNRAS, 313, 469
- Springel et al. (2005) Springel, V., et al. 2005, Nature, 435, 629
- Trentham & Tully (2002) Trentham, N. & Tully, R. B. 2002, MNRAS, 335, 712
- Tully & Trentham (2008) Tully, R. B. & Trentham, N. 2008, AJ, 135, 1488
- Valcke et al. (2008) Valcke, S., de Rijcke, S., & Dejonghe, H. 2008, MNRAS, 389, 1111
- van Zee et al. (2004) van Zee, L., Skillman, E. D., & Haynes, M. P. 2004, AJ, 128, 121
- Vigroux et al. (1984) Vigroux, L., Souviron, J., & Vader, J. P. 1984, A&A, 139, L9