11email: ccappa@fcaglp.fcaglp.unlp.edu.ar 22institutetext: Instituto Argentino de Radioastronomía, C.C. 5, 1894 Villa Elisa, Argentina 33institutetext: Departamento de Astronomía, Universidad de Chile, Casilla 36-D, Santiago, Chile 44institutetext: Departamento de Física y Astronomía, Facultad de Ciencias, Universidad de Valparaíso, Chile
Unveiling the molecular environment of the ring nebula RCW 78
Abstract
Aims. We present a study of the ionized, neutral atomic, and molecular gas associated with the ring nebula RCW 78 around the WR star HD 117688 (= WR 55) with the aim of analyzing the distribution of the associated gas and investigating its energetics.
Methods. We based our study on 12CO(1-0) and 12CO(2-1) observations of the brightest section of the nebula carried out with the SEST telescope with angular resolutions of 45″ and 22″, respectively; and on complementary 12CO(1-0) data of a larger area obtained with the NANTEN telescope with an angular resolution of 27, Hi 21-cm line data taken from the ATCA survey, IRAS HIRES data, and radio continuum data at 4.85 GHz from the Parkes survey.
Results. We report the detection of molecular gas having velocities in the range –56 to –33 km s-1 associated with the western region of RCW 78. A few patches of molecular gas possibly linked to the eastern faint section are detected. The CO emission appears concentrated in a region of 23′18′ in size, with a total molecular mass of (1.30.5)105 M⊙, mainly connected to the western section. The analysis of the neutral atomic gas distribution reveals the H i envelope of the molecular cloud, while the radio continuum emission shows a ring-like structure, which is the radio counterpart of the optical nebula. The gas distribution is compatible with the western section of RCW 78 having originated in the photodissociation and ionization of the molecular gas by the UV photons of the WN7 star HD 117688, and with the action of the stellar winds of the WR star on the surrounding gas. In this scenario, the interstellar bubble expanded more easily towards the E than towards the W due to the lack of dense molecular gas in the eastern section. The proposed scenario also explains the off center location of WR 55. A number of infrared point sources classified as YSO candidates showed that stellar formation activity is present in the molecular gas linked to the nebula. The fact that the expansion of the bubble have triggered star formation in this region can not be discarded.
Key Words.:
ISM: bubbles – ISM: individual object: RCW 78 – stars: Wolf-Rayet – stars: individual: WR 551 Introduction
Interstellar bubbles created by the stellar winds of massive stars are generally detected as thermal radio continuum shells, as cavities and expanding shells in the Hi 21-cm line emission distribution, and as shells in the far infrared (see Cappa 2006 for a summary). Radio observations allowed to estimate the electron densities and ionized masses for a number of galactic ring nebulae and to identify their neutral gas counterparts.
The dense gas linked to these nebulae has been detected through molecular line observations. However, up to present, only a few cases have been analyzed. These observations revealed the existence of large amounts of molecular gas and that photodissociation regions at the interface between the ionized and molecular gas and shock fronts are present in interstellar bubbles (Cappa et al. 2001, Rizzo et al. 2003).
In the last years, infrared images obtained from the MSX Galactic Plane Survey (Price et al. 2001) and GLIMPSE survey (IRAC images, Benjamin et al. 2003) allowed to investigate the distribution of the near- and mid-infrared emission associated with interstellar bubbles, confirming that PDRs and shock fronts are common phenomena linked to these structures (Churchwell et al. 2006, Cyganowski et al. 2008, Watson et al. 2008, Watson et al. 2009).
Observational and theoretical studies, as well as numerical simulations, showed that only a small amount of the stellar wind energy released to the interstellar medium is converted into kinetic energy of the bubbles (see for example Chu et al. 1983, Oey 1996, Freyer et al. 2003, 2006, Cooper et al. 2004, Cappa 2006).
An important issue is the fact that the stellar formation process may be favoured in the compressed layers around the nebulae (Elmegreen 2000, Thompson et al. 2004). Using infrared point source catalogues, signs of stellar formation activity have been found in the dense molecular envelopes surrounding some interstellar bubbles (e.g. Cappa et al. 2005, Zavagno et al. 2007).
Thus, observations of molecular gas associated with interstellar bubbles provide information essential to investigate the energetics and stellar formation process in the dense surrounding shells.
Here we investigate the distribution of the molecular gas associated with the optical ring nebula RCW 78 around WR 55 based on high angular resolution SEST observations, complemented with lower resolution data of the NANTEN telescope. Complementary IR, H i 21-cm line, and radio continuum archival data allow the analysis of the distribution of the ionized and neutral atomic gas, and that of the dust. Our aims are to identify and characterize the material linked to the ring nebula and to study its kinematics and energetics.
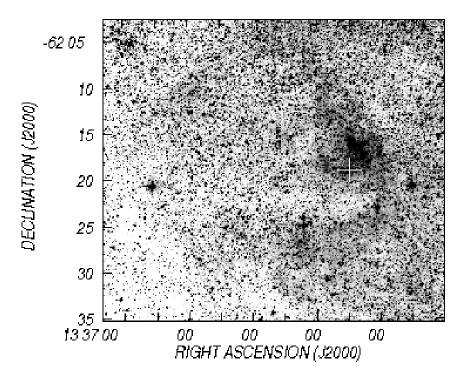
RCW 78 (= G 48b) is a ring nebula of about 35′ in diameter. The DSS-R image of the whole nebula is shown in Fig. 1, where the white cross marks the position of the WR star (see also figure 5 by Chu et al. 1983). The brightest part of RCW 78 is about 10′6′ in size and offset to the northwest of the star, while fainter regions are present to the northeast, east, and south (Chu & Treffers 1981, see also Heckathorn et al. 1982). Chu (1981) classified the optical nebula as Ra because of its low expansion velocity and the lack of evidence for a shell structure in the velocity pattern of the bright regions. This last characteristic is explained by Chu & Treffers as due to the fact that the stellar winds have existed during a short period of time.
The H study by Chu & Treffers (1981) showed that the velocity of the ionized material spans from –38 to –53 km s-1, varying from –44 km s-1 near the star to –53 km s-1 7′ north of it. Georgelin et al. (1988) found a similar velocity of –41.4 km s-1 based on H Fabry-Perot data. Chu & Treffers (1981) explained the observed velocity pattern, which does not correspond to that of an expanding shell, as the consequence of an outflow caused by the ionization of the surface of the molecular cloud by the central WR star. Georgelin et al. (1988) found an additional component in the H line profiles at –24 km s-1, most probably unrelated to the nebula.
Circular galactic rotation models (e.g. Brand & Blitz 1993) predict that gas with LSR velocities in the range –38 to –53 km s-1 is placed at kinematical distances of 3.5-7.0 kpc. In this section of the Galaxy, the mentioned velocities are close to that of the tangent point, i.e. –48 km s-1.
The study of the ionization structure by Esteban (1993) indicates that photoionization is the main source of excitation of the nebula, compatible with the clasification by Chu (1981).
The nebula is related to HD 117688 (= WR 55 = MR 49), a WN7 star located at (l,b) = (307∘48′,+0∘96) or = (13h33m30.1s, –62∘19′1.2″). Spectrophotometric distances were estimated by several authors: 4.0 kpc (Georgelin et al. 1988), 5.5 kpc (Conti & Vacca 1990), 6.0 kpc (van der Hucht 2001). New NIR calibrations of absolute magnitudes in the band by Crowther et al. (2006), indicate an absolute magnitude = –5.92 mag for WN7-9 weak lined stars. Taking into account the -value for WR 55 from the 2MASS catalogue (Cutri et al. 2003), and interstellar extinction values from Marshall et al. (2006), a distance in the range 4.5-5.0 kpc can be derived. Based on the available distance estimates, we will adopt a distance of 5.01.0 kpc for the WR star and its surrounding ring nebula.
The terminal wind velocity for WR 55 derived from the P Cyg profile of the CIV 1550 line is in the range = 1000 – 1200 km s-1 (Hamann et al. 1993, Rochowicz & Niedzielski 1995, Niedzielski & Skórzyński 2002). As regards the mass loss rate, Hamann et al. (1993) estimate Ṁ = –4.2 M⊙ yr-1.
In this paper, we present high angular resolution SEST observations performed in the 12CO(1-0) and 12CO(2-1) lines towards the brightest section of the nebula, complemented with lower angular resolution NANTEN data, H i 21-cm line data, radio continuum images, and infrared data of the whole region. In the next sections we describe the SEST data and analyze the distribution of the molecular, ionized, and neutral atomic emissions.
2 Data bases
2.1 CO data: observations and data reduction
The high resolution 12CO(1-0) (115 GHz) and 12CO(2-1) (230 GHz) data were obtained during two observing runs in 13-15 February 2002 and 20-21 March 2003, with the 15-m Swedish-European Submillimetre Telescope (SEST) at La Silla, Chile. The half-power beam-width of the telescope was 44″ and 22″ at 115 and 230 GHz, respectively. The data were acquired with the high resolution acousto-optical spectrometer, consisting of 1000 channels, with a total bandwidth of 100 MHz and a resolution of 40 KHz, corresponding to velocity resolutions of 0.105 km s-1 at 115 GHz [CO(1-0) line] and 0.052 km s-1 at 230 GHz [CO(2-1) line]. Calibration was done using the standard chopper technique. The system temperatures were 400 K at 230 GHz and 320 K at 115 GHz. Pointing was checked once during each observing run on the SiO (v=1, =21) maser source Ori A. Pointing errors were 3″. The uncertainty in the intensity calibration was 10%. Details about the telescope and receivers can be found in Booth et al. (1989). The observed velocity intervals ranged from –70 to –10 km s-1 at 230 GHz and from –90 to +10 km s-1 at 115 GHz.
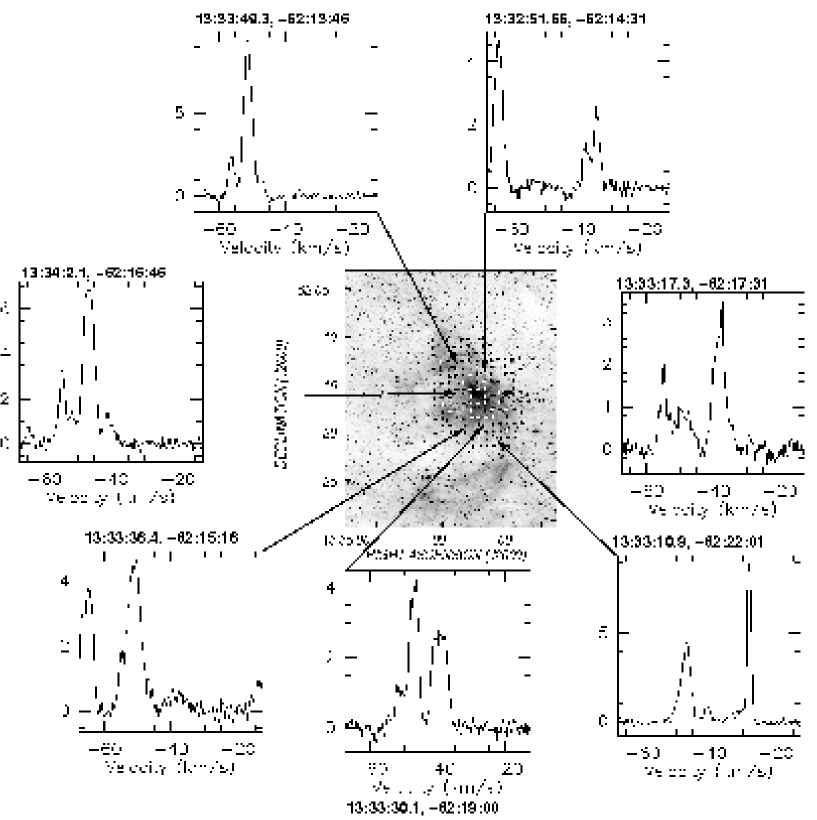
12CO(2-1) and 12CO(1-0) lines were acquired simultaneously in the position-switching mode on a grid with a spacing of 45″. The off-source position, at which no CO emission was detected, was placed at = (13h33m10.3s, –62∘2′ 41″). The 12CO observations were taken in the direction of 170 points towards the brighest section of the nebula and its environs. The observed positions are indicated by crosses in the SuperCOSMOS H image (Fig. 2).
Aditionally, simultaneous 13CO(2-1) and 13CO(1-0) observations were carried out towards = (13h33m10.7s, –62∘16′1″) and = (13h33m10.91s, –62∘13′46″), two positions with strong 12CO. The 13CO data were acquired using the same 1000 channel high resolution spectrometer. The velocity resolution was 0.116 km s-1 at 110 GHz and 0.058 km s-1 at 220GHz.
The spectra were reduced using the CLASS software (GILDAS working group)111htto://www.iram.fr/IRAMFR/PDB/class/class.html. A linear baseline fitting was applied to the data, except in a few profiles where an order 3 polinomial was used. After smoothing the 12CO profiles to a velocity resolution of 0.44 and 0.33 km s-1 at 115 and 230 GHz, respectively, the typical rms noise temperature was 0.22 K () at 230 GHz and 0.11 K at 115 GHz after an integration time of 3 min. The rms noise temperature of the 13CO(2-1) spectra was 0.20 K and 0.10 K for 13CO(1-0) after an integration time of 6 min. The spectra were smoothed to a velocity resolution of 0.46 km s-1 and 0.35 km s-1 at 110 GHz and 220 GHz, respectively.
The observed line intensities are expressed as main-beam brightness temperatures , by dividing the antenna temperature by the main-beam efficiency , equal to 0.72 and 0.57 at 115 and 230 GHz, respectively (Johansson et al. 1998).
12CO(2-1) and 12CO(1-0) data cubes were constructed within AIPS software, which was used to perform most of the analysis.
2.2 Complementary data
Intermediate angular resolution 12CO(1-0) data obtained with the 4-m NANTEN millimeter-wave telescope of Nagoya University corresponding to a region of 15 in size centered at = (13h35m, –62∘15′) were used to investigate the large scale distribution of the molecular gas in the environs of the whole RCW 78 nebula. The half-power beamwidth was 26. The 4K cooled SIS mixer receiver provided typical system temperatures of 220K (SSB) at this frecuency. The spectrometer was an acoustoptical spectrometer (AOS) with a velocity range of 100 km s-1 and a velocity reesolution of 0.1 km/s.
The ionized gas distribution was analyzed using data at 4.85 GHz, extracted from the Parkes-MIT-NRAO (PMN) Southern Radio Survey (Condon et al. 1993). This survey was obtained with an angular resolution of 42 and an rms noise of 10 mJy beam-1.
To investigate the neutral atomic gas distribution we extracted H i data from the Southern Galactic Plane Survey (SGPS) obtained with the Australia Telescope Compact Array (ATCA) and the Parkes radiotelescope. A Hanning smoothing was applied to these data to improve the signal to noise ratio. The final data cube has a synthesized beam of 2421, a velocity resolution of 1.64 km s-1, and an rms noise of 1.0 K. A description of this survey can be found in McClure-Griffiths et al. (2005).
The distribution of the IR emission was analyzed using high-resolution (HIRES) IRAS and MSX data obtained through IPAC222IPAC is funded by NASA as part of the IRAS extended mission under contract to Jet Propulsion Laboratory (JPL) and California Institute of Technology (Caltech).. The IR data in the IRAS bands at 60 and 100 m have angular resolutions of 11 and 19, respectively. The images in the MSX bands centered at 8.3, 12.1, 14.7, and 21.3 m have an angular resolution of 183. Images from the Spitzer mid-infrared data at 3.6, 4.5, 5.8, and 8.0 m were obtained from the Galactic Legacy Infrared Mid-Plane Survey Extraordinaire (GLIMPSE, Benjamin et al. 2003) and retrieved from the Spitzer Science Center333http://scs.spitzer.caltech.edu.
Finally, to search for stellar formation activity in the surroundings of WR55, we have inspected available IR point source catalogues: the MSX6C Infrared Point Source Catalogue (Egan et al. 1999) in Bands A (8.3 m ), C (12.1 m), D (14.7m), and E (21.3m); the IRAS Point Source Catalogue 4441986 IRAS catalogue of Point Sources, Version 2.0 (II/125) at 12, 25, 60, and 100m; and the IRAC point source catalogue, which includes photometry at 3.6, 4.5, 5.8, and 8.0 m.
3 The distribution of the molecular gas
3.1 Analysis of the SEST data
Figure 2 displays CO(2-1) profiles obtained towards different sections of the nebula to illustrate the molecular components detected towards RCW 78. Within the observed velocity range, the CO profiles show molecular gas within the velocity interval –67 to –20 km s-1. The main 12CO components were detected at about –65, –50, and –40 km s-1. Minor components detected in selected areas have velocities of around –55, –46, –35, and –28 km s-1.
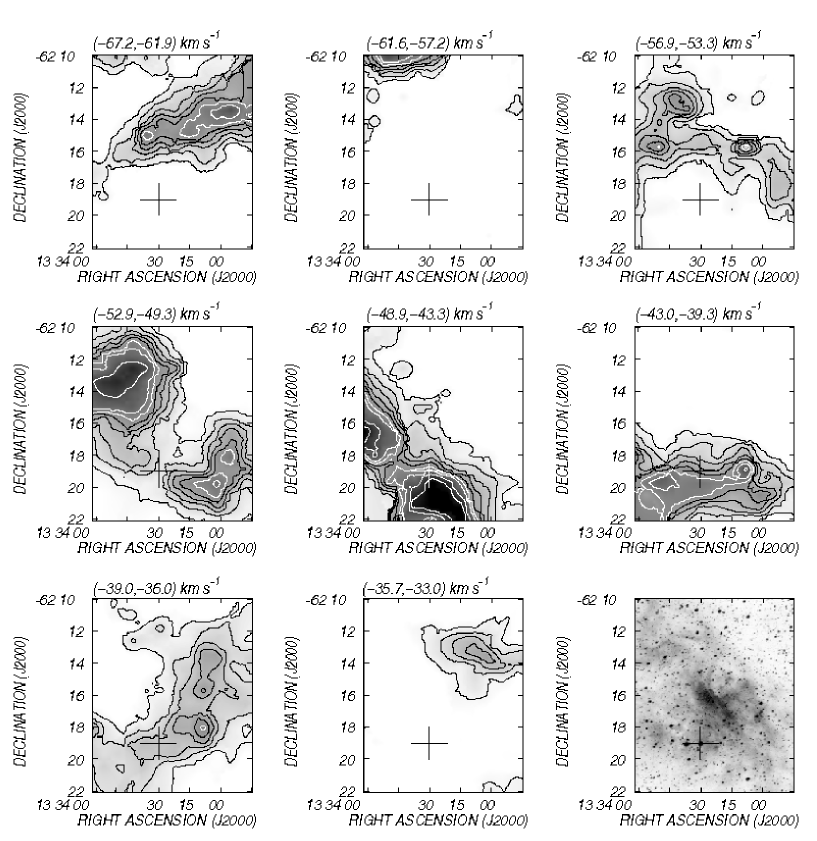
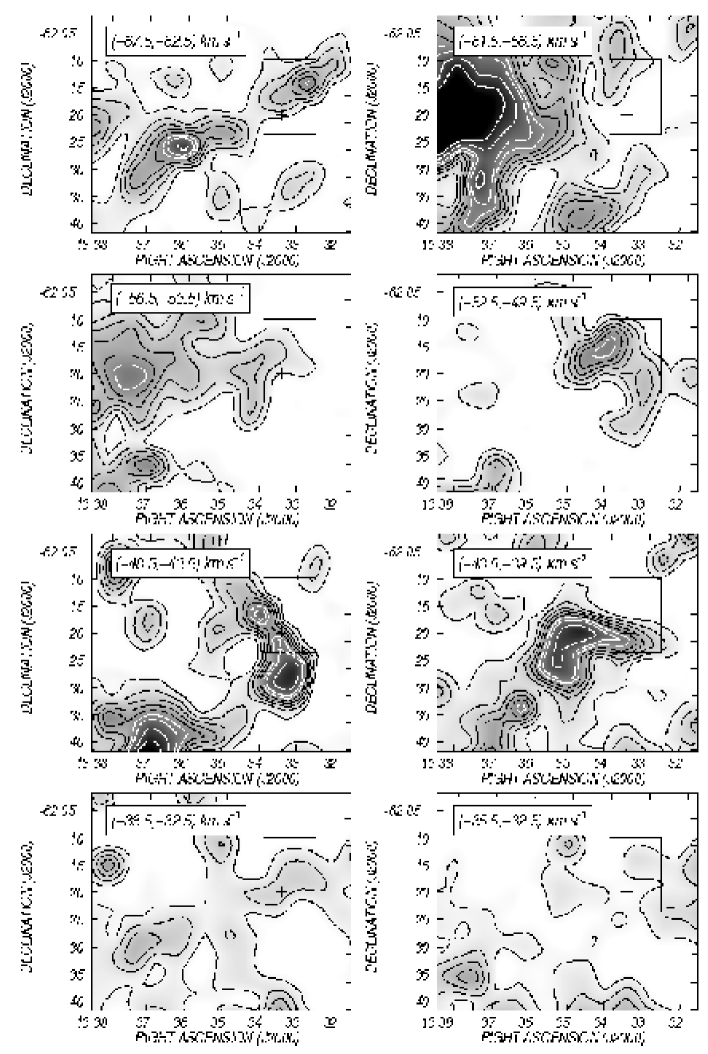
Figure 3 displays a series of images spanning the velocity range –67 to –33 km s-1 showing the distribution of the integrated emission of the CO(2-1) line within selected velocity intervals. The velocity intervals, which are indicated in the upper part of each image, were selected to emphasize the different CO velocity components. The bottom right panel shows the optical H image of the brightest section of the nebula. Components present at different velocities are described in the following paragraphs.
The CO emission distribution at velocities in the range –67.2 to –61.9 km s-1 shows an elongated cloud extending from E to W, beyond the surveyed area. Within the velocity interval from –61.6 to –57.2 km s-1, the emission is concentrated towards the higher declination section of the image.
Molecular gas within the range –56.9 to –53.3 presents three intense clumps at = (13h33m8s, –62∘15′45″), = (13h33m42s, –62∘13′45″), and = (13h33m48s, –62∘15′45″). A comparison with the optical image shows that the westernmost CO clump is located at the same position of a faint circular optical rim, suggesting that the borders of the CO clump are dissociated/ionized by the strong UV photon flux of the WR star. The CO emission is weak near the northern extreme of the brightest optical filament, whose W border is partially delineated by CO emission.
Gas in the interval from –52.9 to –49.3 km s-1 surrounds the brightest optical region all around but towards the NW. The CO emission is strong to the NE and SW.
Emission in the range –48.9 to –43.3 km s-1 surrounds the SE border of the brightest optical filament.
In the range –43.0 to –39.3 km s-1, the emission is parallel to Decl.(J2000) = –62∘20′. This CO cloud coincides with a dust lane clearly seen in the H image. Note that the intense CO clump at = (13h33m8s, –62∘19′) is projected right to the southwest border of the brightest optical filament.
The emission in the range –39.0 to –36.0 km s-1 partially borders the W section of the brightest part of the nebula. The molecular emission at these velocities is also coincident with regions of strong absorption.
Finally, the image corresponding to the interval –35.7 to –33.0 km s-1 displays a cloudlet also coincident with the region of optical absorption to the northwest of the nebula.
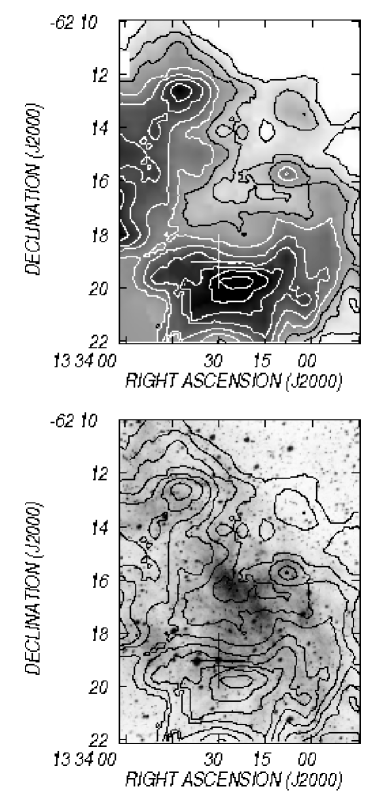
The CO emission distribution in the whole velocity range and its comparison with the ionized gas indicates that the molecular material detected from –57 to –33 km s-1 is very probably associated with the nebula. We believe that CO emission present in the velocity range –67.2 to –61.9 km s-1, which extends beyond the surveyed area and appears well separated in velocity from gas at v –57 km s-1, is unrelated to the nebula. Fig. 4 shows the CO(2-1) integrated emission within the velocity range –57 to –33 km s-1 in grayscale and contours and an overlay with the SuperCOSMOS image for comparison. Clearly, the molecular gas emission is enhanced in the environs of the brightest region of RCW 78, encircling it all around. The comparison of the CO and optical emission distributions indicates that the nebula is interacting with molecular gas.
An inspection of table 2 by Chu & Treffers (1981) shows that the velocities of the molecular gas are similar to those of the ionized gas: larger negative CO and H velocities are present to the N of the WR star, while lower negative CO and H velocities are detected close and S of the star. The similar CO and H ii velocities reinforces the association of the ionized and molecular gas.
3.2 Analysis of the NANTEN data
Figure 5 displays the distribution of the molecular gas in a larger area using data from NANTEN. The velocity range of each image has been selected to facilitate the comparison with the SEST images (Fig. 3). The rectangle indicates the area observed with SEST. In the following paragraphs we describe the NANTEN images, focussing first on the area observed with the SEST telescope, and then, extending the analysis to a larger area.
The image corresponding to the velocity range –67.5 to –62.5 km s-1 shows an elongated CO cloud partially coincident with the brightest part of the nebula. The emission distribution indicates that this cloud is an extension of a larger one, which is present to the southeast of the WR star.
The emission in the intervals –61.5 to –56.5 km s-1 and –56.5 to –53.5 km s-1 shows little correlation with the optical emission.
The molecular emission in the range –52.5 to –49.5 km s-1 shows a CO arc-like structure which is almost coincident with the optical emission at 13h35m. The intense CO clump centered at = (13h34m, –62∘15′) delineates the NE section of the brightest part of the nebula, while a fainter clump is detected to the SW ( = (13h33m10s, –62∘21′). Both clumps, as well as the fainter CO emission region in between are easily identified in the SEST images. This material is very probably related to RCW 78.
The emission within the range –48.5, –43.5 km s-1 displays a CO feature running from = (13h35m, –62∘10′) to (13h33m, –62∘32′). The emission coincides with bright portions of the nebula and is shifted slightly towards the SW in comparison with the emission in the previous image. This characteristic is also observed in the image corresponding to the SEST data.
An elongated CO structure having velocities in the range –43.5 to –39.5 km s-1, present at = (13h34m, –62∘20′) appears projected onto a dust lane present at Decl. = –62∘22′. The molecular emission extends towards the south at R.A.(J2000) = 13h35m.
The CO emission is weak for velocities more positive than –38.5 km s-1. Within the range –38.5 to –35.5 km s-1, a CO cloud is projected onto the nebula. The emission distribution changes for v –35.5 km s-1, where the CO emission coincides with regions showing faint optical emission.
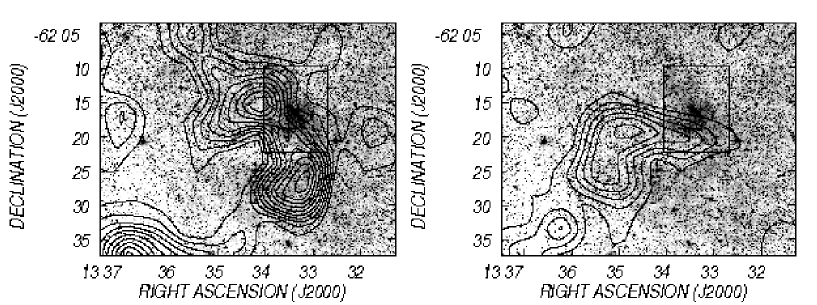
In summary, the bulk of the molecular emission is concentrated in two structures having velocities in the range –52.5 to –43.5 km s-1 and –43.5 to –39.5 km s-1, coincident with the velocities of the H line (Chu & Treffers 1981). Overlays of both features with the optical emission are presented in Fig. 6.
Based on morphological and kinematical evidences we can conclude that the arc-like structure having velocities in the range –52.5 to –43.5 km s-1 is clearly associated with RCW 78 (Fig. 6, left panel). As regards the feature with velocities from –43.5 to –39.5 km s-1 (Fig. 6, right panel), its velocity is also coincident with those of the ionized gas, suggesting a relation to the nebula. On the contrary, material having velocities lower than –57 km s-1 does not seem to be related to the nebula.
CO emission linked to the eastern section of the nebula (near 13h36m) is difficult to identify. Molecular gas related to the eastern section is probably present in the range –43.5 to –38.5 km s-1 at = (13h36m, –62∘5′) and at = (13h37m, –62∘17′). However, the CO emission is weak, suggesting that the amount of molecular gas associated with this region is small as compared with the western regions.
Both the SEST and NANTEN data in the environs of the western section of RCW 78 are consistent with a scenario in which the ionized gas originated through photodissociation and ionization of the parental molecular cloud. The lack of dense gas towards the east has probably favored the expansion of the ionized gas in this direction.
Adopting a mean radial velocity of around –45 km s-1, circular galactic rotation models (e.g. Brand & Blitz 1993) predict near and far kinematical distances of 4.2 and 6.4 kpc, respectively, in agreement with the spectrophotometric distance of WR 55.
4 The associated ionized and neutral atomic gas
4.1 Ionized gas distribution
The upper panel of Fig. 7 displays the radio continuum image at 4.85 GHz in contours and grayscale. The location of the WR star is marked by the cross. The overlay of the optical and radio images shows that RCW 78 is detected at this frequency. The brightest section of the nebula coincides with one of the most intense radio continuum regions.
The brightest part of RCW 78 at = (13h33m30s, –62∘17′) coincides with the brightest radio emission region. The comparison with the CO emission distribution shows that the intense radio emitting region is interacting with molecular material.

The radio continuum emission areas at = (13h34m50s, –62∘27′) and = (13h36m30s, –62∘15′) coincide with fainter optical emission regions. The region at = (13h33m40s, –62∘22′), which lacks strong radio continuum emission, coincides with molecular gas having velocities in the range –43.5 to –39.5 km s-1 (see Figs. 2 and 4).
The strong radio emission region at = (13h37m15s, –62∘27′), which is projected onto a region of strong absorption bordering faint optical areas belonging to RCW 78, is very probably unrelated.
The ring appearance of the radio continuum emission, which resembles the H emission distribution, is suggestive of the action of the stellar winds of massive stars on the surrounding gas, which shaped an interstellar bubble. The ionized gas has probably expanded more easily towards the E than towards the W due to the lack of dense gas molecular gas in the eastern section. The proposed scenario also explains the off center location of WR 55.
4.2 H i gas distribution
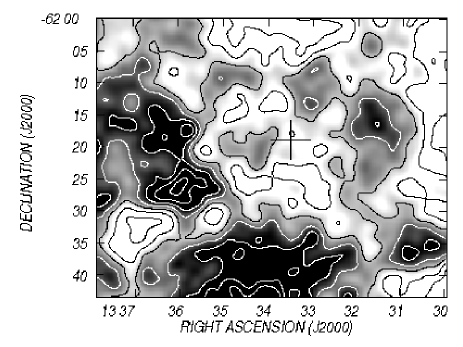
The H i gas emission distribution in the range –55 to –25 km s-1 is complex and clumpy, with few clear structures. Figure 8 displays the H i emission distribution within the velocity interval from –50 to –40 km s-1 towards RCW 78.
The region of low H i emission centered at = (13h33m50s, –62∘23′) coincides with the western section of the nebula (shown in Fig. 1) and with CO emission having velocities in the range –52.5 to –39.5 km s-1 (see Fig. 5), suggesting that most of the neutral gas in this region is H2. In this scenario, part of the neutral atomic gas encircling the depression might correspond to the envelope of the molecular cloud.
4.3 Far IR emission
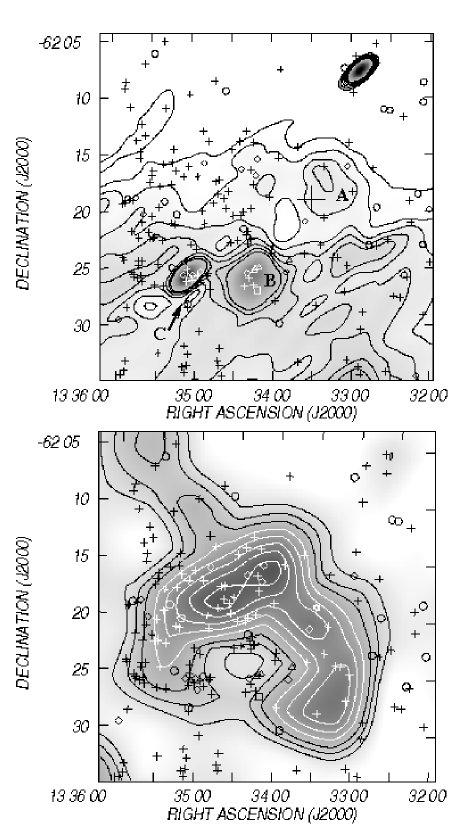
The HIRES IRAS image at 60 m is shown in the upper panel of Fig. 9. The source at = (13h33m20s, –62∘17′) coincides with the brightest section of RCW 78, indicating the presence of dust mixed with the ionized gas. We will refer to this source as source A.
The region at Decl. = –62∘26′, from R.A. = 13h32m30s to 13h36m, which depicts relatively strong far IR emission, coincides with an area showing optical emission. Two bright extended IR sources can be identified: one at = (13h34m15s, –62∘26′) (from here on referred to as source B), and the other at = (13h35m10s, –62∘26′) (source C). The sparcely populated open cluster C1331-622 and the star HD 117797 ( = 13h34m12.0s, –62∘25′18, O8Ib(f), Walborn 1982) are projected onto the line of sight to source B. C1331-622 is an open cluster of A and F-type stars placed at 820 pc, while the estimated distance for the O-type star is 3.9 kpc (Turner & Forbes 2005).
Based on the IR fluxes at 60 and 100 m, and following the procedure described by Cichowolski et al. (2001), we derived the dust color temperature for sources A, B, and C. Dust color temperatures are = 297 K, 447 K, and 486 K for sources A, B, and C, respectively. The range of temperatures for each source corresponds to = 1-2 and to different IR background emissions. The parameter is related to the dust absorption efficiency (). The dust temperature derived for the far IR source related to the brightest region of RCW 78 (source A) is typical of H ii regions. Estimates for sources B and C are clearly higher, probably revealing the presence of inner heating sources.
The IRAC image at 8 m displays very faint extended emission towards the brightest section of RCW 78 (coincident with the IR source A), without identifiable structures. The emission in this band towards IR sources B and C shows some weak small scale features which are difficult to characterize without high angular resolution molecular line data. The emission in MSX Band E (at 21.3 m) shows a region of emission of about 2′ in size, centered at = (13h34m13s, –62∘25′), approximately coincident with source B. Band E includes continuum emission from very small grains, which can survive inside ionized regions (cf. Deharveng et al. 2005 and references there in), and a contribution from nebular emission lines.
5 Stellar formation
To look for stellar formation activity in the surroundings of WR 55, we have inspected three different infrared point source catalogues: Spitzer, MSX, and IRAS. The study consisted of identifying candidates to Young Stellar Objects (YSOs) associated with the molecular gas in RCW 78. An area of 30′30′ in size centered at = (13h34m, –62∘20′) was examined.
To identify YSO candidates in the IRAS and MSX catalogues, we followed the criteria by Junkes et al. (1992) and Lumsden et al. (2002), respectively.
A total number of 20 IRAS point sources were found projected onto the analyzed region. Eight out of the 20 sources have IR fluxes compatible with protostellar objects, and only 1 of them is projected onto the molecular gas related to the nebula.
Lumsden et al. (2002)’s conditions were used for MSX sources. The selection of candidates was performed taking into account their loci in the (F21/F8, F14/F12) diagram. Their criteria allow identification of candidates to massive young stellar objects (MYSOs) and compact H ii regions (CHII). A total of 16 MSX sources are projected onto the whole region. Two sources classified as CHII and 2 MYSO candidates are seen projected onto the molecular material associated with RCW 78.
To search for YSO candidates, we also analyzed the mid-infrared emission of point sources using Spitzer IRAC photometry. This data base provides excellent tools for identifying and classifying YSO candidates as Class I and II. We investigated the infrared excess by measuring the infrared spectral index (= ) (see Lada 1987, Stahler & Palla 2005, Chavarria et al. 2008, Koenig et al. 2008).
Within the selected region, we found 5860 sources with detections in the 6 bands ( ans , from the 2MASS catalog, and the four IRAC bands). To deredden the magnitudes, we estimated the extinction using the 2MASS colors in areas of about 2′ in size following the method described by Lada et al. (1994). The extinction laws are from Rieke & Lebofsky (1985) and Flaherty et al. (2007) for the 2MASS and IRAC bands, respectively.
To select young candidates, we took into account sources having spectral index in the range –1.5 to +2 for each pair of IRAC wavelengths. Starburst galaxies and active galactic nuclei were removed from the sample by using the color-color diagram [3.6]-[4.5] vs. [4.5]-[8.0] from Simon et al. (2007). We applied a second selection criterium to the remaining sources, taking into account sources with 0.4, following Koenig et al. (2008). After inspecting visually the SEDs of the remaining sources, we were left with 193 YSO candidates. Note that two selection criteria were applied. This procedure is a bit strict and we are aware that a number of YSO candidates have probably been rejected. However, selected sources are more confident candidates.
Finally, we used the IR spectral index to discriminate Class I sources (0 +2) from the more evolved Class II sources (–1.5 0). Sources with a nearly flat IR spectral distribution ( 0) were named Class I-II.
The distribution of the YSO candidates identified using the IRAS, MSX, and Spitzer data bases is shown in Fig. 9, overlaid onto the 60 m and the CO emissions. Note that the CO emission shown in the figure includes molecular gas at two different velocities (from –56.5 to –43.5 km s-1, and from –43.5 to –39.5 km s-1). The symbols used in the figures have the following meaning: the open square marks the position of the IRAS point source, open circles indicate Class I objects; small crosses, Class II objects, diamonds Class I-II objects, and open triangles correspond to CHII and MYSOs.
The spatial distribution of the candidates is not uniform. About 120 sources are projected onto the molecular gas, mainly concentrated towards R.A.(J2000) 13h34m. A relatively large number of YSO candidates are projected bordering the low CO emission region centered at about = (13h34m30s, –62∘25′). Two areas in this region are particularly interesting: one at = (13h34m15s, –62∘25′) and the other at = (13h35m, –62∘26′), which include 22 sources. These sources are listed in Table 1. Their main parameters (coordinates, fluxes) as well as an indication of the nature of the sources are included in Table 1.
The upper panel of Fig. 9 shows that both groups of YSO candidates coincide with the IR extended emission regions named B and C (see Sect. 4.3). The MSX sources #2, #4, and #5, the Spitzer sources #6, #7, #8, and #9 match the location of the IR source B. In particular, MSX sources #2 and #4 approximately coincide in position with the extended source detected in Band E and with the O8Ib(f) star HD 117797. The presence of this bunch of point sources suggests the existence of an active star forming region. The region of extended emission in Band E, which is most probably related to a compact H ii region in this direction, reinforces this suggestion. Note that the O8Ib(f) star HD 117797 is projected onto the borders of the bright sections of the molecular clouds, indicating that the dense material has probably been dissociated by the UV photons of this massive star.
The position of MSX point source #3 and the Spitzer sources #10 to #22 coincide with the extended IR source B (at = (13h35m15s, –62∘26′), indicating the detection of an additional stellar forming region. The source IRAS13316-6210 ( = (13h35m2s, –62∘25′30″), whose IRAS fluxes do not match Junkes et al.’s criteria, is also coincident with this region.
In Figure 10 we plot the dereddened color-magnitude diagram for the YSO candidates detected using Spitzer database, which appear related to the IR sources B and C, i.e. those listed in Table 1. A distance of 5 kpc was assumed. We compare the position of the YSO candidates with the main sequence stars from B3V to O3V, and with an isochrone calculated by Siess et al. (2000) corresponding to an age of 1 Myr (dot line). The Ks-limit of our sample is about 14 mag, which corresponds to a limit in the absolute magnitude of KS of about 0.5 mag and to pre-main sequence stars with masses larger than about 2.2 M⊙ in the Siess et al.’s model. This diagram suggests that the YSOs candidates in both selected regions have masses larger than this last value. Note, however, that as their luminosity originates both in the central object and in the circumstellar material, the effective mass of the candidates may be lower than estimated (Comeron et al. 2005).
Sub-millimetre continuum observations would be useful to confirm the nature of the YSO candidates.

| [] | [] | IRAS source | Fluxes[Jy] | Class. | ||||||
| 12m | 25m | 60m | 100m | |||||||
| 1 | 13 34 11.4 | –62 27 03 | 13307-6211 | 0.8 | 2.0 | 20.5 | 85.4 | YSO/Class 0 | ||
| [] | [] | MSX source | Fluxes[Jy] | |||||||
| 8m | 12m | 14m | 21m | Class. | ||||||
| 2 | 13 34 13.0 | –62 25 07 | G307.8603+00.0439 | 0.2261 | 1.809 | 1.118 | 1.391 | CH ii, HD 117797 | ||
| 3 | 13 35 03.6 | –62 25 77 | G307.9563+00.0163 | 0.7808 | 0.7287 | 0.5542 | 3.093 | CH ii | ||
| 4 | 13 34 10.2 | –62 25 00 | G307.8561+00.0463 | 0.2149 | 1.144 | 2.191 | 4.793 | MYSO, HD 117797 | ||
| 5 | 13 34 13.8 | –62 25 29 | G307.8620+00.0399 | 0.1614 | 1.146 | 1.726 | 4.996 | MYSO | ||
| [] | [] | GLIMPSE source | Fluxes[mag] | |||||||
| Class. | ||||||||||
| 6 | 13 34 14.4384 | -62 26.5794 | G307.8597+00.0185 | 13.244 | 11.95 | 11.237 | 11.137 | 10.873 | 10.895 | II |
| 7 | 13 34 17.9136 | -62 25.9506 | G307.8680+00.0277 | 12.459 | 11.257 | 10.338 | 10.419 | 10.242 | 10.243 | II |
| 8 | 13 34 19.4304 | -62 25.506 | G307.8721+00.0345 | 11.202 | 9.599 | 7.489 | 7.385 | 6.928 | 6.641 | I-II |
| 9 | 13 34 21.564 | -62 26.6934 | G307.8729+00.0143 | 13.959 | 12.913 | 12.267 | 12.144 | 12.116 | 11.853 | II |
| 10 | 13 34 47.6856 | -62 26.9472 | G307.9219+00.0018 | 13.37 | 12.553 | 11.859 | 11.738 | 11.713 | 11.68 | II |
| 11 | 13 34 48.9096 | -62 25.4874 | G307.9283+00.0254 | 14.267 | 12.681 | 11.796 | 11.655 | 11.204 | 11.654 | II |
| 12 | 13 34 50.1048 | -62 25.6944 | G307.9300+00.0216 | 13.767 | 12.546 | 11.785 | 11.7 | 11.347 | 11.414 | II |
| 13 | 13 34 54.0384 | -62 26.2866 | G307.9358+00.0106 | 12.596 | 11.773 | 11.018 | 10.92 | 10.938 | 10.933 | II |
| 14 | 13 34 54.8448 | -62 25.3746 | G307.9399+00.0253 | 13.319 | 12.117 | 11.293 | 11.152 | 10.792 | 10.611 | I-II |
| 15 | 13 34 56.6544 | -62 25.7538 | G307.9422+00.0185 | 14.487 | 12.589 | 11.331 | 10.94 | 10.732 | 10.827 | II |
| 16 | 13 34 58.644 | -62 26.6052 | G307.9436+00.0039 | 13.376 | 12.672 | 12.142 | 11.819 | 11.508 | 11.403 | I-II |
| 17 | 13 35 0.6672 | -62 25.641 | G307.9502+00.0190 | 11.013 | 9.211 | 8.089 | 7.925 | 7.462 | 7.366 | I-II |
| 18 | 13 35 0.8784 | -62 26.061 | G307.9494+00.0121 | 13.54 | 12.424 | 11.79 | 11.598 | 11.264 | 11.535 | II |
| 19 | 13 35 4.7112 | -62 25.1676 | G307.9592+00.0255 | 13.87 | 12.348 | 11.382 | 11.22 | 10.892 | 10.994 | II |
| 20 | 13 35 5.0928 | -62 24.3822 | G307.9621+00.0383 | 14.298 | 13.186 | 12.453 | 12.352 | 12.217 | 12.064 | II |
| 21 | 13 35 5.5032 | -62 26.2302 | G307.9577+00.0078 | 12.143 | 10.783 | 9.836 | 9.826 | 9.511 | 9.568 | II |
| 22 | 13 35 7.9968 | -62 25.6524 | G307.9641+00.0165 | 14.241 | 12.207 | 10.879 | 10.721 | 10.298 | 10.135 | I-II |
6 Discussion
6.1 Parameters of the gas
The distribution of the molecular gas and its comparison with that of the ionized gas indicates that the CO emission detected in the range –56 to –33 is probably related to the nebula. We note that Georgelin et al. (1988) proposed that the dust lane at Decl. = –62∘22′ is unconnected to RCW 78. However, the velocity of the molecular emission in this region, which coincides with the velocity of the ionized gas casts doubts on this interpretation. Although we can not discard Georgelin et al.’s interpretation, we believe that gas in the velocity interval mentioned above is linked to the nebula.
The mean column density , the CO luminosity , the molecular mass and a rough volume density were derived separately for the molecular gas related to RCW 78 from the SEST and NANTEN data. The last data give more reliable values since the whole molecular cloud is included. Mean column densities were derived from 12CO(1-0) data, by making use of the empirical relation between the integrated emission (= and . We adopted = 2.3 1020 cm-2 (K km s-1)-1 (Strong et al. 1988). The CO luminosities are defined as = (K km s-1 pc2), where is the area in pc2. The mass includes a Helium abundance of 10%.
From SEST data we obtained = 7.7 1021 cm-2. Adopting = 51 kpc, = (5.92.2) 103 (K km s-1 pc2) and = (3.01.2)104 M⊙. The volume density 750130 cm-3 was estimated by distributing the molecular material within a region of 51 in radius (7.4 pc at 5.0 kpc). The corresponding values derived from the NANTEN data are: = 6.6 1021 cm-2, = (2.71.0) 104 (K km s-1 pc2) and = (1.30.5) 105 M⊙. A volume density 27060 cm-3 was estimated by distributing the molecular material within a region of 118 in radius.

Optical depths were derived for two positions for which 13CO profiles were obtained, assuming that the emission fills completely the SEST beam. The 12CO and 13CO profiles corresponding to one of these positions are shown in Fig. 10. The parameters of the gaussian fitting to the CO components (peak temperatures Tp, central velocities VCO, velocity width V), and the integrated emission are listed in Table 2.
The peak optical depth of the 13CO(2-1) lines were estimated from the peak values as (13CO[2-1]) CO[2-1])/[10.58 – 0.21]}, where . Excitation temperatures were derived from the 12CO(2-1) line assuming LTE and that 12CO(2-1) is optically thick. Peak optical depths of the 12CO lines were obtained as (12CO) = [ [12CO]/[13CO] (13CO); where is the frequency of each transition, is the FWHM of the observed line and [12CO]/[13CO] = 70 is the isotope ratio (Langer & Penzias 1990). in these regions are about 5-10 K, while optical depths (12CO) 9-24.
| Spectrum | Tp | VCO | V | |
| [K] | [km s-1] | [km s-1] | [K km s-1] | |
| 12CO(1-0) | 5.3 | –64.1 | 3.3 | 18.5 |
| 0.5 | –52.0 | 2.5 | 1.3 | |
| 5.2 | –38.1 | 1.0 | 5.9 | |
| 6.7 | –34.7 | 3.3 | 23.3 | |
| 12CO(2-1) | 3.8 | –64.0 | 3.6 | 13.7 |
| 0.9 | –56.5 | 2.1 | 1.9 | |
| 3.9 | –38.2 | 1.0 | 3.9 | |
| 4.8 | –35.0 | 3.6 | 17.7 | |
| 13CO(1-0) | 1.7 | –64.3 | 2.5 | 4.4 |
| 1.4 | –38.0 | 1.0 | 1.4 | |
| 1.5 | –34.7 | 2.9 | 4.6 | |
| 13CO(2-1) | 0.9 | –63.9 | 2.6 | 2.6 |
| 0.8 | –38.1 | 0.7 | 0.6 | |
| 0.9 | –35.1 | 2.2 | 2.2 |
The intensity ratios for the different molecular components present in the two positions vary from 4.2 to 5.0 for the CO(1-0) lines and from 5.3 to 8.1 for the CO(2-1) lines. These ratios are similar to that found in Galactic molecular clouds (Castets et al. 1990).
The CO(2-1)/CO(1-0) ratios can give us information on the physical conditions of the gas. This ratio is more sensitive to gas density than kinetic temperature (Radford et al. 1991). We are aware, however, that these lines are optically thick. In order to extract the physical conditions of the observed area one can use the LVG approximation (Castets et al. 1990). To determine the 12CO(2-1)/12CO(1-0) ratio, we convolve the CO(2-1) spectrum to the CO(1-0) resolution. The ratios obtained range between 0.6 to 0.8 and are consistent with low ratio gas (LRG), usually subthermally excited, with kinetic temperatures of about 10K and densities n 1103 cm-3. Ratios of about 1 to 1.2 imply kinetic temperatures of about 20K or larger, and densities n 1103 cm-3, which are not found (Sakamoto et al. 1994, Sakamoto et al. 1997).
The parameters of the ionized gas can be estimated from the radio continuum image. A flux density = 2.8 Jy was derived from the image at 5 GHz. Adopting an electron temperature of 9000 K, the rms electron density obtained from the expressions by Mezger & Henderson (1967) is in the range 4-9 cm-3. To estimate this value we have assumed a spherical H ii region with constant electron density. A rough estimate of the filling factor can be obtained by taking into account the larger electron density derived from line ratios ( 100 cm-3, Esteban et al. 1990) or the shell parameters around RCW 78. From the former method, we obtained a filling factor = 0.3. Adopting an outer radius = 15′ = 22 pc (at 5.0 kpc) and a inner radius = 10′ = 15 pc (at 5.0 kpc), and assuming that 50% of the surface of the H ii region is covered by plasma, = 0.4. The electron density and ionized mass for = 0.3-0.4 are in the range 6-15 cm-3 and (3-5)103 M⊙, respectively. The presence of He ii was considered by multiplying the H ii mass by 1.27. For the adopted distance uncertainty, the error in the ionized mass is about 40%.
The number of UV photons necessary to ionize the gas = 49.3. The comparison with the UV photon flux emitted by a WN7 is = 49.4 (Crowther 2007), suggesting that the WR star can maintain the gas in RCW 78 ionized.
6.2 Energetics
The dynamical age of a wind blown bubble can be estimated as = 0.5610 yr (McCray 1983), where is the radius of the bubble (pc), is the expansion velocity (km s-1), and the coefficient is the deceleration parameter. The constant is a mean value between the energy and the momentum conserving cases. Adopting = 22 pc and assuming a rather low value of 5 km s-1 for the expansion velocity (since no signs of expansion were found from optical and radio data), = 2.4106 yr, suggesting that the O-type star progenitor of the WR star has contributed in shaping the bubble.
The comparison of the stellar wind mechanical energy ) released by WR 55 and the kinetic energy of the interstellar bubble = allow to investigate if the stellar winds are capable of blowing the bubble.
To estimate we adopt a conservative mass loss rate (1-3)10-5 M⊙ yr-1 (Nugis & Lamers 2000, Cappa et al. 2004), a terminal wind velocity = 1100 km s-1 (see sect. 1), and a dynamical age = 5105 yr, compatible with the duration of the WR phase. The contribution of the O-type phase of the star was estimated adopting mean values = 210-6 M⊙ yr-1, = 1500 km s-1 (Prinja et al. 1990; Lamers & Leitherer 1993), and that the stellar wind acted during at least 2106 yr. The wind mechanical energy released during the WR phase of the star is in the range (0.6-1.8)1050 erg, while for the O-star phase a value 0.91050 erg is derived. The total energy released through stellar winds is in the range (1.5-2.7)1050 erg.
To estimate the kinetic energy of the interstellar bubble we take into account the molecular mass alone since it is two orders of magnitude larger than the ionized mass. For the adopted expansion velocity, we obtained = 0.31050 erg. The comparison between the kinetic energy of the nebula and the mechanical energy of the stellar wind is compatible with a interstellar bubble interpretation.
6.3 Star formation process
The presence of star formation activity in the environs of the nebula suggests that it may have been triggered by the expansion of the bubble. Indeed, active star forming regions are present at the periphery of many H ii regions, where stellar fomation activity is triggered by the expansion of H ii regions through the “collect and collapse” or the Radiative Driven Implosion models (e.g. Deharveng et al. 2005 and references there in).
The ”collect and collapse” model indicates that expanding nebulae create compressed layers where gas and dust are piled-up between the ionization and the shock front. This dense layer fragments forming molecular cores where new stars born. Whitworth et al. (1994) developed an analytical model useful to characterize the dense fragments in different scenarios. For the case of stellar wind bubbles, the model predicts the time at which the fragmentation occurs , the size of the bubble at that moment , the mass of the fragments , and their separation along the compressed layer . The parameters required to derive these quantities are the mechanical luminosity of the wind , the ambient density of the surrounding medium into which the bubble expands n0, and the isothermal sound speed in the shocked gas , which is supposed to be constant.
The analytical expressions derived by Whitworth et al. are:
| (1) |
| (2) |
| (3) |
| (4) |
where is equal to in units of 0.2 km s-1, is the ambient density in units of 1000 cm-3, and is in units of 1037 erg s-1. is an important factor to derive the parameters, while has a lower contribution, and the dependence with is weak.
Taking into account the stellar wind parameters corresponding to the main sequence and WR phases of WR 55, and using the time during which the wind acted, we estimated = (0.20-0.35). Adopting = 300 cm-3and as = 0.2 km s-1, we obtained 1.4106 yr, = 15 pc, = 15 M⊙, and = 0.25 pc.
For this interstellar bubble, the radius = 22 pc and the dynamical age = 2.4 yr (see Sect. 6.1), and, consequently, and , suggesting that the bubble is old enough for massive molecular fragments to form. Submillimetre continuum data may help to detect these fragments.
Pieces of evidence for the “collect and collapse” process are the presence of a dense shell surrounding the ionized region and star formation activity at the periphery of the ionized gas. The SEST data revealed that molecular gas surrounds the brightest section of the nebula (see Sect. 3.2). However, neither signs of strong gas compression nor star formation activity are detected at the periphery of this section of the nebula, as is the case in some H ii regions (e.g. Zavagno et al. 2006, Deharveng et al. 2008). The NANTEN data showed that most of the molecular material appears projected onto the nebula (see Sect. 3.3). Although clear evidence of star formation activity seems to be related to this material, the face-on geometry conspires against finding observational evidence in favor of the “collect and collapse” process.
Stellar formation can also be triggered through the ”Radiation-Driven Implosion” (RDI) model, theorically developed by Lefloch & Lazareff (1994). Pillars or elephant trumps and cometary globules are observational evidences of this process (e.g. Thompson et al. 2004, Urquhart et al. 2007). An inspection of the SuperCOSMOS H does not allow to identify these objects. The image at 8 m suggests that this kind of objects might be present. High resolution molecular line observations are needed to investigate the nature of these small features.
Presently, none of the two processes can be discarded to explain the stellar formation activity in the environs of RCW 78.
7 Conclusions
We have investigated the distribution of the molecular gas related to the ring nebula RCW 78 around the WR star HD 117688 based on observations of 12CO(1-0) and 12CO(2-1) lines obtained using the SEST. Complementary molecular data from the NANTEN survey, H i data from the SGPS, and IRAS and radio continuum images were also analyzed.
The analysis of the SEST and NANTEN CO data reveals the existence of molecular gas having velocities in the range –56 to –33 km s-1 interacting with the western section of the nebula. The bulk of the emission is concentrated in two structures having velocities in the range –52.5 to –43.5 km s-1 and –43.5 to –39.5 km s-1, coincident with the velocities of the H line. Based on morphological and kinematical evidences we conclude that the arc-like structure having velocities in the range –52.5 to –43.5 km s-1 is clearly associated with RCW 78. The feature with velocities from –43.5 to –39.5 km s-1 is most probably related to the nebula. On the contrary, CO emission linked to the eastern section of the nebula is difficult to identify.
The radio continuum emission distribution at 4.85 GHz shows a shell-like feature, which resembles the H emission distribution.
The H i emission distribution shows a low emission region coincident in position with molecular gas with similar velocities, suggesting that most of the neutral gas in this region is H2. In this scenario, part of the neutral atomic gas encircling the depression might correspond to the envelope of the molecular cloud.
The distribution of the molecular and ionized gas is compatible with a scenario in which the ionized gas originated through photodissociation and ionization of the parental molecular cloud. The shell-like appearance of the ionized gas is suggestive of the action of the stellar winds, which swept-up the surrounding gas shaping an interstellar bubble. The lack of dense gas towards the east favored the expansion of the nebula in this direction. The proposed scenario also explains the off center location of WR 55.
As regards stellar formation activity towards RCW 78, the analysis of the IRAS, MSX, and Spitzer point source catalogues revealed the existence of two active star forming regions liked to the molecular gas associated to the nebula. The influence of the expansion of RCW 78 in the onset of star formation in these regions can not be discarded.
The comparison between the wind mechanical energy released by WR 55 and its massive progenitor and the kinetic energy of the interstellar bubble indicates that the stellar wind of this star is capable of blowing the interstellar bubble. Thus, WR 55 is not only responsible for the ionization of the gas in the nebula but for the creation of the interstellar bubble.
Acknowledgements.
C.E.C. acknowledges the kind hospitality of Dr. M. Rubio and her family during her stays in Santiago, Chile. We are grateful to Dr. N. Mizuno for providing us the NANTEN data. We thank the referee for her/his comments and suggestions that improved this presentation. This project was partially financed by CONICET of Argentina under project PIP 5886/05, UNLP under project 11/G093, and ANPCyT under project PICT 14018/03. M.R. is supported by the Chilean Center for Astrophysics FONDAP No. 15010003. M.R. and C.E.C. wishes to acknowledge support from FONDECYT (Chile) grant No. 1080335. This research has made use of the NASA/ IPAC Infrared Science Archive, which is operated by the Jet Propulsion Laboratory, California Institute of Technology, under contract with the National Aeronautics and Space Administration. This publication makes use of data products from the Two Micron All Sky Survey, which is a joint project of the University of Massachusetts and the Infrared Processing and Analysis Center/California Institute of Technology, funded by the National Aeronautics and Space Administration and the National Science Foundation. The MSX mission is sponsored by the Ballistic Missile Defense Organization (BMDO). We acknowledge the use of NASA’s SkyView facility (http://skyview.gsfc.nasa.gov) located at NASA Goddard Space Flight Center. This research has made use of the SIMBAD database, operated at CDS, Strasbourg, France.References
- (1) Benjamin, R.A., Churchwell, E., Babler, B.L., Bania, T. M., Clemens, D.P., Cohen, M., Dickey, J.M., et al. 2003, PASP, 115, 953
- (2) Booth, R.S., Delgado, G., Hagstrom, M., Johansson, L.E.B., Murphy, D.C. & et al., 1989, A&A, 216, 315.
- (3) Brand, J., & Blitz, L. 1993, A&A, 275, 67
- (4) Cappa, C. E. 2006, Rev.Mex. A.A., 26, 9
- (5) Cappa, C.E., Goss, W.M., & van der Hucht, K.A. 2004, AJ, 127, 2885
- (6) Cappa, C.E., Niemela, V., Martín, M.C., McClure-Griffiths, N.M. A&A, 436, 155
- (7) Cappa, C. E., Rubio, M., & Goss, W. M. 2001, AJ, 121, 2664
- (8) Castets, A., Duvert, G., Dutrey, A., Bally, J., Langer, W. D., & Wilson, R. W. 1990 A&A 234, 469
- (9) Chavarría, L.A., Allen, L.E., Hora, J.L., Brunt, C.M., Fazio, G.G. 2008, ApJ, 682, 445
- (10) Chu, Y.-H., 1981, ApJ, 249, 195
- (11) Chu, Y.-H., & Treffers, R. R. 1981, ApJ, 250, 615
- (12) Chu, Y.-H., Treffers, R. R., & Kwitter, K. B. 1983, ApJS, 53, 937
- (13) Churchwell, E., Povich, M.S., Allen, D., Taylor, M.G., Meade, M.R., Babler, B.L., Indebetow, R., et al. 2006, ApJ, 649, 759
- (14) Cichowolski, S., Pineault, S., Arnal, E. M., Testori, J. C., Goss, W. M., & Cappa, C. E. 2001, AJ, 122, 1938
- (15) Comerón, F., Schneider, N., & Russeil, D. 2005, A&A, 433, 955
- (16) Condon, J.J., Griffith, M.R., Wright, A.E., 1993, AJ, 106, 1095
- (17) Conti, P. S., & Vacca, W. D. 1990, AJ, 100, 431
- (18) Cooper, R.L., Guerrero, M.A., Chu, Y.-H., Chen, C.-H. Rosie, Dunne, B.C. 2004, ApJ, 605, 751
- (19) Crowther, P.A., 2007, ARA&A, 45, 177
- (20) Crowther et al. 2006, MNRAS, 372, 1407
- (21) Cutri, R.M., Skrutskie, M.F., van Dyk, S., et al. 2003, The IRSA 2MASS All-Sky Point Source Catalog, NASA/IPAC Infrared Science Archive
- (22) Cyganowski, C.J., Whitney, B.A., Holden, E., et al. 2008, AJ, 136, 2391
- (23) Deharveng, L., Lefloch, B., Kurtz, S., Nadeau, D., Pomares, M., Caplan, J., Zavagno, A. 2008, A&A, 482, 585
- (24) Deharveng, L., Zavagno, A., & Caplan, J. 2005, A&A, 433, 565
- (25) Egan, M. P., Price, S. D., Moshir, M. M., Cohen, M., Tedesco, E., Murdock, T. L., Zweil, A., Burdick, S., Bonito, N., Gugliotti, G. M., & Duszlak, J. 1999, The Midcourse Space Experiment Point Source Catalog Version 1.2 Explanatory Guide, AFRL-VS-TR-1999-1522, Air Force Research Laborartory
- (26) Elmegreen, B.G. 2000, ApJ, 530, 277
- (27) Esteban, C., 1993, PASP, 105, 320
- (28) Esteban, C., Vilchez, J.M., Manchado, A. & Edmunds, M., 1990, A&A, 227, 515
- (29) Flaherty, K.M., Pipher, J.L., Megeath, S.T., Winston, E.M., Gutermuth, R.A. 2007, ApJ, 682, 445
- (30) Freyer, T., Hensler, G., Yorke, H.W. 2003, ApJ, 594, 888
- (31) Freyer, T., Hensler, G., Yorke, H.W. 2006, ApJ, 638, 262
- (32) Georgelin, Y.M., Boulesteix, J., Georgelin, Y.P., Le Coarer, E. & Marcelin, M., 1988, A&A, 205, 95
- (33) Hamann, W.R., Koesterke, L. & Wessolowski, U., 1993, A&A, 274, 397
- (34) Junkes, N., Fürst, E., & Reich, W. 1992, A&A, 261, 289
- (35) Johansson, L.E.B., Greve, A., Booth, R.,S., Boulanger, F., Garay, G. & et al., 1998, A&A, 331, 857
- (36) Koenig, X.P., Allen, L.E., Gutermuth, R.A., Hora, J.L., Brunt, C.M., Muzerolle, J. 2008, ApJ, 688, 1142
- (37) Lada, C.J. 1987, in IAU Symp 115, Star forming regions, 1
- (38) Lada, C.J., Lada E.A., Clemens, D.P., Bally, J. 1994, ApJ, 429, 694
- (39) Lamers H.J.G.L.M., & Leitherer C. 1993, ApJ, 412, 771
- (40) Langer, W.D. & Penzias, A.A. 1990, ApJ 357, 477
- (41) Lefloch, B., Lazareff, B. 1994, A&A, 289, 559
- (42) Lumsden, S.L., Hoare, M.G., Oudmaidjer, R.D., & Richards, D. 2002, MNRAS, 336, 621
- (43) Marshall, D.J., Robin, a.C., Reylé, C., Schultheis, M., Picaud, S. 2006, A&A, 453, 635
- (44) McClure-Griffiths, N.M., Dickey, J.M., Gaensler, B.M., & Green, A.J., Haverkorn, M., & Strasser, S. 2005, ApJS, 158, 178
- (45) McCray R. 1983, Highlights of Astron., 5, 567
- (46) Mezger, P.D., & Henderson, A.P. 1967, ApJ, 147, 471
- (47) Muzerolle, J., Allen, L.E., Fazio, G.G., Lada, C.J. 1987, IAU Simp. 115, 1
- (48) Niedzielski, A. & Skorzynski, W., 2002, AcA, 52, 81
- (49) Nugis, T., & Lamers, H.J.G.L.M. 2000, A&A, 360, 227
- (50) Oey M.S. 1996, ApJ, 467, 666
- (51) Price, S.D., Egan, M.P., Carey, S.J., Mizuno, D., Kuchar, T. 2001, A&A, 121, 2819
- (52) Prinja, R.K., Barlow, M.J., & Howarth, I.D. 1990, ApJ, 361, 607
- (53) Radford, S. J. E., Solomon, P.M., & Downes, D. 1991 ApJ, 368, L15
- (54) Rieke, G.H. & Lebofsky, M.J. 1985, ApJ, 288, 618
- (55) Rizzo, J. R., Martín-Pintado, J., & Desmurs, J. F. 2003, in IAU Symp. 212, A Massive Star Odyssey, from Main Sequence to Supernova, eds. K.A. van der Hucht & C. Esteban, 742
- (56) Rochowicz, K. & Niedzielski, A., 1995, AcA, 45, 307
- (57) Sakamoto, S., Hasegawa, T., Handa, T., Hayashi, M., & Oka, T. 1997, ApJ, 486, 276
- (58) Sakamoto, S., Hayashi, M., & Hasegawa, T. 1994, ApJ, 425, 41
- (59) Siess, L., Dufour, E., Forestini, M. 2000, A&A, 358, 593
- (60) Simon, J.D., et al. 2007, ApJ, 669, 327
- (61) Stahler, S.W., Palla, F. 2005
- (62) Strong, A.W., Bloemen, J.B.G.M., Dame, T.M., Grenier, I.A. et al. 1988, A&A, 207, 1
- (63) Thompson, M.A., White, G.J., Morgan, L.K., Miao, J., Fridlung, C.V.M., Huldtgren-White, M. 2004, A&A, 414, 1017
- (64) Turner, D.G., & Forbes, D. 2005, PASP, 117, 967
- (65) Urquhart, J.S., Thompson, M.A., Morgan, L.K., Pestalozzi, M.R., White, G.J., Muna, D.N. 2007, A&A, 467, 1125
- (66) van der Hucht, K. A. 2001, New Astronomy Reviews, 45, 135
- (67) Walborn, N. 1982, AJ, 87, 1300
- (68) Watson, C.; Povich, M.S., Churchwell, E.B., Babler, B.L., Chunev, G., Hoare, M., Indebetouw, R., Meade, M.R., Robitaille, T.P., Whitney, B.A. 2008, ApJ, 681, 1341
- (69) Watson, C., Corn, T., Churchwell, E.B., Babler, B.L., Povich, M.S., Meade, M.R., Whitney, B.A. 2009, ApJ, 694, 546
- (70) Whitworth, A.P., Bhattal, A.S., Chapman, S.J., Disney, M.J., Turner, J.A. 1994, MNRAS, 268, 291
- (71) Zavagno, A., Deharveng, L., Comeron, F., Brand, J., Massi, F., et al. 2006, A&A, 446, 171
- (72) Zavagno, A., Pomares, M., Deharveng, L., Hosokawa, T., Russeil, D., Caplan, J. 2007, A&A, 472,835