Discovery of a highly energetic pulsar associated with IGR J140036326 in
a young uncataloged Galactic supernova remnant G310.61.6
Abstract
We report the discovery of 31.18 pulsations from the INTEGRAL source IGR J140036326 using the Rossi X-ray Timing Explorer (RXTE). This pulsar is most likely associated with the bright Chandra X-ray point source lying at the center of G310.61.6, a previously unrecognised Galactic composite supernova remnant with a bright central non-thermal radio and X-ray nebula, taken to be the pulsar wind nebula (PWN). PSR J14006325 is amongst the most energetic rotation-powered pulsars in the Galaxy, with a spin-down luminosity of erg s-1. In the rotating dipole model, the surface dipole magnetic field strength is G and the characteristic age kyr. The high spin-down power is consistent with the hard spectral indices of the pulsar and the nebula of and , respectively, and a 2–10 flux ratio . Follow-up Parkes observations resulted in the detection of radio emission at 10 and 20 from PSR J14006325 at a dispersion measure of 560 cm-3 pc, which implies a relatively large distance of 10 3 . However, the resulting location off the Galactic Plane of 280 would be much larger than the typical thickness of the molecular disk, and we argue that G310.61.6 lies at a distance of 7 . There is no gamma-ray counterpart to the nebula or pulsar in the Fermi data published so far. A multi-wavelength study of this new composite supernova remnant, from radio to very-high energy gamma-rays, suggests a young ( 103 yr) system, formed by a sub-energetic ( ergs), low ejecta mass (M ) SN explosion that occurred in a low-density environment ( 0.01 cm-3).
Subject headings:
pulsars: individual (PSR J14006325) — X-rays: individual (IGR J140036326, G310.61.6) — supernova remnants — gamma rays: observations1. Introduction
The number of known supernova remnants (SNRs) in the Galaxy has increased significantly over the last few years, mainly due to a new generation of radio and X-ray instruments of unprecedented sensitivities and angular resolutions. In particular, these observations, combined with Galactic Plane surveys (e.g. Brogan et al., 2006), and targeted observations (e.g. Gelfand & Gaensler, 2007; Gaensler et al., 2008) have increased the fraction of SNRs found to harbor an energetic pulsar powering a wind nebula (the so-called composite SNRs). Moreover, deep observations toward compact PWNe have proven to be successful in detecting their powering pulsars (Camilo et al., 2009; Gotthelf & Halpern, 2009), providing constraints on their energetics, spin evolution, and birth parameters. Along with the current generation of high/very-high energy (VHE; 100 ) instruments, these observations are of prime importance for understanding the structure and evolution of these sources, and the underlying acceleration mechanisms which occur close to the pulsar, and at the relativistic and non-relativistic shock fronts bounding the PWN and the host SNR (Gaensler & Slane, 2006).
The soft -ray source IGR J140036326 was discovered in a deep INTEGRAL/IBIS/ISGRI mosaic of the Circinus region as a persistent source at the mCrab level (Keek, Kuiper & Hermsen, 2006). A Swift/XRT survey of INTEGRAL sources located IGR J140036326 to 4′′ in 2–10 X-rays, but no conclusion was reached on its nature (Malizia et al., 2007). A follow-up Chandra survey of unidentified IGR sources reported a PWN within a 3′ diameter nearly circular emission nebula (Tomsick et al., 2009). These authors presented the 0.3–10 spectrum of the total emission by an absorbed power-law with a relatively hard photon index ( = 1.82 0.13) and a large column density NH 3 1022 cm-2.
In this paper, we report the discovery with the Rossi X-ray Timing Explorer (RXTE) of 31.18 pulsations toward IGR J140036326, and the radio detection in follow-up observations using the Parkes telescope. We present a multi-wavelength study of this new Galactic composite SNR, G310.61.6, using radio, X-ray, and gamma-ray data. PSR J14006325 is one of the most energetic in the Galaxy and powers a wind nebula whose broadband non-thermal synchrotron emission is measured in radio and X-rays. We present a spatial and spectral analysis that shows evidence for a young SNR, formed from a sub-energetic, low ejecta mass SN explosion that occurred in a low-density environment. We also discuss the implications of the lack of high-energy (HE) gamma-ray emission in the Fermi data.
2. Observations and Results
2.1. Chandra
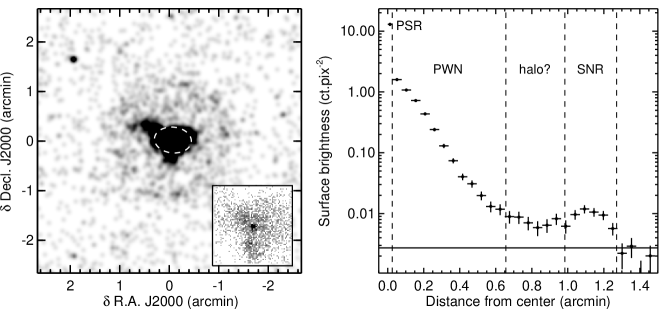
We have performed a reanalysis of the Chandra data of the IGR J140036326 field (Tomsick et al., 2009) taken on 2008 June 29 UT, using the Advanced CCD Imaging Spectrometer (ACIS, Garmire et al., 2003) and operating in TIME/FAINT exposure mode. The livetime amounts to 5077 , corrected from the 1.3% readout dead time. The maximum pixel count rate within the source is 0.015 ct s-1, so pile-up effect could be safely ignored. All the data reduction and analysis were performed with the Chandra Interactive Analysis of Observation software (CIAO) version 4.1.2, using the CALibration DataBase (CALDB) v4.1.3. Figure 1 (left) shows the 0.5–10 Chandra image centered on IGR J140036326, which exhibits a characteristic morphology of a composite SNR, as revealed by the radial profile of the surface brightness (Figure 1, right). In particular, the excess emission at 1.1-1.2′ from the center is found to be the clear signature of the host shell-type SNR. We have considered three regions of interest, namely the bright point-like source (PSR), the diffuse surrounding emission (PWN), and the shell-like structure (SNR). As shown on the profile, some faint emission seems to extend up to the shell-type structure, at distances of 1′ from the PSR. In view of the large NH, this could be partly explained by a dust-scattering halo, similar to those observed in other PWNe, such as G21.5-0.9 (Slane et al., 2000; Safi-Harb et al., 2001; Bocchino et al., 2005). Unfortunately, the lack of statistics prevents us from drawing any firm conclusion about the nature of this extended X-ray emission. The source-free region used to extract the background was taken on the same CCD chip as the source, in a circle of 1.45′ in radius. Apart from the PWN emission, the low count levels led us to fit the three components simultaneously, with a common hydrogen column density NH = (2.09 0.12) 1022 cm-2. As noticed by Tomsick et al. (2009), this value is of the same order as the Galactic value111We here make use of the Anders & Grevesse (1989) abundances, rather those of Wilms, Allen & McCray (2000), as done in Tomsick et al. (2009). Using the latter abundances yields compatible NH 3 1022 cm-2., and suggests a large distance and/or local absorption.
The best-fit position of the point-like source is R.A.(J2000) = 14h00m45.69s, Decl.(J2000) = 63∘25′42.6′′ (Tomsick et al., 2009). For the spectral analysis, we chose an integration region of 1.5′′ in radius centered on the source and estimated the source background using counts extracted from a concentric annulus of radii 1.5′′ and 2′′. Fits to the background subtracted spectrum are not tightly constrained, even though a power-law gives slightly better results than any thermal model. The spectrum is hard, with a best-fit power-law index of 1.22 0.15 and an unabsorbed 2–10 flux of (1.95 0.5) 10-12 ergs cm-2 s-1. The PWN integration region was taken in an annulus centered on the PSR position, with an inner radius of 1.5′′ and an outer radius of 0.65′ (see Fig. 1, right). The best-fit power-law index and the unabsorbed 2–10 flux are found to be 1.83 0.09 and (1.51 0.20) 10-11 ergs cm-2 s-1, respectively. Therefore, the PWN is by far the dominant component in X-rays and these spectral results are in close agreement with those obtained by Tomsick et al. (2009) on the total emission. The SNR integration region was defined as an annulus, with inner and outer radii of 0.98 and 1.27′, respectively. As for the PSR, due to the low statistics, the SNR spectrum is rather poorly constrained, and does not allow us to clearly distinguish between thermal and power-law models, although no strong X-ray lines are present. A power-law fit gives a rather soft spectrum, with a best-fit spectral index of 2.56 0.18 and an unabsorbed 2–10 flux of (1.0 0.2) 10-12 ergs cm-2 s-1. Whatever is the nature of the X-ray emission, the flux measured with Chandra can be considered as an upper limit on the synchrotron emission. We then converted the best-fit power-law spectrum to a surface brightness at 4 of 5 1032 ergs pc-2 s-1 sr-1, as this will be compared to theoretical predictions in section 3.
2.2. RXTE
The X-ray flux measured from the Chandra point source in G310.61.6 is sufficient to search for the expected pulsations using RXTE. A pair of 44 ks exposures were obtained a year apart on 2008 September 29 UT and 2009 September 30. Data were collected with the Proportional Counter Array (PCA; Jahoda et al., 1996) in the GoodXenon mode with an average of 1.5 and 2.2 out of the five proportional counter units (PCUs) active, for the two observations, repectively. In this mode, photons are time-tagged to s and have an absolute uncertainty better than 100 s. The effective area of five combined units is cm2 at 10 with a roughly circular field-of-view of 1∘ FWHM. Spectral information is available in the 2–60 energy band with a resolution of 16% at 6 . The standard time filters were applied to the PCA data, which rejects intervals of South Atlantic Anomaly passages, Earth occultations, and other periods of high particle activity. The photon arrival times were transformed to the Solar-system barycenter in Barycentric Dynamical Time (TDB) using the JPL DE200 ephemeris and the Chandra coordinates for the point source.
2.2.1 Timing analysis
We restricted the RXTE timing analysis to photon data with energies in the 2–20 range (PCA channels 2–50) recorded in the top Xenon layer of each PCU, to optimize the signal-to-noise ratio. For the first observation, we further excluded one 4 non-contiguous data segment at the beginning of the run, resulting in 33.4 of filtered time spanning 45 . A Fast Fourier Transform (FFT) of the data binned in 1 steps revealed a significant signal of power at a period of . For the search elements this corresponds to a false detection probability for a blind search down to 1 of (99.9924 % Confidence Level). We refined this signal using a statistics which yields a signal power at a period of . The uncertainty on the last digit is given in parentheses. Figure 2 displays the pulse profile in the 2–20 band folded at this period; the profile is narrower than a sinusoid, somewhat boxy, with a well deliniated off-pulse region. We do not see any evidence for energy dependence of the pulse profile when subdividing the 2–20 band. The signal does not match any cataloged pulsar in the field-of-view, in particular the pulsars PSR J14036310 ( ) and PSR J14016357 ( ). In order to ensure that we have not picked up an aliased signal from these PSRs, the data was rebarycentered at their respective coordinates and searched for the known pulse period. No signal was detected apart from the original one reported above.

Based on a probable detection of an highly energetic PSR, we requested a second RXTE observation to confirm this result and determine the PSR spin-down rate. For the 2009 data, we followed the same proceedures outlined above and constructed a periodogram around the expected signal. This yielded a significant signal at with power , corresponding to a negligible probability of false detection. This result confirms the previous detection and provides a period derivative measurement of . The one sigma error is derived from the root sum of the variance of the period uncertainties. The ephemeris is presented in Table 1 along with the inferred spin-down parameters. The derived spin-down power ergs s-1 ( is the moment of inertia in units of 1045 g cm2) makes PSR J14006325 one of most energetic Galactic pulsars known, a close tie with several recently reported energetic rotation-powered pulsars (Camilo et al., 2009; Gotthelf & Halpern, 2009). In the dipole pulsar model, the characteristic age kyr, assuming (the initial PSR period), and the surface dipole magnetic field G. Based on the associated PWN and SNR, its estimated luminosity, and its spin-down properties, PSR J14006325 is clearly a Crab-like, young energetic rotation-powered PSR responsible for the observed PWN.
| Parameter | Value |
|---|---|
| R.A. (J2000) | |
| Decl. (J2000) | |
| Period, (ms) @ MJD 54738 | 31.180373(2) |
| Period, (ms) @ MJD 55105 | 31.1816011(3) |
| Period derivative, | |
| Dispersion measure (cm-3 pc) | |
| Flux density at 10 (Jy) | 110 |
| Flux density at 20 (Jy) | 250 |
| Flux density at 50 (Jy) | |
| Characteristic age, (kyr) | |
| Spin-down luminosity, (ergs s-1) | |
| Surface dipole magnetic field, (G) | |
| DM-based distance (kpc) |
Note. — uncertainties given.
The pulsed emission of PSR J14006325 is well isolated in phase with nearly constant emission in-between. This allowed us to take advantage of phase-resolved spectroscopy to obtain a spectrum of the pulsed flux using the off-pulse emission as a near perfect representation of the background plus unpulsed spectrum. We generated phase-resolved spectra in 20 phase bins using the RXTE FTOOL fasebin, aligning the two observations to a common phase and summing the result. From this combined spectral file, we generated on- and off-pulsed spectra as input into the XSPEC spectral fitting package. The response matrix for the phase-resolved spectra was generated using the same photon file, selecting only photons from the top layer of each PCU (LR1) to match the fasebin output. We divided the data in to two phases, 0.5 cycles apart to characterise the on-pulse signal and the off-pulse signal, respectively. We fitted the on-pulse spectrum with an absorbed power-law spectral model over the 2–10 band, outside of which the background dominated the pulsed signal. The column density was fixed to the Chandra value as RXTE, with its higher energy band, is unable to constain this parameter. For an NH = 2.09 cm-2 the best-fit photon index is with a for degrees-of-freedom (see Fig. 3). The measured 2–10 pulsed flux is ergs cm-2 s-1 (absorbed), and represents 18% of the total flux from the Chandra source.

2.2.2 Spectral analysis
In order to extract the total RXTE/PCA spectrum, dominated by the PWN, we also accumulated spectra restricted to the top layer of PCU 2. The background was estimated using the faint model. Given the sky position of IGR J140036326, X-ray emission from the Galactic ridge can contribute to the PCA spectrum. Following previous works (e.g. Prat et al., 2008; Rodriguez et al., 2009), we estimated its level according to the Valinia & Marshall (1998) model, and by assuming that Chandra and RXTE/PCA are perfectly cross-calibrated. After removing the Galactic X-ray contribution, we found that a power-law fit to the 3–20 PCA spectrum gives a NH similar to that found for the three Chandra components, though not well constrained, (2.25 1.1) 1022 cm-2. Freezing it to the value measured with Chandra leads to a spectral index of 2.19 0.10 and an unabsorbed 3–20 flux of (1.57 0.3) 10-11 ergs cm-2 s-1. The spectrum measured with PCA turns out to be softer than that measured with Chandra/ACIS in the 2–10 band. This can be explained by the presence of a break or steepening at high energies in the PWN spectrum. Thus, we also fitted the PCA spectrum with a broken power-law, with NH and a photon index before the break frozen to the Chandra values, and found a marginal evidence for such a break at 3 , with a photon index at higher energies of 2.21 0.09, though with a slightly larger . This emission detected by RXTE/PCA is most likely related to G310.61.6, and mainly to the PWN diffuse emission, since no other significant X-ray source lies within the PCA field-of-view, at 2∘ from IGR J140036326.
2.3. INTEGRAL IBIS/ISGRI
We analyzed all the public IBIS/ISGRI data, from revolution 46 to 713, at less than 12∘ from IGR J140036326, with the Off-Line Scientific Analysis (OSA) software (Goldwurm et al., 2003), version 7.0. After removing all the noisy pointings, as defined in Renaud et al. (2006), the total effective time amounts to 3.5 . Mosaic images were produced in six energy bands from 18 to 65 with an additional band between 82 and 150 , in order to extract the non-thermal continuum source spectrum. Furthermore, the very small apparent size of G310.61.6 ( 2.3′ = 4.7 d7 pc, with d = 7 d7 kpc) is reminiscent of a young SNR. To search for evidence of 44Ti line emission at 67.9 and 78.4 , expected from a young remnant, we also generated mosaic images in the 65–71, 71–75 and 75–82 energy bands. These lines emerge from the radioactive decay of the short-lived 44Ti nucleus (with a weighted-average lifetime of 85 0.4 yr, see Ahmad et al. 2006, and references therein). Although firmly detected in only the 330 yr old Cas A SNR (Iyudin et al., 1994; Vink et al., 2001; Renaud et al., 2006), this radioactive element can provide invaluable constraints on the key parameters of the SN explosion.
In the 18–50 mosaic image, the best-fit position of IGR J140036326 is found to be consistent with the results obtained by Bird et al. (2007), and compatible with a point-like source concident with G310.61.6. The continuum emission is safely detected with IBIS/ISGRI up to 65 and the spectrum is fit by a power-law with a photon index of 2.33 0.29 and a 20–100 flux of (1.24 0.17) 10-11 ergs cm-2 s-1. No evidence of 44Ti line emission was detected in the direction of IGR J140036326, and we set a 3 upper limit of 1.5 10-5 ph cm-2 s-1, after combining the two 44Ti energy bands.
| power-law | broken power-law | |||||||||
|---|---|---|---|---|---|---|---|---|---|---|
| aa In units of 1022 cm-2, assuming the Anders & Grevesse (1989) abundances | Fluxbb 2–10 (Chandra), 3–20 (RXTE/PCA), and 20–100 (IBIS/ISGRI, Total and PWN) unabsorbed fluxes, in units of 10-12 | / | aa In units of 1022 cm-2, assuming the Anders & Grevesse (1989) abundances | Ebcc Break energy in units of keV | Fluxbb 2–10 (Chandra), 3–20 (RXTE/PCA), and 20–100 (IBIS/ISGRI, Total and PWN) unabsorbed fluxes, in units of 10-12 | / | ||||
| PSR (pulsed) RXTE | 2.09 (–) | 2.0 (0.40) | 0.36 (0.2) | 20.4/17 | – | – | – | – | – | – |
| PSR (total) Chandra | 2.09 (0.12) | 1.22 (0.15) | 1.95 (0.5) | 182.5/191 | – | – | – | – | – | – |
| SNR Chandra | 2.09 (0.12) | 2.56 (0.18) | 1.00 (0.2) | 182.5/191 | – | – | – | – | – | – |
| PWN Chandra | 2.09 (0.12) | 1.83 (0.09) | 15.1 (2.0) | 182.5/191 | – | – | – | – | – | – |
| RXTE/PCA | 2.09 (–) | 2.19 (0.10) | 15.7 (3.0) | 31.8/30 | 2.09 (–) | 1.83 (–) | 3.0 (2.0) | 2.21 (0.09) | 15.7 (3.5) | 31.8/29 |
| IBIS/ISGRI | – | 2.33 (0.29) | 12.4 (1.7) | 7.2/7 | – | – | – | – | – | – |
| Totaldd Total spectrum in the 0.8–100 energy range | 2.46 (0.08) | 2.16 (0.03) | 13.4 (0.8) | 272.6/246 | 2.13 (0.13) | 1.90 (0.11) | 5.6 (0.7) | 2.30 (0.07) | 10.6 (1.5) | 257.1/244 |
| PWNee PWN spectrum in the 0.8–100 energy range, after removing the PSR and SNR contributions | – | – | – | – | 2.13 (0.14) | 1.90 (0.10) | 6.0 (0.5) | 2.59 (0.11) | 5.3 (0.8) | 257.1/244 |
Note. — The uncertainties quoted are at the 68 % confidence level.
2.4. Spectral properties of G310.61.6
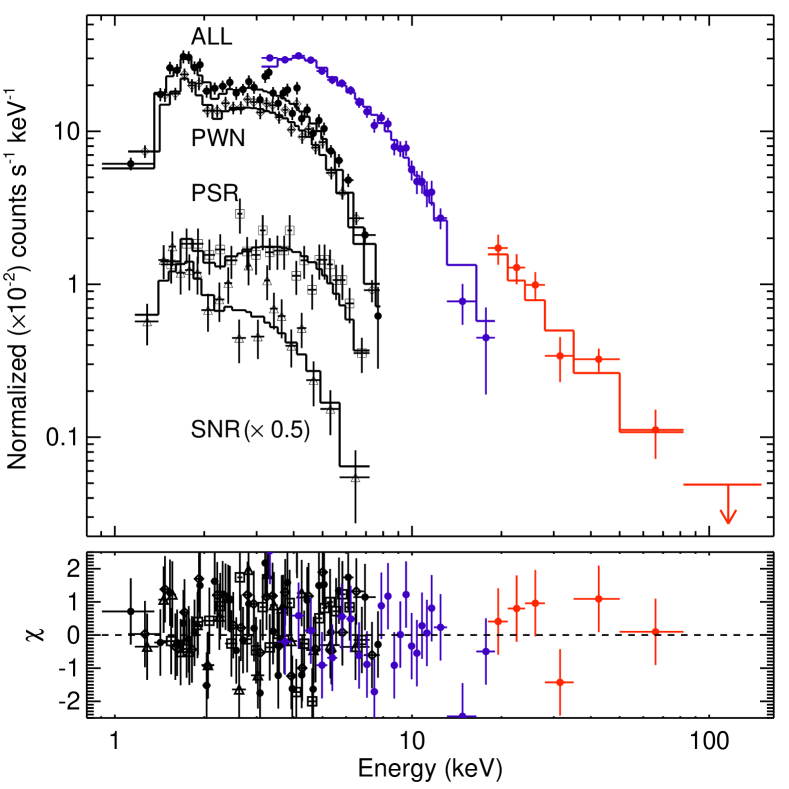
Spectra of the different components measured with Chandra, together with those of RXTE/PCA and IBIS/ISGRI are shown in Figure 4, and spectral model fits are reported in Table 2. In the 2–10 band, the PWN accounts to 85 % of the whole emission. A simultaneous fit on the three spectra (Chandra total emission, RXTE/PCA and IBIS/ISGRI) indicates that a broken power-law is better at describing the 0.8–100 total emission. According to the F-test, this model is favored over a pure power-law at the 3.5 confidence level (probability of 2 10-4). The break energy is measured at 5.6 0.7 , and the photon index at higher energies nicely matches that measured by IBIS/ISGRI. We also performed a spectro-imaging analysis of the PWN, in order to search for any spectral softening at larger distances from the PSR, as expected from efficient synchrotron burn-off of high-energy electrons accelerated in the central regions (see e.g. Slane et al., 2000, in the case of G21.50.9). We fixed the NH to the best-fit Chandra value, and found a 2.5 evidence of a spectral softening, from = 1.68 0.09 at 5′′ from the PSR, to 2.09 0.09 at the edge of the nebula. In order to measure the 0.8–100 PWN spectrum, we first constrained the PSR spectral index and 2–10 flux to be 1.4 and 1.7 10-12 ergs cm-2 s-1 at most, in order not to violate the IBIS/ISGRI 3 upper limit in the 82–150 energy range, while being still consistent with the Chandra values, at the 1 confidence level. Then, we performed a second simultaneous fit on the three spectra (Chandra total emission, RXTE/PCA and IBIS/ISGRI), by freezing the 0.8–10 PSR and SNR spectra to the best-fit values, and extracted the minimum 0.8–100 spectrum of the PWN, whose parameters are presented in Table 2 (last row). We find that a broken power-law fit gives a break energy of 6.0 0.5 , in agreement with that measured above. Due to the hard PSR spectrum, assumed to extend up 100 with the same spectral index, the minimum PWN spectrum at higher energies is softer than the total emission, but statistically consistent with the spectrum measured by IBIS/ISGRI.
2.5. Radio
2.5.1 pulsar
A search for a radio counterpart to the X-ray pulsar was carried out using the Parkes 64-m radio telescope of the Australia Telescope National Facility, CSIRO Astronomy and Space Science, in the 10, 20 and 50 bands. Observations were made with the centre beam of the 20 Multibeam receiver and analogue filterbank system (Manchester et al., 2001) with sampling interval of 250 s on 2009 October 11 (2 h) and 2009 November 26 (4 h), and the 10–50 receiver and Parkes digital filterbank systems (1 h at each of 10 and 50 ), on 2009 October 13. The received centre frequencies were 3100, 1374 and 732 at 10, 20 and 50 respectively, and the corresponding bandwidths were 1024, 256 and 64 . A search of the October data over a period range of s about the nominal pulsar period (see Table 1) and a dispersion measure (DM) range of 0 to 1500 cm-3 pc yielded some possible candidates with DMs in the range 400 – 600 cm-3 pc and signal-to-noise (S/N) ratios of 6.5. A similar analysis of the longer 20 observation in November gave a positive detection with S/N ratio of 8.8 at the predicted pulse period and at a DM of cm-3 pc, as shown in Figure 5. This detection corresponds to one of the candidates from the analysis of the October 20 observations.
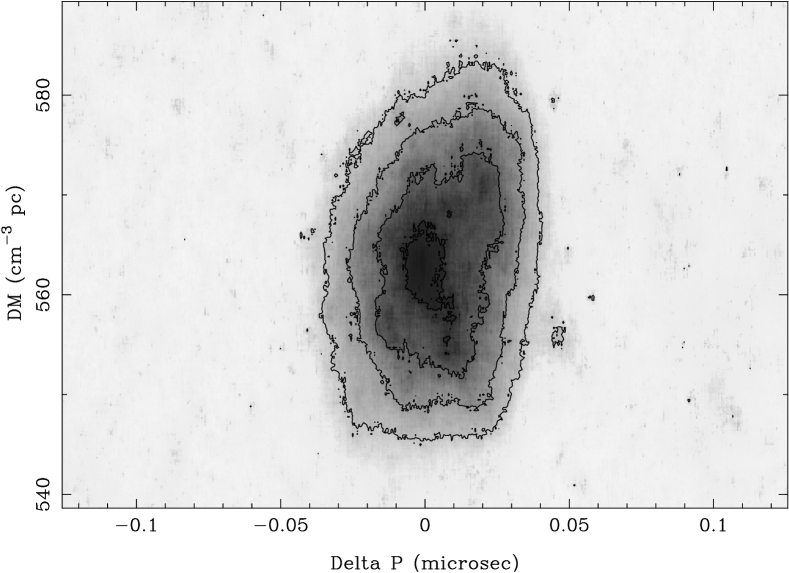

Figure 6 shows the 20 (1374 ) pulse profile from the November observations and the 10 (3100 ) pulse profile obtained by folding and dedispersing the data with the nominal pulsar parameters and a DM of 563 cm-3 pc. The pulsed emission is clearly detected at 10 although the S/N ratio is low. The profile appears very broad and almost sinusoidal at both frequencies. The profiles have been calibrated in flux density units, giving mean pulsed flux densities of approximately 0.25 and 0.11 at 20 and 10 , respectively. The upper limit on the pulsed flux density at 50 is about 0.5 . At face value, these results imply a rather flat pulsar spectrum with spectral index (throughout this paper, S). Radio observations with improved sensitivity and with contemporaneous X-ray observations will be required to explore the details of the radio pulse morphology and the phase relationship with the X-ray pulse. Distance estimates based on the observed DM are 9.4 (Taylor & Cordes, 1993) and 11.3 (NE2001, Cordes & Lazio, 2002). Given the large uncertainties inherent in DM-based distances, a reasonable estimate for the pulsar distance is kpc.
2.5.2 wind nebula
Young PSRs are often associated with wind nebulae, usually detected in the radio and X-ray domains. We searched for the radio counterpart of the Chandra SNR in the archival data of the Molonglo Galactic Plane Survey at 843 (MGPS-2, Murphy et al. 2007), the 2.4 Parkes survey of the Southern Galactic Plane (Duncan et al., 1995), and the Parkes-MIT-NRAO (PMN) survey at 4.85 (Griffith & Wright, 1993; Condon, Griffith & Wright, 1993). We found an extended MGPS-2 source, MGPS J140045632542, located at R.A.(J2000) = 14h00m45.17s, Decl.(J2000) = 63∘25′42.2′′, 3.5′′ away from the Chandra point-like source. The intrinsic source size of 44.8 31.2′′ (after deconvolution from the MOST beam size of 45′′) is depicted in Figure 1 (left) by the dashed ellipse, which nicely matches the X-ray PWN, and thus corresponds to its radio counterpart. The 843 flux density was measured to be 217.4 9.4 (Murphy et al., 2007). In the 4.85 PMN data, we found an other cataloged source coincident with the Chandra SNR. According to Wright et al. (1994), PMN J14006325 lies at R.A.(J2000) = 14h00m45.2s, Decl.(J2000) = 63∘25′43′′. With an angular resolution of 5′ (FWHM), the source is unresolved, and features a flux density of 113 (131) 10 , depending on the fit procedure used (see Griffith & Wright, 1993; Wright et al., 1994). No significant emission is detected in the Parkes image at 2.4 (Duncan et al., 1995), and we calculated a 3 upper limit of 0.6 . A power-law fit on these three radio measurements gives a spectral index of 0.33 0.05, 0.205 0.008, and a flux density at 1 of (0.207–0.204) 0.008 , depending on the adopted MGPS-2 source flux. Such index is similar to those measured in other radio PWNe (Gaensler & Slane, 2006), and we can safely conclude these MGPS-2 and PMN sources are the counterparts of the X-ray wind nebula discovered with Chandra.
No radio shell-type structure is detected in the MGPS-2 image, even though the MOST angular resolution should allow us to separate it from the PWN. We have calculated an upper limit on the SNR surface brightness by modelling the SNR as a uniform annulus with a mean radius of 1.15′ and a width of 0.15′ (see Fig. 1, right) and convolving it with the MOST beam size. The upper limit, derived by summing all the pixels within a region encompassing the FWHM of the simulated MGPS-2 shell emission, is 2.5 10-21 W m-2 Hz-1 sr -1 at 843 , which corresponds to 2.3 10-21 W m-2 Hz-1 sr -1 at 1 (for = 0.5), as commonly used in studies of radio shell-type SNRs (Green, 2009).
3. Discussion
3.1. General considerations
After the Crab pulsar, PSR J14006325 is one of the most energetic pulsars known in the Galaxy, rivaling the recently discovered PSRs associated with G12.820.02 and G0.9+0.1 SNRs (Gotthelf & Halpern, 2009; Camilo et al., 2009). Its characteristic age of 12.7 likely overestimates the true age , based on comparison with the SNR estimate (see below), consistent with the fact that the pulsar has not spun down significantly. We then assume in the following that (i.e. P P0 and 0). The commonly used relations between PSR/PWN X-ray spectra (2–10 indices and luminosities) and the intrinsic PSR properties (Possenti et al., 2002; Gotthelf, 2003; Mattana et al., 2008; Li et al., 2008), provide consistent estimates with those measured here, though with the large uncertainties inherent of such correlation studies. Amongst these relations, those between PSR/PWN X-ray luminosities and point towards a distance to the source of 6-10 , compatible with the DM-based estimate of 10 3 . On one hand, the high NH derived from the Chandra spectra suggests either a large source distance, or local absorption that could be undetectable in the existing large-scale HI and 12CO Galactic surveys at moderate angular resolutions. Using the latest relation between optical extinction and NH of Güver & Özel (2009), we find an extinction A 9 toward IGR J140036326. Furthermore, according to the Galactic interstellar extinction map of Marshall et al. (2006), such AV along the IGR J140036326 line of sight corresponds to a distance of 5-8 . For such a high extinction, only in the case of an over-luminous core-collapse SN event (with MV 17, see Richardson 2009), would the stellar explosion of G310.61.6 have been visible with naked eye (mV 6) for distances 5 . On the other hand, its Galactic latitude 1.6∘ translates into an height from the Galactic Plane of 280 at 10 , which is much larger than the typical scale height of the Galactic molecular disk ( 55 , e.g. Ferrière, 2001) within which core-collapse SNe are known to usually explode222We note that G310.61.6 could potentially originate from a runaway OB / Wolf-Rayet star (see e.g. Dray et al., 2005). This scenario would explain the large height from the Galactic Plane for a distance of 10 .. We also note that the Galactic longitude of G310.61.6 corresponds to the Crux-Scutum arm tangent, at 6-7 (Vallée, 2008), where much of the molecular material along this line of sight lies. In order to account for all the above-mentioned estimates with their respective uncertainties, we then adopt a distance of 7 , which implies a height similar to that of the Crab nebula, and scale the distance in terms of = d/7 .
The very small angular size of G310.61.6 2.3′ = 4.7 pc already places it amongst the smallest known SNRs, and could in turn imply a very young age, similar to the recently rediscovered G1.9+0.3 SNR (Reynolds et al., 2008), and the well known Tycho, Kepler and Cas A SNRs. For a uniform ambient medium of density cm-3, the SNR has swept up only M and thus may still be in free expansion phase. In such case, for a typical ejected mass of M and a SN explosion kinetic energy of ergs, the expansion velocity would be km s-1, implying an age 720 yr. Such a young age is also supported by the nearly circular shape of the SNR, with the PSR lying very near its geometrical center. An offset of 2.5′′, as estimated on the Chandra image, implies a projected space PSR velocity of only 80 km s-1, with yr, i.e. significantly smaller than the average found by Hobbs et al. (2005) for young PSRs. If we assume G310.61.6 has produced the same amount of 44Ti as Cas A (Renaud et al., 2006), the IBIS/ISGRI upper limit on the two low-energy 44Ti lines would translate into a lower limit on its age of 280 at 7 . If younger, G310.61.6 would not have originated from one of these 44Ti-rich SN explosions whose remnants (except Cas A) have been unfruitfully searched by several missions over the past decades (e.g. Renaud et al., 2004; The et al., 2006).
3.2. PWN broadband emission and energetics
In order to account for the different spectral indexes measured in radio and X-ray domains (see section 2.5 and Table 2), the PWN broadband synchrotron spectrum should exhibit a break at 3 104 GHz. Such frequency, if originated from synchrotron cooling of accelerated electrons inside the PWN, would correspond to an uncomfortably high magnetic field strength G. In such case, the PWN should have appeared smaller in X-rays than in radio, in contradiction with what is shown in Figure 1. This break could instead reflect the injected electron spectrum (see e.g. Camilo et al., 2006) or the nature of the magnetic field and of the resulting synchrotron emission (Fleishman & Bietenholz, 2007). As presented in section 2.4, the break measured at 6 could be that expected from synchrotron cooling and, thus, provides a PWN age yr, with G. VHE observations can help further constrain the magnetic field strength inside the PWN. As reported by Chaves et al. (2008), no point-like source toward IGR J140036326 is detected above 5 in the latest map of the H.E.S.S. Galactic Plane Survey, in 15 of effective time. This translates into a H.E.S.S. upper limit of 4 % of the Crab nebula (Khélifi et al., 2008), i.e. 3 10-12 ergs cm-2 s-1 in the 1–10 energy range. In a simple one-zone leptonic scenario, the VHE emission comes from inverse-Compton scattering of VHE electrons on ambient photons (CMB and infrared and optical Galactic fields, from dust and stars, respectively). From the ratio between the X-ray flux and the H.E.S.S. upper limit, we find that the magnetic field must be larger than 6 G, and then, the age must be smaller than 1900 . The corresponding maximal energy content in particles Ep,max amounts to ergs.
PWN energetics can also provide useful insight on the source age, as young PWNe usually feature a ratio between the internal energy and the PSR rotational spin-down energy 1 ( 0.44 for the initial PSR spin-down time , and depends weakly on the supernova density profile, see Chevalier, 2005, equation 30). On one hand, Ep,max thus provides a conservative limit Esd,max ergs, which implies a maximal age of 3000 for ergs s-1. On the other hand, a lower limit on can be obtained from equipartition arguments (Govoni & Feretti, 2004; Chevalier, 2005). We estimate that ergs, i.e. ergs, and a magnetic field at equipartition B G, from the radio properties of the PWN. In case IGR J140036326 is at the equipartition between particles and magnetic field, its age would then be 1 . However, H.E.S.S. has recently discovered VHE -ray emission toward two other young PWNe, G21.50.9 and Kes 75 (Djannati-Ataï et al., 2008). These observations imply magnetic fields of 10–15 G, well below the equipartition values, and therefore support earlier suggestions (Chevalier, 2005) that some young PWNe are particle dominated. If the same applies to IGR J140036326, at the equipartition does not reflect the whole PWN energy content, and in the particle-dominated regime. In this regime, following Chevalier (2005), the / 0.44 relation, valid when as assumed here, would be consistent with the existence of a break measured at 6 ( yr) for a distance of 7–8 .
3.3. The evolutionary stage of G310.61.6
As discussed previously, several arguments point towards a very young composite SNR. The ratio333The radio PWN found in the MGPS-2 data is elliptical, so that we suppose its effective size to be ′′. This yields a PWN to SNR size ratio of 37′′/2.3′ 1/4. between the PWN and SNR radii is R 1/4, and can be used to probe the parameters governing the early evolution of composite SNRs, namely , and (van der Swaluw et al., 2001; Blondin et al., 2001), given the measured with RXTE. First, and are constrained by the faint X-ray level, and the 1 upper limit, of the SNR synchrotron surface brightness. According to Berezhko & Völk (2004), such low values can only be explained by a very tenuous medium ( 0.01 cm-3)444This argues against a local absorption at the origin of the large NH, and distances much less than the Crux-Scutum spiral arm tangent., together with a sub-energetic explosion. Furthermore, using the so-called radius method of van der Swaluw & Wu (2001), the rotational energy relates to the PWN to SNR radius ratio R as: erg, or yr, with a dimensionless parameter ranging between 1 and 3 during the early evolution phase (see their Fig. 1). With the upper limit on estimated from the H.E.S.S. non detection, and the lower limit from equipartition arguments, we infer , in agreement with the weak radio and X-ray surface brightnesses of the SNR. We estimate the initial PSR period (for a braking index n = 3), for a current period of 31.18 . Based on the Blondin et al. (2001) and Chevalier (2005) calculations, we then explored a wide range of , and (the power-law index of the ejecta distribution was set to 12). For a distance of 7 , if is set to 0.01 cm-3, we find that only a sub-energetic ( = 0.05), low ejecta mass (Mej = 3) SN explosion could explain the measured R. The resulting SNR age and PWN magnetic field are 920 and 10 G, respectively. Note that the constraint on is only qualitative, as a quantitative estimate would require a detailed modelling of the SNR synchrotron emission, as performed by Berezhko & Völk (2004). If we relax this constraint and set to the Galactic value of 1 cm-3, this would result in a larger energy of the explosion ( = 0.4), and a smaller SNR age ( 550 ), for the same mass of the ejecta. In this regard, knowing the nature of the SNR X-ray emission is crucial to assess the thermal flux level, and then, the surrounding density.
4. Conclusion
Even though some assumptions have been made in the previous estimates (e.g. constant PWN magnetic field and PSR spin-down power), they give valuable insight on the nature of this new Galactic composite SNR. G310.61.6 harbors a highly energetic 31.18 pulsar, PSR J14006325, which powers a wind nebula, both lying at the center of the host shell. All of the existing multi-wavelength observations suggest it is a young SNR ( 103 yr), and most likely distant ( 5 ). However, many questions still remain to be answered. First, the distance is not very well constrained, though a large distance is favored by the dispersion measure of the radio pulse emission and by the large NH measured with Chandra. High-resolution observations of the ISM tracers such as HI and 12CO are then warranted to assess the surrounding medium properties. Moreover, the break measured at 6 and the spectral softening at increasing distances in the PWN need to be confirmed, and the SNR X-ray spectrum needs to be investigated with more X-ray data. Nevertheless, G310.61.6 falls into the emerging class of “multi-wavelength”, young ( a few 103 yr) and composite SNRs, harboring very energetic PSRs and wind nebulae shining in radio, X-rays and potentially in HE/VHE -rays. The list includes Kes 75 and G21.50.9 (Gotthelf et al., 2000; Camilo et al., 2006; Bietenholz & Bartel, 2008; Djannati-Ataï et al., 2008), and more recently G0.9+0.1 (Aharonian et al., 2005a) and HESS J1813178 (Aharonian et al., 2005b), whose long-expected PSRs have recently been discovered (Camilo et al., 2009; Gotthelf & Halpern, 2009). It is of interest to note that Fermi/LAT has not detected a bright source (Abdo et al., 2009a), nor pulsar (Abdo et al., 2009b, c) coincident with G310.61.6, although, at first glance, energetic PSRs should be the most easily detectable sources. However, not all of the above-mentioned young and energetic PSRs have been detected by Fermi. From the first Fermi catalog of gamma-ray PSRs, the sensitivity for a blind search of pulsed emission in the Galactic Plane is conservatively taken to be 2 10-7 cm-2 s-1 above 100 (Abdo et al., 2009c). Assuming a spectrum similar to that of PSR J18331034 associated with G21.50.9, PSR J14006325 features a maximal efficiency / of 1 %. This is close to what is measured from other young PSRs (see Fig. 6 of Abdo et al. (2009c)), and argues in favor of a fairly large distance to the source, as outlined in section 3. Further HE/VHE observations of G310.61.6 will certainly provide important constraints both on the PSR gamma-ray spectrum and on the PWN magnetic field strength.
References
- Abdo et al. (2009a) Abdo, A.A., et al. (Fermi Collaboration) 2009a, ApJS, 183, 46
- Abdo et al. (2009b) Abdo, A.A., et al. (Fermi Collaboration) 2009b, Science, 325, 840
- Abdo et al. (2009c) Abdo, A.A., et al. (Fermi Collaboration) 2009c, submitted to ApJ, arXiv:0910.1608
- Aharonian et al. (2005a) Aharonian, F., et al. (H.E.S.S. Collaboration) 2005a, A&A, 432, L25
- Aharonian et al. (2005b) Aharonian, F., et al. (H.E.S.S. Collaboration) 2005b, Science, 307, 1938
- Ahmad et al. (2006) Ahmad, I., et al. 2006, Phys. Rev. C, vol. 74, Issue 6, id. 065803
- Anders & Grevesse (1989) Anders, E. & Grevesse, N. 1989, Geochimica et Cosmochimica Acta, 53, 197
- Atwood et al. (2009) Atwood, W.B., et al. (Fermi Collaboration) 2009, ApJ, 697, 1071
- Berezhko & Völk (2004) Berezhko, E.G. & Völk, H.J. 2004, A&A, 427, 525
- Bietenholz & Bartel (2008) Bietenholz, M. F. & Bartel, N. 2008, MNRAS, 386, 1411
- Bird et al. (2007) Bird, A.J., et al. 2007, ApJS, 170, 175
- Blondin et al. (2001) Blondin, J.M., Chevalier, R.A. & Frierson, D.M. 2001, ApJ, 563, 806
- Bocchino et al. (2005) Bocchino, F., et al. 2005, A&A, 442, 539
- Brogan et al. (2006) Brogan, C.L., et al. 2006, ApJ, 639, L25
- Camilo et al. (2006) Camilo, F., et al. 2006, ApJ, 637, 456
- Camilo et al. (2009) Camilo, F., et al. 2009, ApJ, 700, L34
- Chaves et al. (2008) Chaves, R.C.G., et al. 2008, AIPC Proceedings, Volume 1085, pp. 219-222
- Chevalier (2005) Chevalier, R.A. 2005, ApJ, 619, 839
- Condon, Griffith & Wright (1993) Condon, J.J., Griffith, M.R., & Wright, A.E. 1993, AJ, 106, 1095
- Cordes & Lazio (2002) Cordes, J. M. & Lazio, T. J. W. 2002, preprint (arXiv:astro-ph/0207156)
- Djannati-Ataï et al. (2008) Djannati-Ataï, A., et al. 2008, 30th ICRC Proceedings, Volume 2, pp. 823-826
- Dray et al. (2005) Dray, L.M., et al. 2005, MNRAS, 364, 59
- Duncan et al. (1995) Duncan, A.R., et al. 1995, MNRAS, 277, 36
- Ferrière (2001) Ferrière, K.M. 2001, Rev. Mod. Phys, 73, 1031
- Fleishman & Bietenholz (2007) Fleishman, G.D. & Bietenholz, M.F. 2007, MNRAS, 376, 625
- Gaensler & Slane (2006) Gaensler, B.M. & Slane, P.O., ARA&A, 44, 17
- Gaensler et al. (2008) Gaensler, B.M., et al. 2008, ApJ, 680, L37
- Garmire et al. (2003) Garmire, G.P., et al. 2003, Proceedings of the SPIE, Volume 4851, pp. 28-44
- Gelfand & Gaensler (2007) Gelfand, J.D. & Gaensler, B.M. 2007, ApJ, 667, 1111
- Goldwurm et al. (2003) Goldwurm, A., et al. 2003, A&A, 411, L223
- Gotthelf et al. (2000) Gotthelf, E.V., et al. 2000, ApJ, 542, L37
- Gotthelf (2003) Gotthelf, E.V. 2003, ApJ, 591, 361
- Gotthelf & Halpern (2009) Gotthelf, E.V. & Halpern, J.P. 2009, ApJ, 700, L158
- Govoni & Feretti (2004) Govoni, F. & Feretti, L. 2004, IJMPD, 13, 1549
- Green (2009) Green, D.A. 2009, Bulletin of the Astronomical Society of India, 37, 45
- Griffith & Wright (1993) Griffith, M.R., & Wright, A.E. 1993, AJ, 105, 1666
- Güver & Özel (2009) Güver, T. & Özel, F. 2009, MNRAS, in press, arXiv:0903.2057
- Hobbs et al. (2005) Hobbs, G., et al. 2005, MNRAS, 360, 974
- Iyudin et al. (1994) Iyudin, A.F., et al. 1994, A&A, 284, L1
- Jahoda et al. (1996) Jahoda, K., et al. 1996, Proceedings SPIE, Vol. 2808, p. 59-70
- Keek, Kuiper & Hermsen (2006) Keek, S., Kuiper, L. & Hermsen, W., 2006, The Astronomer’s Telegram, 810
- Khélifi et al. (2008) Khélifi, B., et al. 2008, 30th ICRC Proceedings, Volume 2, pp. 803-806
- Li et al. (2008) Li, X.-H., Lu, F.-J. & Li, Z. 2008, ApJ, 682, 1166
- Malizia et al. (2007) Malizia, A., et al. 2007, ApJ, 668, 81
- Manchester et al. (2001) Manchester, R. N., et al. 2001, MNRAS, 328, 17
- Marshall et al. (2006) Marshall, D.J., et al. 2006, A&A, 453, 635
- Mattana et al. (2008) Mattana, F., et al. 2008, ApJ, 694, 12
- Murphy et al. (2007) Murphy, T., et al. 2007, MNRAS, 382, 382
- Possenti et al. (2002) Possenti, A., et al. 2002, A&A, 387, 993
- Prat et al. (2008) Prat, L., et al. 2008, MNRAS, 389, 301
- Renaud et al. (2004) Renaud, M., et al. 2004, ESA SP-552: 5th INTEGRAL Workshop on the INTEGRAL Universe, 81-86
- Renaud et al. (2006) Renaud, M., et al. 2006, ApJ, 647, L41
- Reynolds et al. (2008) Reynolds, S.P., et al. 2008, ApJ, 680, L41
- Richardson (2009) Richardson, D. 2009, AJ, 137, 347
- Rodriguez et al. (2009) Rodriguez, J., et al. 2009, A&A, 508, 889
- Safi-Harb et al. (2001) Safi-Harb, S., et al. 2001, ApJ, 561, 308
- Slane et al. (2000) Slane, P., et al. 2000, ApJ, 533, L29
- Taylor & Cordes (1993) Taylor, J. H. & Cordes, J. M. 1993, ApJ, 411, 674
- The et al. (2006) The, L.-S., et al. 2006, A&A, 450, 1037
- Tomsick et al. (2009) Tomsick, J.A., et al. 2009, ApJ, 701, 811
- Valinia & Marshall (1998) Valinia, A. & Marshall, F.E., 1998, ApJ, 505, 134
- Vallée (2008) Vallée, J.P. 2008, AJ, 135, 1301
- van der Swaluw et al. (2001) van der Swaluw, E., et al. 2001, A&A, 380, 309
- van der Swaluw & Wu (2001) van der Swaluw, E. & Wu, Y. 2001, ApJ, 555, L49
- Vink et al. (2001) Vink, J., et al. 2001, ApJ, 560, L79
- Wilms, Allen & McCray (2000) Wilms, J., Allen, A. & McCray, R. 2000, ApJ, 542, 914
- Wright et al. (1994) Wright, A.E., et al. 1994, ApJS, 91, 111