E. Won
Korea University, Seoul
B. R. Ko
Korea University, Seoul
H. Aihara
Department of Physics, University of Tokyo, Tokyo
K. Arinstein
Budker Institute of Nuclear Physics, Novosibirsk
Novosibirsk State University, Novosibirsk
V. Aulchenko
Budker Institute of Nuclear Physics, Novosibirsk
Novosibirsk State University, Novosibirsk
T. Aushev
École Polytechnique Fédérale de Lausanne (EPFL), Lausanne
Institute for Theoretical and Experimental Physics, Moscow
A. M. Bakich
School of Physics, University of Sydney, NSW 2006
V. Balagura
Institute for Theoretical and Experimental Physics, Moscow
E. Barberio
University of Melbourne, School of Physics, Victoria 3010
A. Bay
École Polytechnique Fédérale de Lausanne (EPFL), Lausanne
K. Belous
Institute of High Energy Physics, Protvino
V. Bhardwaj
Panjab University, Chandigarh
M. Bischofberger
Nara Women’s University, Nara
A. Bondar
Budker Institute of Nuclear Physics, Novosibirsk
Novosibirsk State University, Novosibirsk
A. Bozek
H. Niewodniczanski Institute of Nuclear Physics, Krakow
M. Bračko
University of Maribor, Maribor
J. Stefan Institute, Ljubljana
T. E. Browder
University of Hawaii, Honolulu, Hawaii 96822
P. Chang
Department of Physics, National Taiwan University, Taipei
A. Chen
National Central University, Chung-li
P. Chen
Department of Physics, National Taiwan University, Taipei
B. G. Cheon
Hanyang University, Seoul
C.-C. Chiang
Department of Physics, National Taiwan University, Taipei
I.-S. Cho
Yonsei University, Seoul
Y. Choi
Sungkyunkwan University, Suwon
J. Dalseno
Max-Planck-Institut für Physik, München
Excellence Cluster Universe, Technische Universität München, Garching
A. Das
Tata Institute of Fundamental Research, Mumbai
S. Eidelman
Budker Institute of Nuclear Physics, Novosibirsk
Novosibirsk State University, Novosibirsk
D. Epifanov
Budker Institute of Nuclear Physics, Novosibirsk
Novosibirsk State University, Novosibirsk
S. Esen
University of Cincinnati, Cincinnati, Ohio 45221
N. Gabyshev
Budker Institute of Nuclear Physics, Novosibirsk
Novosibirsk State University, Novosibirsk
A. Garmash
Budker Institute of Nuclear Physics, Novosibirsk
Novosibirsk State University, Novosibirsk
B. Golob
Faculty of Mathematics and Physics, University of Ljubljana, Ljubljana
J. Stefan Institute, Ljubljana
H. Ha
Korea University, Seoul
J. Haba
High Energy Accelerator Research Organization (KEK), Tsukuba
B.-Y. Han
Korea University, Seoul
Y. Hasegawa
Shinshu University, Nagano
K. Hayasaka
Nagoya University, Nagoya
H. Hayashii
Nara Women’s University, Nara
Y. Hoshi
Tohoku Gakuin University, Tagajo
W.-S. Hou
Department of Physics, National Taiwan University, Taipei
Y. B. Hsiung
Department of Physics, National Taiwan University, Taipei
H. J. Hyun
Kyungpook National University, Taegu
T. Iijima
Nagoya University, Nagoya
K. Inami
Nagoya University, Nagoya
R. Itoh
High Energy Accelerator Research Organization (KEK), Tsukuba
M. Iwasaki
Department of Physics, University of Tokyo, Tokyo
Y. Iwasaki
High Energy Accelerator Research Organization (KEK), Tsukuba
N. J. Joshi
Tata Institute of Fundamental Research, Mumbai
T. Julius
University of Melbourne, School of Physics, Victoria 3010
J. H. Kang
Yonsei University, Seoul
N. Katayama
High Energy Accelerator Research Organization (KEK), Tsukuba
T. Kawasaki
Niigata University, Niigata
C. Kiesling
Max-Planck-Institut für Physik, München
H. J. Kim
Kyungpook National University, Taegu
H. O. Kim
Kyungpook National University, Taegu
J. H. Kim
Sungkyunkwan University, Suwon
S. K. Kim
Seoul National University, Seoul
Y. I. Kim
Kyungpook National University, Taegu
Y. J. Kim
The Graduate University for Advanced Studies, Hayama
S. Korpar
University of Maribor, Maribor
J. Stefan Institute, Ljubljana
P. Krokovny
High Energy Accelerator Research Organization (KEK), Tsukuba
T. Kumita
Tokyo Metropolitan University, Tokyo
A. Kuzmin
Budker Institute of Nuclear Physics, Novosibirsk
Novosibirsk State University, Novosibirsk
Y.-J. Kwon
Yonsei University, Seoul
S.-H. Kyeong
Yonsei University, Seoul
J. S. Lange
Justus-Liebig-Universität Gießen, Gießen
M. J. Lee
Seoul National University, Seoul
S.-H. Lee
Korea University, Seoul
J. Li
University of Hawaii, Honolulu, Hawaii 96822
C. Liu
University of Science and Technology of China, Hefei
Y. Liu
Nagoya University, Nagoya
D. Liventsev
Institute for Theoretical and Experimental Physics, Moscow
R. Louvot
École Polytechnique Fédérale de Lausanne (EPFL), Lausanne
F. Mandl
Institute of High Energy Physics, Vienna
S. McOnie
School of Physics, University of Sydney, NSW 2006
H. Miyata
Niigata University, Niigata
Y. Miyazaki
Nagoya University, Nagoya
T. Mori
Nagoya University, Nagoya
E. Nakano
Osaka City University, Osaka
M. Nakao
High Energy Accelerator Research Organization (KEK), Tsukuba
H. Nakazawa
National Central University, Chung-li
Z. Natkaniec
H. Niewodniczanski Institute of Nuclear Physics, Krakow
S. Nishida
High Energy Accelerator Research Organization (KEK), Tsukuba
O. Nitoh
Tokyo University of Agriculture and Technology, Tokyo
T. Ohshima
Nagoya University, Nagoya
S. Okuno
Kanagawa University, Yokohama
P. Pakhlov
Institute for Theoretical and Experimental Physics, Moscow
G. Pakhlova
Institute for Theoretical and Experimental Physics, Moscow
H. Palka
H. Niewodniczanski Institute of Nuclear Physics, Krakow
C. W. Park
Sungkyunkwan University, Suwon
H. Park
Kyungpook National University, Taegu
H. K. Park
Kyungpook National University, Taegu
K. S. Park
Sungkyunkwan University, Suwon
L. S. Peak
School of Physics, University of Sydney, NSW 2006
R. Pestotnik
J. Stefan Institute, Ljubljana
M. Petrič
J. Stefan Institute, Ljubljana
L. E. Piilonen
IPNAS, Virginia Polytechnic Institute and State University, Blacksburg, Virginia 24061
A. Poluektov
Budker Institute of Nuclear Physics, Novosibirsk
Novosibirsk State University, Novosibirsk
S. Ryu
Seoul National University, Seoul
H. Sahoo
University of Hawaii, Honolulu, Hawaii 96822
Y. Sakai
High Energy Accelerator Research Organization (KEK), Tsukuba
O. Schneider
École Polytechnique Fédérale de Lausanne (EPFL), Lausanne
C. Schwanda
Institute of High Energy Physics, Vienna
M. E. Sevior
University of Melbourne, School of Physics, Victoria 3010
M. Shapkin
Institute of High Energy Physics, Protvino
V. Shebalin
Budker Institute of Nuclear Physics, Novosibirsk
Novosibirsk State University, Novosibirsk
J.-G. Shiu
Department of Physics, National Taiwan University, Taipei
B. Shwartz
Budker Institute of Nuclear Physics, Novosibirsk
Novosibirsk State University, Novosibirsk
P. Smerkol
J. Stefan Institute, Ljubljana
A. Sokolov
Institute of High Energy Physics, Protvino
E. Solovieva
Institute for Theoretical and Experimental Physics, Moscow
S. Stanič
University of Nova Gorica, Nova Gorica
M. Starič
J. Stefan Institute, Ljubljana
T. Sumiyoshi
Tokyo Metropolitan University, Tokyo
G. N. Taylor
University of Melbourne, School of Physics, Victoria 3010
Y. Teramoto
Osaka City University, Osaka
K. Trabelsi
High Energy Accelerator Research Organization (KEK), Tsukuba
S. Uehara
High Energy Accelerator Research Organization (KEK), Tsukuba
Y. Unno
Hanyang University, Seoul
S. Uno
High Energy Accelerator Research Organization (KEK), Tsukuba
P. Urquijo
University of Melbourne, School of Physics, Victoria 3010
Y. Usov
Budker Institute of Nuclear Physics, Novosibirsk
Novosibirsk State University, Novosibirsk
G. Varner
University of Hawaii, Honolulu, Hawaii 96822
K. E. Varvell
School of Physics, University of Sydney, NSW 2006
K. Vervink
École Polytechnique Fédérale de Lausanne (EPFL), Lausanne
A. Vinokurova
Budker Institute of Nuclear Physics, Novosibirsk
Novosibirsk State University, Novosibirsk
C. H. Wang
National United University, Miao Li
P. Wang
Institute of High Energy Physics, Chinese Academy of Sciences, Beijing
Y. Watanabe
Kanagawa University, Yokohama
R. Wedd
University of Melbourne, School of Physics, Victoria 3010
B. D. Yabsley
School of Physics, University of Sydney, NSW 2006
Y. Yamashita
Nippon Dental University, Niigata
M. Yamauchi
High Energy Accelerator Research Organization (KEK), Tsukuba
C. C. Zhang
Institute of High Energy Physics, Chinese Academy of Sciences, Beijing
Z. P. Zhang
University of Science and Technology of China, Hefei
V. Zhilich
Budker Institute of Nuclear Physics, Novosibirsk
Novosibirsk State University, Novosibirsk
V. Zhulanov
Budker Institute of Nuclear Physics, Novosibirsk
Novosibirsk State University, Novosibirsk
T. Zivko
J. Stefan Institute, Ljubljana
A. Zupanc
J. Stefan Institute, Ljubljana
O. Zyukova
Budker Institute of Nuclear Physics, Novosibirsk
Novosibirsk State University, Novosibirsk
Abstract
We report an improved measurement of
and branching ratios
using 605 fb-1 of data
collected with the Belle detector at the KEKB asymmetric-energy
collider.
The measured branching ratios with respect to the Cabibbo-favored modes are
= 0.18990.00110.0022
and
= 0.08030.00240.0019
where the first uncertainties are statistical and the second are systematic.
pacs:
13.25.Ft, 14.40.Lb, 11.30.Hv
Decays of charmed mesons play an important role
in understanding the sources of SU(3) flavor symmetry breaking ref:rosner .
Such a breaking can originate from
strong final-state interactions or interference between amplitudes with
the same final state.
In particular,
and ref:cc
are Cabibbo-suppressed (CS) decays that involve color-favored tree,
annihilation, and penguin diagrams. For decays, the branching ratio
deviates from the naive
expectation ref:pdg , due to the destructive interference
between color-favored and color-suppressed amplitudes
in ref:guberina .
However, converting experimental measurements of decays that include
branching ratios to those involving or is
not straightforward due to the interference between the doubly Cabibbo-suppressed
(DCS) and Cabibbo-favored (CF) decay modes where
the interference phase is unknown ref:bigi ; ref:cleo_dksk .
In decays to and final states, the
ratio of the CS decay to the corresponding CF decay may be larger than
,
since the tree diagram for
is CF but color-suppressed.
Precise measurements of branching ratios for CS and CF charmed
meson decay modes can thus improve the understanding of the
underlying dynamics of these decays.
In this paper, we report improved measurements of the
and
branching ratios with respect to the corresponding CF modes,
and ,
respectively.
The results are based on a data sample of 605 fb-1 recorded at the
(4S) resonance with the Belle detector at
the KEKB asymmetric-energy collider ref:kekb .
An additional data sample with about 10% of this
integrated luminosity recorded 60 MeV
below the (4S) was used for the
optimization of the selection criteria (off-resonance
sample).
The Belle detector is a large-solid-angle magnetic spectrometer that consists
of a silicon vertex detector (SVD), a 50-layer central drift chamber (CDC), an array of
aerogel threshold Cherenkov counters (ACC), a barrel-like arrangement of time-of-flight
scintillation counters (TOF), and an electromagnetic calorimeter comprised of CsI(Tl)
crystals located inside a superconducting solenoid coil that provides a 1.5 T
magnetic field. An iron flux return located outside the coil is instrumented
to detect mesons and to identify muons. The detector is described in detail
elsewhere ref:belle .
We require that the charged tracks originate from the vicinity of
the interaction point (IP)
with the impact parameters in the beam direction (-axis)
and perpendicular to it of less than 4 cm and 2 cm, respectively. All charged
tracks except those originating from decays
are required to have at least two associated hits in the SVD,
both in the and radial directions, to assure good
spatial resolution on the mesons’ decay vertices.
Charged tracks are identified as pions or kaons by requiring the
ratio of particle identification likelihoods,
, constructed using information
from the CDC, TOF, and ACC,
be larger or smaller than 0.6, respectively.
For both kaons and pions,
the efficiencies and misidentification probabilities are 86% and 10%, respectively.
Pairs of oppositely charged tracks that have an invariant mass within
30 MeV/ of the nominal mass are used to reconstruct
decays. The distance of the closest approach
of the candidate charged tracks to the IP
in the plane perpendicular to the
axis is required to be larger than 0.02 cm for high-momentum
( 1.5 GeV/) candidates and 0.03 cm for those with
momentum less than 1.5 GeV/. The vertex is required
to be displaced from the IP by a minimum transverse distance of
0.22 cm for high-momentum candidates and 0.08 cm for the remaining
candidates. The mismatch in the direction at the vertex
point for the tracks must be less than 2.4 cm
for high-momentum candidates and 1.8 cm for the remaining candidates.
The direction of the pion pair momentum must also agree with the direction
of the vertex point from the IP to within 0.03 rad for high-momentum
candidates and to within 0.1 rad for the remaining candidates.
These two sets of criteria in two different momentum ranges are implemented
to maximize ,
where and are the number of signal
’s and the number of combinatorial background events, respectively.
Finally, the pair forming a candidate is
required to have an invariant
mass within 9 MeV/ of the nominal mass ref:pdg .
and candidates are reconstructed using a candidate and
either a charged pion or kaon candidate.
The decay vertex is formed by fitting the and the track
to a common vertex and requiring a confidence level greater than 0.1%. In order to remove
peaking backgrounds from the and decay
modes, we compute the reduced of the vertex assuming that two pions
from the and the charm daughter track arise from a single vertex. We require
the reduced to be greater than 10.
To remove and mesons produced in meson decays,
we require the charmed meson momentum calculated in
the center-of-mass frame to be greater than 2.6 GeV/.
At this stage, reconstruction efficiencies are 16.6% for the and
18.0% for the in the final state,
and 20.6% for the and 22.4% for the in the
final state.
Highly asymmetrical pairs that have
invariant mass close to the mass region are
more likely to be background than signal.
The asymmetry,
, where each momenta is calculated in the laboratory
frame and refers to either a or ,
is used to reject background candidates.
The requirement is optimized in both CS modes
by maximizing , where
is the signal yield and is the statistical
uncertainty in from the fit to the off-resonance data sample.
The asymmetry is required to be less than 0.6 for both decay modes.
After this final requirement, we find 10% and 35% improvements
in for CS decay modes of the and
, respectively.
Since there are differences in the mass distributions between the data and
Monte Carlo (MC) simulated ref:bellemc samples, we tune
the large MC samples of generic continuum and decays,
intended mainly for the accurate parameterization of the peaking background
under the signal. This background is a consequence of particle
misidentification and will be discussed in more detail later.
The tuning procedure is as follows:
the () momentum scale and
resolution are tuned with the
() data sample.
For the momentum scale and resolution tuning,
the data sample is used.
The tuning method is validated by comparing
simulated and real data in the final state.
The four signal decay modes are simulated and results of the tuning
are also applied to them.
In the branching ratio measurements, there is a peaking background
due to particle misidentification. In the mass
region, there is a peaking structure from decays
when a is misidentified as a . A similar peaking structure in
the mass region appears due to
misidentification in decays.
The shapes and the yields of these peaking backgrounds
are obtained from the tuned simulation samples
and are used as the probability density functions (PDF)
for the peaking backgrounds.
The simulated shape and normalization of the peaking backgrounds are checked
by comparing the invariant mass distributions of
selected () pairs with the () mass
assignment changed to a () mass assignment. The
comparison shows that the simulated peaking background of the tuned
sample correctly describes these components and that
misidentification is indeed the only contribution above the structureless
combinatorial background. Uncertainties in the misidentification
probabilities are considered as a source of systematic uncertainty.
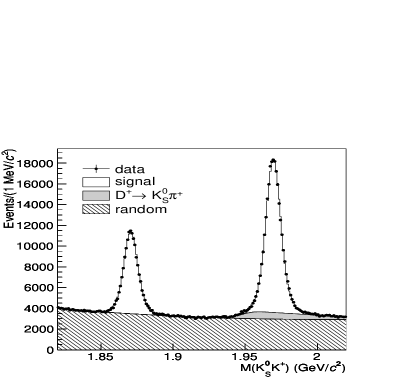
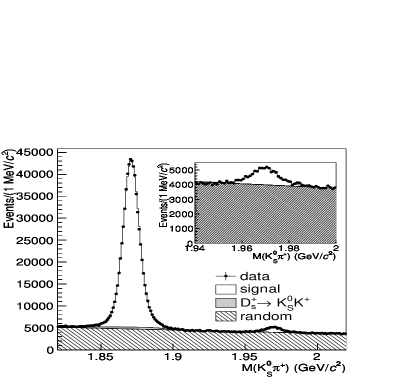
The and invariant mass distributions after the final
selections are shown in Figs. 1 and 2
together with the signal and background parameterizations.
Clear signals for CF and CS decays are observed
in both distributions. The and invariant mass distributions are
fitted using a binned maximum likelihood method. In all cases the signal
PDF is parameterized using two Gaussians with
a common mean value. For , we
fix the ratio of widths and the fractional yields in the two Gaussians
because of the low statistics.
The values of the ratio and the fraction
of the broader Gaussian are obtained from
the fit to the mode
and are consistent with the results of fits to MC simulated signal.
The reduced values of the fits are 1.8 and 2.3 for the
and final states, respectively.
The normalization of the mass distributions of the misidentified
backgrounds are fixed to the values obtained from tuned
simulation samples.
Combinatorial background PDFs are parameterized using second and
first-order polynomials for the and
final states, respectively.
All the fit parameters are allowed to float
except for the signal PDF parameters
and the yield and the normalization of the misidentified backgrounds.
Table 1 summarizes the extracted signal
yields from the fits to data and corresponding signal efficiencies
from the simulated signal samples where final-state
radiation has been included ref:photos .
Table 1: The extracted signal yields from the fits to data and
corresponding signal efficiencies () from the simulated
events of signal modes. The uncertainties are statistical only.
Decay modes
Yields
(%)
100855561
12.590.01
204093768
13.530.01
5662851162
14.190.01
17583481
15.350.01
Figure 1: Invariant mass distribution of
selected
pairs.
Points with error bars
show the data and histograms show the results of the fits described in
the text. Signal, background, and random
combinatorial background components are also shown.
Figure 2: Invariant mass distribution of
selected
pairs.
Points with error bars
show the data and histograms show the results of the fits described in
the text. Signal, background, and random
combinatorial background components are also shown.
The inset is an enlarged view of the region.
Various contributions to the systematic uncertainties for the branching
ratio measurements are summarized in Table 2.
Several sources of systematic uncertainty are reduced in ratio
measurements due to the similar kinematics of CF and CS decays. Such
sources include the tracking and asymmetry variable efficiency
differences between simulated data and real data.
However, the systematic uncertainty due to particle identification
efficiency does not cancel.
The particle identification efficiency
differences between real data and simulated events are estimated independently
using the decay followed by
and corrections from this estimate
are applied to signal efficiencies in Table 1.
These corrections
are 1.0000.007 and 0.9460.005 for and
candidates, respectively.
Uncertainties in the particle identification
corrections are included in the systematics estimate and are found to be
0.90% of the measured ratios.
In order to validate the entire analysis procedure, we fit large numbers of
simulated samples of generic continuum and decays,
and find no bias
in the procedure within the statistical uncertainties of our measurements.
We refit the data with various histogram binnings,
different fit intervals,
and different combinatorial background PDFs.
We also refit the data in the and samples separately.
We estimate 0.74% and 2.00% of the measured ratios as the systematic
uncertainties due to variations in fit methods for the and
modes, respectively. Particle identification and the associated normalizations
of the misidentified background yields in fits
are also estimated using the measured misidentification rates
and found to be 0.16% and
0.62% of the measured ratio for the and modes, respectively.
Finally, systematic effects due to the extra constraints in
the signal PDF are estimated by
refitting the data allowing the fixed parameters to change within their
one standard deviation uncertainties. This gives a negligible effect in
decays but there is a systematic effect corresponding to 0.37% of the
measured ratio in decay modes.
Table 2 summarizes the systematic uncertainties in the
branching ratio measurements.
Table 2: Relative systematic uncertainties in percent,
where and are
systematic uncertainties for branching ratios of
and decays. Sources include particle identification (PID),
fit methods, peaking background, and the signal PDF.
Source
(%)
(%)
PID
0.90
0.90
Fit methods
0.74
2.00
Peaking background
0.16
0.62
signal PDF
-
0.37
Total
1.18
2.31
With the signal efficiencies and the corrections due to particle
identification efficiency differences, we find the branching ratios to be
where the first uncertainties are statistical and the second are systematic.
These are the most precise measurements to date and are compared to
the present world average values in Table 3.
Our measurement of is
in good agreement with previous measurements ref:pdg
and is larger than the
naive expectation of ,
consistent with the expected destructive interference effect mentioned
earlier. For decays, there is no such interference and
is found to be greater than
by more than eight standard deviations,
consistent with previous measurements ref:pdg .
This large deviation may be due to the
color-suppression of the main amplitude.
Table 3: Branching ratios for the and the ,
and comparisons with previous measurements. The uncertainties shown combine
the statistical and systematic uncertainties of our
results.
To conclude, using 605 fb-1 of data collected with the Belle detector
at the KEKB asymmetric-energy collider
we have measured the
and
branching ratios
with respect to the corresponding Cabibbo-favored modes. The results are
= 0.18990.00110.0022
and
= 0.08030.0024 0.0019,
where the first uncertainties are statistical and the second are systematic.
Using the world average values of CF decay rates ref:pdg , we obtain
the branching fractions
= (2.750.08)10-3
and
= (1.200.09)10-3
where the uncertainties are the sum in quadrature of statistical and
systematic errors.
These are consistent with the present world averages ref:pdg
and are the most precise measurements to date. The ratio
/ = 2.290.18
may be due to SU(3) flavor breaking and/or different
final-state interactions in and decays.
We thank the KEKB group for the excellent operation of the
accelerator, the KEK cryogenics group for the efficient
operation of the solenoid, and the KEK computer group and
the National Institute of Informatics for valuable computing
and SINET3 network support. We acknowledge support from
the Ministry of Education, Culture, Sports, Science, and
Technology (MEXT) of Japan, the Japan Society for the
Promotion of Science (JSPS), and the Tau-Lepton Physics
Research Center of Nagoya University;
the Australian Research Council and the Australian
Department of Industry, Innovation, Science and Research;
the National Natural Science Foundation of China under
contract No. 10575109, 10775142, 10875115 and 10825524;
the Department of Science and Technology of India;
the BK21 and WCU program of the Ministry Education Science and
Technology, the CHEP SRC program and Basic Research program (grant No.
R01-2008-000-10477-0) of the Korea Science and Engineering Foundation,
Korea Research Foundation (KRF-2008-313-C00177),
and the Korea Institute of Science and Technology Information;
the Polish Ministry of Science and Higher Education;
the Ministry of Education and Science of the Russian
Federation and the Russian Federal Agency for Atomic Energy;
the Slovenian Research Agency; the Swiss
National Science Foundation; the National Science Council
and the Ministry of Education of Taiwan; and the U.S. Department of Energy.
This work is supported by a Grant-in-Aid from MEXT for
Science Research in a Priority Area (“New Development of
Flavor Physics”), and from JSPS for Creative Scientific
Research (“Evolution of Tau-lepton Physics”).
References
(1)
B. Bhattacharya and J. L. Rosner,
Phys. Rev. D 77, 114020 (2008).
(2)
Throughout this paper,
the inclusion of the charge-conjugate decay mode is implied
unless otherwise stated.
(3)
C. Amsler et al. (Particle Data Group), Phys. Lett. B 667, 1 (2008).
(4)
B. Guberina, S. Nussinov, R. D. Peccei and R. Rückl,
Phys. Lett. 89B, 111 (1979).
(5)
I. I. Bigi and H. Yamamoto,
Phys. Lett. B 349, 363 (1995).
(6)
M. Bishai et al., (CLEO Collab.),
Phys. Rev. Lett. 78, 3261 (1997).
(7)
S. Kurokawa and E. Kikutani, Nucl. Instr. and Meth. A 499, 1 (2003), and
other papers included in this volume.
(8)
A. Abashian et al. (Belle Collab.), Nucl. Instr. and Meth. A 479, 117 (2002).
(9)
events are generated with Pythia
(T. Sjstrand et al., Comput. Phys. Commun. 135, 238
(2001)) and decay with EvtGen
(http://www.slac.stanford.edu/~lange/EvtGen); the detector response is
simulated with geant 3.21 (R. Brun et al., CERN Report
No. DD/EE/84-1, (1984)).
(10)
E. Richter-Was, Phys. Lett. B 303, 163 (1993).