Cross-Correlation of Diffuse Synchrotron and Large-Scale Structures
Abstract
We explore for the first time the method of cross-correlation of radio synchrotron emission and tracers of large-scale structure in order to detect the diffuse IGM/WHIM. We performed a cross-correlation of a 34 area of 2MASS galaxies for two redshift slices (0.03 z 0.04 and 0.06 z 0.07) with the corresponding region of the 1.4 GHz Bonn survey. For this analysis, we assumed that the synchrotron surface brightness is linearly proportional to surface density of galaxies. We also sampled the cross-correlation function using 24 distant fields of the same size from the Bonn survey, to better assess the noise properties. Though we obtained a null result, we found that by adding a signal weighted by the 2MASS image with a filament (peak) surface brightness of 1 (7) mK and 7 (49) mK would produce a 3 positive correlation for the 0.03 z 0.04 and 0.06 z 0.07 redshift slices respectively. . These detection thresholds correspond to minimum energy magnetic fields as low as 0.2 G, close to some theoretical expectations for filament field values. This injected signal is also below the rms noise of the Bonn survey, and demonstrates the power of this technique and its utility for upcoming sensitive continuum surveys such as GALFACTS at Arecibo and those planned with the Murchison Widefield Array (MWA).
keywords:
galaxies: clusters — intergalactic medium1 Introduction
In the current cosmological paradigm, 95% of the mass/energy density of the universe is composed of dark energy and dark matter, both of which have yet to be directly detected. The remaining 5% are ordinary baryons, which at redshifts of z 2 are fully accounted for based on Ly forest observations of the photoionised intergalactic medium (IGM) and ordinary galaxies (e.g. Rauche et al. 1997; Weinberg et al. 1997; Schaye 2001). In the current epoch though, roughly half of these baryons are missing. Simulations suggest that the collapsing diffuse IGM was shock-heated and now resides in filaments as T105 - 107 K WHIM, where it is practically invisible at most wavelengths (Cen & Ostriker 1999, 2006; Davé et al. 2001). A few tentative absorption detections of the coolest WHIM components using OVII and OVIII have been reported, but they give no information on the spatial distribution. However, shocks from infall into and along the filamentary structures between clusters are now widely expected to generate relativistic plasmas which track the distribution of the WHIM (Keshet et al. 2004; Pfrommer et al. 2006; Ryu et al. 2008; Skillman et al. 2008); indeed, merger/accretion shocks are seen as polarized radio sources (the “peripheral relics”) at the edges of the dense X-ray gas in clusters. This radio emission also has the potential for probing into the lower density regions further from cluster cores. When such features are detected, they can be used to set limits on the pressure of the (invisible) thermal gas, delineate shock structures, and illuminate large scale magnetic fields. The next generation of low frequency radio telescopes (e.g., LOFAR, MWA, LWA, and eventually SKA), as well as current deep continuum surveys (e.g., GALFACTS111http://www.ucalgary.ca/ras/GALFACTS/ at Arecibo), have the potential to map this steep-spectrum, “cosmic-web” of synchrotron emission (Battaglia et al. 2009).
However, there are two major problems that will challenge future radio surveys in their efforts to detect this emission. 1) Disentangling the extragalactic signal from diffuse Galactic emission that has higher surface brightness and similar angular scale; 2) Determining the redshift of the diffuse extragalactic signal (e.g., Brown & Rudnick 2009).
One possible solution is to cross-correlate large field-of-view synchrotron maps with optical/IR tracers of large-scale structure (LSS; Keshet et al. 2004). The cross-correlation function (CCF) has long been used as means of detecting faint emission, often below the image sensitivity, in CMB maps such as the SZ and late ISW effects (e.g., Boughn & Crittenden 2004). Cross-correlation can detect signals that are buried deep in the noise when the noise is not spatially correlated with the tracer image. In this case, the Galactic synchrotron “noise” is not expected to be spatially correlated with the large-scale distribution of galaxies, while the synchrotron emitting relativistic plasma associated with the WHIM is correlated (Battaglia et al. 2009). Attempts to detect the WHIM with cross-correlation using the SZ effect has been tried with WMAP and 2MASS data (e.g., Hernandez-Monteagudo et al. 2004; Hansen et al. 2005; Cao et al. 2006), without success. In this paper we outline the first attempt to detect a correlation between synchrotron radio emission and large-scale structure, and demonstrate the power of cross-correlation by detecting simulated emission added into the synchrotron images. In this paper, we assume , , .
2 Cross-Correlation
2.1 Images
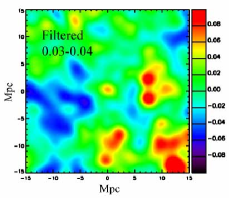
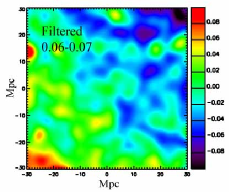
Synchrotron emission in filamentary large-scale structure (LSS) is predicted to be on the order of 1-2 Mpc across, similar to some observed radio relics around rich X-ray clusters (see Giovannini & Feretti 2004 for a review). For nearby redshifts, this corresponds to angular scales of (20-40). Therefore we used the Stockert 25m, 1.4 GHz Bonn survey (Reich, 1982; Reich & Reich, 1986) with its 36 resolution as a synchrotron tracer. This survey has an effective sensitivity of 50 mK (3rms noise); since it is a low-resolution, single dish survey, it is more sensitive to large-scale diffuse emission, and the relative contribution from point-sources is reduced significantly. We chose a target field, 34 centered on 16h00m00s +35d00m00s, where the diffuse Galactic emission was smooth and relatively well behaved. Figure 1 shows the 1.4 GHz radio map, with 600 pixels of 3.4′ each. Most of the signal in the image is diffuse Galactic emission, and the rest is dominated by systematic striping and unresolved radio galaxies.
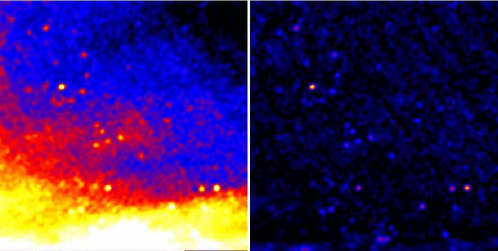
We filtered out the diffuse Galactic synchrotron emission using the multi-scale filtering technique of Rudnick (2002). The choice of filtering size is a compromise between the need to remove as much as possible of the Galactic emission while preserving the filamentary component. For this initial experiment, we filtered out all emission larger than 180′, or 5 times the size of the Bonn beam. As long as the filaments are significantly narrower than 180′, they will not be filtered out, independent of their length (see, e.g., results on jets in Rudnick, 2002). Further experimentation to optimize this will be important for future studies. Figure 1 shows the target field after filtering.
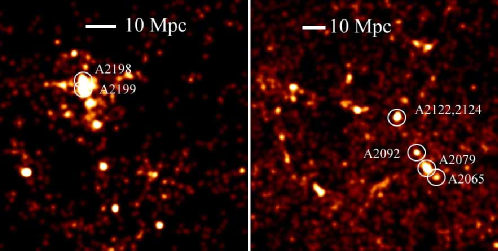
For a tracer of LSS in our target field, we used the 2MASS survey (Skrutskie et al. 2006) to create maps of the surface density of galaxies (number of galaxies/pixel) for 2 redshift slices (0.03 z 0.04 and 0.06 z 0.07). We then convolved the 2MASS maps to 36′, the resolution of the Bonn survey. Figure 1 shows the 2MASS images. The large concentration of galaxies in the 0.03 z 0.04 image corresponds to the two clusters Abell 2199 and 2197 at redshifts of 0.0301 and 0.0308, respectively. The 0.06 z 0.07 image contains Abell clusters 2122, 2124, 2079, and 2065 at redshifts of 0.0661, 0.0656, 0.0670, and 0.0726, respectively.
2.2 Cross-Correlation
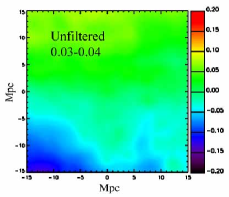
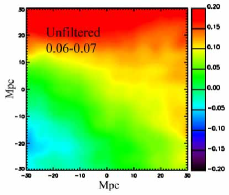
We computed the cross-correlation function (CCF) for the filtered and unfiltered radio images with both redshift slices. The CCF is defined by
where is a normalization given by , R is the radio map, G is the convolved 2MASS surface density of galaxies shifted in relation to R by and pixels, and the sum is over every pixel {i,j} in the overlapping region of the images. and are average values for the radio and galaxy surface-density maps respectively. Figure 2 shows the CCF, with the shift in units of Mpc at the redshift of the 2MASS images, for both redshift slices cross-correlated with the Bonn images. It is obvious that the large-scale gradient in the Galactic synchrotron emission is dominating the CCF in the unfiltered images. The gradient is due to the fact that the power in the 2MASS galaxy distributions are concentrated in a few small regions. This is especially evident at 0.03 z 0.04, where there is one dominant clump of galaxies which dominated the cross-correlation signal and causes the gradient when correlated with the Galactic synchrotron gradient. The CCF for the filtered images is not significantly peaked at zero shift, i.e., the filtered synchrotron and 2MASS surface densities are not significantly correlated.
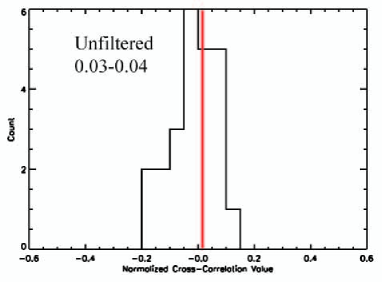
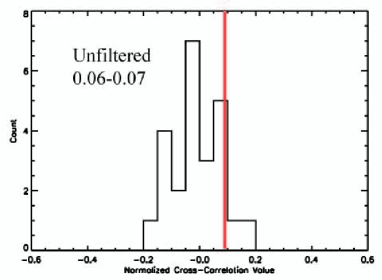
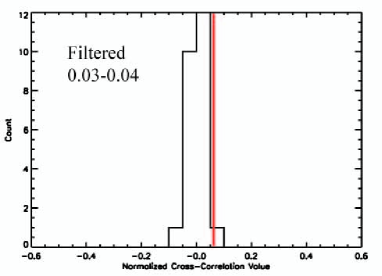
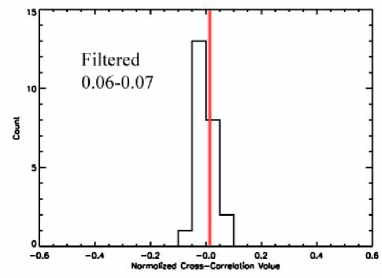
When cross-correlating all-sky images, such as done with the CMB, the significance of a given CC value is assessed by using simulated CMB signals (e.g., McEwen et al. 2007). In the initial experiments peformed here, we are using only a 34 34∘ field, and can therefore use other fields from the Bonn survey as additional controls to better assess the noise properties. This is important because of the systematic striping in the Bonn survey, and the fact that diffuse Galactic emission is not a simple Gaussian field like the CMB. This initial study sampled the cross-correlation function using fields from the Bonn survey at distances () ranging from 27∘ to 127∘ from our target field. We split the survey up into 34 images with 600 pixels on a side and TAN projection (Greisen & Calabretta 2002; Calabretta & Greisen 2002), and excised all the fields with strong Galactic plane emission. Fields with significant artifacts from gridding the survey maps together were also removed, leaving 24 total images. Assuming that none of the 24 maps should be correlated with the surface density of galaxies in a different, well separated region of the sky, the distribution of these CC values (histograms are shown in Fig. 3) represents the noise in this procedure. The CCF() value for the target field is marked with a red line; in all cases the 2MASS-Bonn correlation for the target field is again not significant. Note that the scatter is dramatically lower using filtered images.
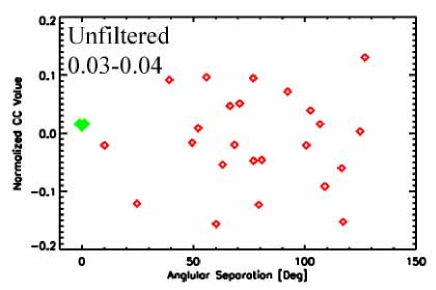
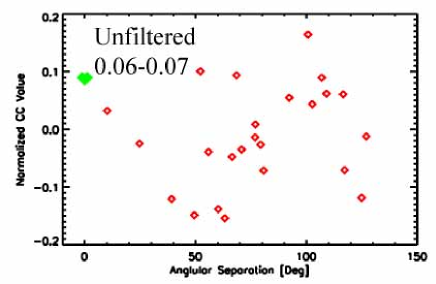
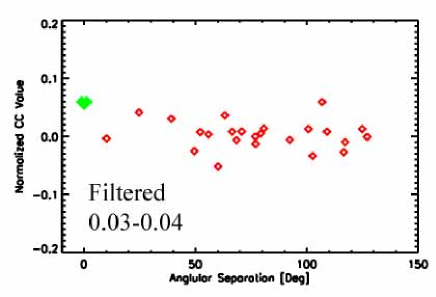
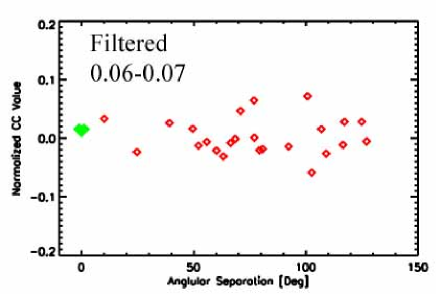
One can think about this procedure as constructing a sparsely sampled CCF() over the whole sky. Figure 4 shows plots of the CCF as sampled by the 24 distant fields as a function of angular distance from the target field (which here is CCF()). These again show that the target CC value is not significantly above the values for the well-separated control fields.
2.3 Detection Thresholds
In order to assess our sensitivity to diffuse synchrotron signals associated with large-scale structure, we next injected a simulated filamentary, LSS radio signal into the Bonn images before cross-correlation. As a simple model, we assumed the synchrotron LSS signal is linearly proportional to the number-density of galaxies. Our model assumes that each galaxy in the redshift bin emits a certain number of mJy at 1.4 GHz (the same for each galaxy), which is then convolved by the 36′ Bonn beam and added incrementally into the original Bonn radio map. The injected signal is a clumpy distribution of surface-brightness that traces clumps of galaxies, and mimics the bottom two panels in Fig. 1 exactly except for an overall multiplicative factor. The detection threshold is defined as the number of mJy/galaxy needed to get a cross-correlation signal at =0 that is 3 times the rms distribution of the sparsely sampled CC function (Figures 3 & 4). We did this separately for both the filtered and unfiltered Bonn images and both redshift ranges. The peak and typical filamentary structure values of the injected signal in mK are also listed in Table 1. In the case of the filtered Bonn image correlated with each redshift, the peak signal needed to cause a 3 detection is below the 3rms sensitivity level of the Bonn survey, because many different independent beams are included in the CC.
We also looked briefly at the issue of isolating the CC contribution of the dense cluster-like concentrations in 2MASS from the contribution from more diffuse filamentary structures. To explore this, we repeated the signal injection experiment with the z=0.03-0.04 image and the filtered Bonn image, except that this time we removed the bright clumps by only adding in signals that were below 5 of the 2MASS image. In this case the detection threshold rises significantly, to peak and filament values of 19 mK and 11 mK, respectively. We note that these values are still well below the sensitivity of the Bonn survey for any given location.
| Unfiltered 0.03z0.04 | Unfiltered 0.06z0.07 | Filtered 0.03z0.04a | Filtered 0.06z0.07 | |
|---|---|---|---|---|
| (mK) | (mK) | (mK) | (mK) | |
| Peak | 694 | 570 | 7[19] | 49 |
| Filament | 100 | 80 | 1[11] | 7 |
| mJy/Galb | 205 | 135 | 2 | 12 |
| Filament Beq (G) | 0.74f-2/7 | 0.70f-2/7 | 0.20f-2/7 | 0.35f-2/7 |
a: Bracketed values are thresholds when including signals from filaments only (see text).
b: The flux required per galaxy to reach the detection threshold.
c: f is the volume filling factor of the synchrotron emission
3 Physical Expectations/Interpretations
How do these simulated radio signals compare to theoretical expectations for filamentary synchrotron emission? Resent cosmological simulations (Ryu et al 2008) demonstrated that strong turbulence driven by structure shocks associated with the WHIM can generate current epoch (volume averaged) filament magnetic fields of the order of 0.01 G. However, the synchrotron emissivity scales as B2, and under the assumption that the total number of relativistic particles will scale with local mass density, the mass weighted rms of B is appropriate. This yields a considerably higher characteristic value of 0.2G in filaments (Ryu, private communication, 2008). In order to convert this magnetic field estimate to a characteristic synchrotron brightness, we need to make some assumption about the cosmic ray density. We adopt the condition where the energy density in relativistic particles (protons and electrons, equally) is the same as the magnetic field energy density, (equipartition). This results in a synchrotron brightness at 1.4 GHz of 1 mK in filaments. This predicted value is much weaker than the 50mK background brightness temperature predicted by Keshet et al. (2004). We note that there is considerable uncertainty regarding the actual magnetic strength in filaments. Donnert et al. (2008), e.g., find only 0.005 G.
Table 1 lists the equipartition magnetic fields corresponding to our detection thresholds. Our lowest thresholds approach those expected in the Ryu et al. (2008) simulations, when the appropriate mass-weighted rms averaging is done. With more sensitive future 1.4 GHz surveys such as GALFACTS, we will be able to robustly test those expectations, although it is not yet clear whether we can reach an average field strength of 0.005 G (Donnert et al. 2008).
To put our CC brightness limits in context, we note that even bright radio halos such as in the Coma cluster (with 20′ FWHM, e.g., Kim et al. 1989) are very difficult to detect individually. The Coma halo in the Bonn survey is a barely detected 150 mK bump on the 3.3 K CMB + Galactic local background, mostly due to the fact that the brightness is diluted by the 36′ beam. Typical currently known halos have brightnesses of 700 mK, brighter than the intrinsic 350-400 mK brightness of the Coma cluster halo. As discussed in Rudnick & Lemmerman (2009), visual searches for halos are biased towards higher brightnesses at higher redshifts.
The fact that the detection thresholds (Table 1) are below the predicted values of Ryu et al. (2008) and Keshet et al. (2004) do not rule out these models. Important effects such as the filling factor of the synchrotron emission and the linear nature of the LSS formation shocks are not captured by our simple model. However, analysis of LSS formation simulations that include synchrotron emission can be used in the future to design the optimum CC procedure for detecting this emission, and would guide the way toward the correct interpretation of future cross-correlation results. The ultimate goal is to provide limits on magnetic field strengths and pressure of the relativistic plasma in filaments, and therefore test origin theories for cosmic magnetism and probe the missing baryons in the WHIM.
4 Summary
We have explored for the first time the method of cross-correlation of diffuse radio emission and tracers of LSS in order to detect the synchrotron radiation associated with the diffuse baryons in the WHIM. Filtering out the large-scale Galactic emission is critical for reducing the CC noise. We demonstrated that, if the filamentary radio signal is traced perfectly by the distribution of galaxies, emission significantly below the sensitivity of the Bonn survey can be statistically detected. Our detection thresholds are already at a level expected in some models, and dramatic improvements using new surveys will be possible in the future.
Further refinements to the CC technique, including subtraction of point sources which also trace the LSS, will also improve its use as a detection tool for the diffuse baryons in filaments. The assumption of perfect correspondence between the distribution of galaxies and IGM radio emission is clearly an oversimplification, and further experimentation with numerical simulations is needed.
Partial support for this work at the University of Minnesota comes from the U.S. National Science Foundation grant AST 0607674. We acknowledge the use of NASA’s SkyView facility located at NASA Goddard Space Flight Center. SB also acknowledges support from a Doctoral Dissertation Fellowship from the Graduate School of the University of Minnesota.
References
- Battaglia et al. (2009) Battaglia, N., Pfrommer, C., Sievers, J. L., Bond, J. R., & Enßlin, T. A. 2009, MNRAS, 155
- Brown & Rudnick (2009) Brown, S., & Rudnick, L. 2009, AJ, 137, 3158
- Cen & Ostriker (1999) Cen, R., & Ostriker, J. P. 1999, ApJ, 514, 1
- Cen & Ostriker (2006) Cen, R., & Ostriker, J. P. 2006, ApJ, 650, 560
- Cao et al. (2006) Cao, L., Chu, Y.-Q., & Fang, L.-Z. 2006, MNRAS, 369, 645
- Condon et al. (1998) Condon, J. J., Cotton, W. D., Greisen, E. W., Yin, Q. F., Perley, R. A., Taylor, G. B., & Broderick, J. J. 1998, AJ, 115, 1693
- Davé et al. (2001) Davé, R., et al. 2001, ApJ, 552, 473
- Donnert et al. (2009) Donnert, J., Dolag, K., Lesch, H., Muumlller, E. 2009, MNRAS, 392, 1008
- Giovannini & Feretti (2004) Giovannini, G., & Feretti, L. 2004, Journal of Korean Astronomical Society, 37, 323
- Hansen et al. (2005) Hansen, F. K., Branchini, E., Mazzotta, P., Cabella, P., & Dolag, K. 2005, MNRAS, 361, 753
- Hernández-Monteagudo et al. (2004) Hernández-Monteagudo, C., Genova-Santos, R., & Atrio-Barandela, F. 2004, ApJ, 613, L89
- Keshet et al. (2004) Keshet, U., Waxman, E., & Loeb, A. 2004, ApJ, 617, 281
- Kim et al. (1989) Kim, K.-T., Kronberg, P. P., Giovannini, G., & Venturi, T. 1989, Nat, 341, 720
- McEwen et al. (2007) McEwen, J. D., Vielva, P., Hobson, M. P., Martínez-González, E., & Lasenby, A. N. 2007, MNRAS, 376, 1211
- Pfrommer et al. (2006) Pfrommer, C., Springel, V., Enßlin, T. A., & Jubelgas, M. 2006, MNRAS, 367, 113
- Rauch et al. (1997) Rauch, M., et al. 1997, ApJ, 489, 7
- Rudnick (2002) Rudnick, L. 2002, PASP, 114, 427
- Rudnick & Lemmerman (2009) Rudnick, L., & Lemmerman, J. 2009, arXiv:0903.0335
- Reich (1982) Reich, W. 1982, A&AS, 48, 219
- Reich & Reich (1986) Reich, P., & Reich, W. 1986, A&AS, 63, 205
- Ryu et al. (2008) Ryu, D., Kang, H., Cho, J., & Das, S. 2008, Science, 320, 909
- Schaye (2001) Schaye, J. 2001, ApJ, 562, L95
- Skillman et al. (2008) Skillman, S. W., O’Shea, B. W., Hallman, E. J., Burns, J. O., & Norman, M. L. 2008, ApJ, 689, 1063
- Skrutskie et al. (2006) Skrutskie, M. F., et al. 2006, AJ, 131, 1163
- Weinberg et al. (1997) Weinberg, D. H., Miralda-Escude, J., Hernquist, L., & Katz, N. 1997, ApJ, 490, 564