The nature of the X-ray binary IGR J19294+1816 from INTEGRAL, RXTE, and Swift observations
We report the results of a high-energy multi-instrumental campaign with INTEGRAL, RXTE, and Swift of the recently discovered INTEGRAL source IGR J19294+1816. The Swift/XRT data allow us to refine the position of the source to RAJ2000= 19h 29m 55.9s DecJ2000=+18∘ 18′ 38.4″ (″), which in turn permits us to identify a candidate infrared counterpart. The Swift and RXTE spectra are well fitted with absorbed power laws with hard () photon indices. During the longest Swift observation, we obtained evidence of absorption in true excess to the Galactic value, which may indicate some intrinsic absorption in this source. We detected a strong (P=40%) pulsation at s that we interpret as the spin period of a pulsar. All these results, coupled with the possible 117 day orbital period, point to IGR J19294+1816 being an HMXB with a Be companion star. However, while the long-term INTEGRAL/IBIS/ISGRI 18–40 keV light curve shows that the source spends most of its time in an undetectable state, we detect occurrences of short ( s) and intense flares that are more typical of supergiant fast X-ray transients. We therefore cannot make firm conclusions on the type of system, and we discuss the possible implications of IGR J19294+1816 being an SFXT.
Key Words.:
X-rays: binaries ; Accretion, accretion disks ; Stars: individual: IGR J19294+1816, IGR J112155952, IGR J1848303111 Introduction
The INTErnational Gamma-Ray Astrophysics Laboratory (INTEGRAL) has permitted
a large number of new sources to be discovered. Amongst the new
sources111see http://isdc.unige.ch/rodrigue/html/igrsources.html for an up to date
list of all sources and their properties., INTEGRAL has unveiled two new or poorly-known
types of high mass X-ray binaries (HMXB):
the very absorbed supergiant HMXBs, and the supergiant fast X-ray
transients (SFXT). While all types of HMXBs (including those hosting a Be star, Be-HMXBs)
are powered by accretion of material by a compact object, understanding the nature of
a system is very important for studying the evolutionary paths of source populations, and more globally, the evolution of the Galaxy in terms of its source
content.
IGR J19294+1816 was discovered by Tuerler et al. (2009) who reported activity of
this source
seen with INTEGRAL during the monitoring campaign of GRS 1915+105 (e.g. Rodriguez et al., 2008a). Archival Swift data of a source named Swift J1929.8+1818 allowed us to give a
refined X-ray position of RAJ2000= 19h 29m 55.9s and DecJ2000=+18∘ 18′ 39″ (″)
which we used to locate a possible infrared counterpart (Rodriguez et al., 2009).
We also suggested that the Swift and INTEGRAL sources are the same and that activity from IGR J19294+1816 had been seen with Swift in the past. The temporal analysis of the XRT light curve showed
a possible pulsation at 12.4 s (Rodriguez et al., 2009).
Analysis of Swift/BAT archival data revealed that the source had
been detected on previous occasions with a periodicity at 117.2 days
(Corbet & Krimm, 2009) that we interpreted as the orbital period of the system.
Soon after the discovery of the source with INTEGRAL, we triggered our accepted RXTE and
Swift programmes for follow-up observations of new INTEGRAL sources (PI Rodriguez). A preliminary
analysis of the real-time RXTE data allowed us to confirm the pulsations
in the signal from the source (Strohmayer et al., 2009) at a barycentred period of
12.44 s indicating
that this object hosts an accreting X-ray pulsar. Here we report the detailed analysis of the INTEGRAL,
Swift, and RXTE observations. We begin this paper by detailing the procedures employed for the
data reduction. We then describe the results (refined position, X-ray spectral,
and temporal analyses) in Sects. 3, 4, 5, and 6, and discuss them in Sect. 7.
2 Observations and data reduction
The log of the Swift and RXTE observations of IGR J19294+1816 is given in Table 1.
The LHEASOFT v6.6.2 suite was used to reduce the Swift and RXTE data.
The RXTE/PCA data were reduced in a standard way, restricting it to the times when
the elevation angle above the Earth was greater than 10∘, and when the offset pointing was less than
0.02∘. We accumulated spectra from the top layer of proportional counter unit 2 (PCU 2),
the only one that was active during all the observations, and therefore time-filtered the
data for PCU 2 breakdown. The background was estimated using the faint model.
In addition,
we produced event files from Good Xenon data with make_se, from which we
extracted s ( s) light curves between 2 and 20.2 keV
(absolute channels 5 to 48 in order to limit the instrumental background at low and high
energies) with seextrct. Light
curves with 1-s time resolution were obtained in the 2–60 keV range from standard 1 data. These light curves
were then corrected for the background and used for the temporal analysis.
The Swift/XRT data were first processed with the xrtpipeline v0.12.2 tool to
obtain standardly filtered level 2 event files. Images, light curves, and spectra were extracted
within XSELECT V2.4a. Source light curves and spectra were extracted from a
circular region of 20 pixels radius centred on the most accurate source position available. We tested different
regions of extraction for the background light curves and spectra, and obtained no significant
differences. For the remainder of the analysis, the background region is a circular region of 60
pixels radius centred at RA=19h 29m 41.8s and
Dec=+18∘ 21′ 11.5″. The ancillary
response file was obtained with xrtmkarf 0.5.6 after taking the exposure map
into account (see Rodriguez et al., 2008b, for more details).
| Satellite | Date start | Exposure time | Name |
|---|---|---|---|
| (MJD) | (s) | ||
| Swift | 54443.051 | 7959 | S1 |
| Swift | 54447.013 | 3457 | S2 |
| RXTE | 54921.315 | 2600 | X1 |
| RXTE | 54921.708 | 3344 | X2 |
| RXTE | 54922.813 | 3344 | X3 |
| RXTE | 54923.730 | 1440 | X4 |
| Swift | 54925.814 | 2565 | S3 |
| RXTE | 54925.826 | 3360 | X5 |
We also analysed all INTEGRAL public pointings
aimed at less than 10∘ from the position of IGR J19294+1816 plus all private data
of our monitoring
campaign on GRS 1915+105. The Offline Scientific Analysis Software (OSA) v7.0 was used for
the INTEGRAL data reduction. We further filtered the list of science windows (SCW)
to those where the
good exposure time of ISGRI was greater than 1000 s. After omitting the bad pointings (e.g.
first or last pointings before the instruments are switched off due to passage through the
radiation belts) this resulted in a total of 1476
good SCWs. These pointings were blindly searched
for the presence of the source (see Rodriguez et al. (2008a) for the procedure of
data reduction and source searching). An updated catalogue containing IGR J19294+1816 with the most precise Swift position was given as an input to the software. Mosaics were accumulated on
a revolution basis, but this results in mosaics of very different exposure times.
Note that even in revolution 788, where we confirm the detection reported by
Tuerler et al. (2009), the source is too dim for further spectral analysis.
3 IGR J19294+1816 as seen with INTEGRAL
IGR J19294+1816 was discovered on March 27, 2009 (revolution 788, MJD 54917 Tuerler et al., 2009).
A re-analysis of the consolidated data allowed us to confirm a source detection
during this observation. The source was detected at 10.7
between 18 and 40 keV, with a flux of about 17 mCrab222The count
rate to Crab conversion is based on an analysis of the Crab observation
performed during rev. 774, with 1 Crab cts/s..
A re-analysis of the previous observation on March 21, 2009 (rev. 786, MJD 54911),
led to a detection in the 18–40 keV energy range with a significance of
4.5 and a flux of 7.2 mCrab. IGR J19294+1816 was not detected on
April 4, 2009 (rev 790, MJD 54925) with a 18–40 keV 3- upper limit
of about 5 mCrab. The source was not detected in any of the
mosaics from the previous revolution. However, given the very different exposure times we
used in building the mosaics and the periodicity of the source activity seen
with Swift/BAT (Corbet & Krimm, 2009), this may simply indicate that the periods of
activity of the source are short.
Examining these data on a SCW basis shows that the source was detected on a few occurrences.
In particular, it was clearly detected during an observation in rev. 435 (MJD 53861) and during
another pointing in
rev. 482 (MJD 54004). In the former, IGR J19294+1816 was detected in SCW 9 (19.17–19.77 h UTC) with
a 18–40 keV flux of 33.7 mCrab. It was not detected in the following
SCW (19.85–20.50 h) with a 3- upper limit of 11.6 mCrab. No pointings are
available before SCW 9. The 18–40 keV light curve of this epoch is reported in Fig. 1.
In rev. 482, the source was detected in SCW 51 (1.05–2.03 h UTC)
at a 18–40 keV flux of 22 mCrab (5.4 ). It was not detected in the
previous and following SCWs with respective 3- upper limits of
11.0 and 13.9 mCrab.

4 Refining the X-ray position, and the search for counterparts
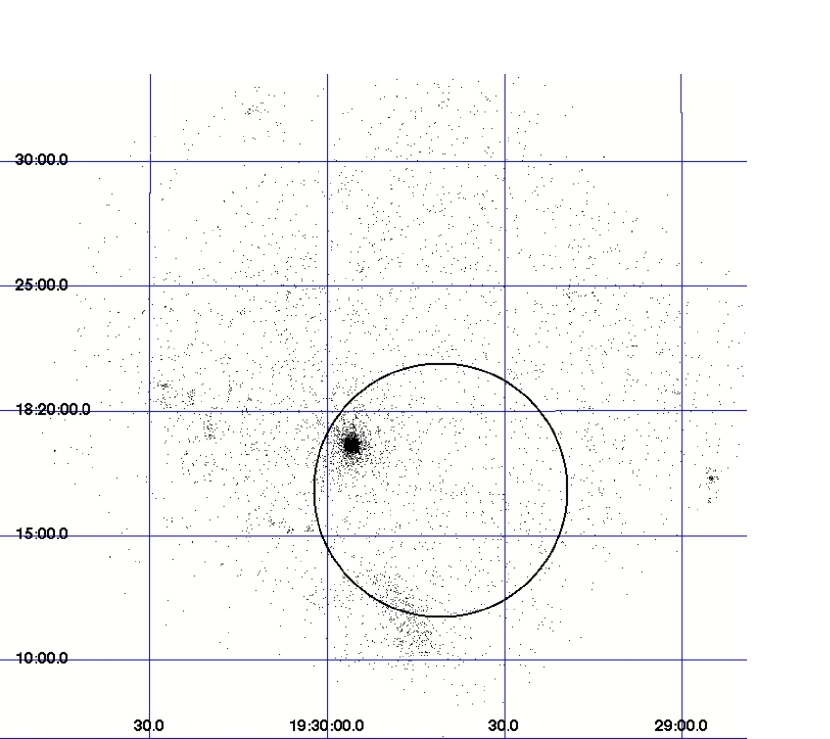
We combined all Swift observations to create a mosaic image of the field.
As shown in Fig. 2, a single bright X-ray source can be seen
within the ′ 90% error circle of the INTEGRAL position given in
Tuerler et al. (2009). This source lies at (as obtained with xrtcentroid)
RAJ2000=19h 29m 55.9s and DecJ2000=+18∘ 18′ 38.4″ with an uncertainty of 3.5″. Note that this is slightly different from the preliminary
position given in Rodriguez et al. (2009), but the two positions are clearly compatible.
Given the addition, here, of an additional Swift pointing to obtain these coordinates, we consider this
position as the most precise one.
We searched for counterparts in catalogues available online such as the 2 Microns All Sky Survey point source and extended source catalogues333http://www.ipac.caltech.edu/2mass/ (2MASS and 2MASX, Skrutskie et al., 2006), the National Radio Astronomy Observatory VLA Sky Survey (NVSS, Condon et al., 1998), and the catalogue of the US Naval Observatory (USNO444http://www.usno.navy.mil/USNO/astrometry/optical-IR-prod/icas). We also made use of images from the Second Palomar Observatory Sky Survey obtained through the STScI Digitized Sky Survey (DSS555http://archive.stsci.edu/cgi-bin/dssform). Finding charts from 2MASS IR and DSS are shown in Fig. 3.
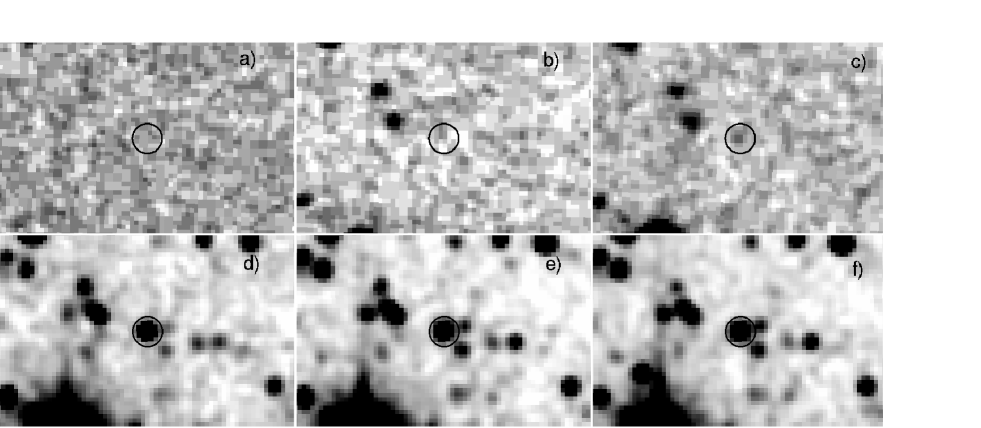
A single infrared counterpart is listed in the 2MASS catalogue: 2MASS~J19295591+1818382 has magnitudes J=14.56 0.03, H=12.99 0.02, and Ks=12.11 0.02. No optical or radio counterpart was found in any of the other catalogues, although a faint object might be present in the “infrared” (7000–9700Å) POSS II image (Fig. 3). The infrared magnitudes were dereddened using AAV, with the wavelength dependent coefficients obtained by Cardelli et al. (1989) (see Table 4 in Rahoui et al., 2008, for the values adopted), and AV=5.6 NH (Predehl & Schmitt, 1995). The value of the total absorbing column density along the line of sight was obtained from the LAB survey of Galactic HI (Kalberla et al., 2005), and the CO survey of Dame et al. (2001) for the value of molecular H2. Therefore, NH cm-2. We also used the value of NH obtained through the X-ray spectral fits to the data, NHX,bbody=2.0 cm-2, and NHX,po= 4.0 cm-2 (see Sec. 5). The dereddened magnitudes are reported in Table 2.
| NH | AV | Jder. | Hder. | Ks,der. | J-H | H-Ks |
|---|---|---|---|---|---|---|
| cm-2 | ||||||
| 2.0 | 11.20 | 11.32 | 11.04 | 10.86 | 0.28 | 0.18 |
| 2.73 | 15.29 | 10.14 | 10.32 | 10.40 | 0.18 | 0.08 |
| 4.0 | 22.40 | 8.08 | 9.09 | 9.53 | 1.01 | 0.44 |
5 X-ray spectral analysis
5.1 Correction of the Galactic ridge emission in the PCA spectra
Since IGR J19294+1816 is faint and located in the Galactic plane (its Galactic coordinates are
, ), the Galactic ridge can contribute
a significant amount of the flux collected by the PCA. We estimated
the level of emission using the results from Valinia & Marshall (1998), and first
corrected the spectra from the Galactic ridge
emission in a similar way as done for IGR J19140+0951 by Prat et al. (2008), i.e.
adding the Galactic ridge spectrum to the instrumental background spectrum.
A simultaneous fit to the S3 and X5 spectra showed a large offset in
the normalisations of the spectra: when including a constant in the fit and freezing
it to 1 for the S3 spectrum it resulted in a low value of 0.45 for the
X5 spectrum. This might indicate that either the source varied during
the non-simultaneous part of these observations, or that we over-corrected the emission
of the Galactic ridge in the PCA spectrum. We consider this last hypothesis as the most
likely given that the spectrum of the Galactic ridge obtained from Valinia & Marshall (1998)
is an average spectrum covering the central regions of the Galaxy,
i.e. and , and that IGR J19294+1816 is
slightly outside this region. Although the source is located in the Galactic ridge, we can
expect local variations in the ridge, and/or slight changes (lower intensity for
example) at high longitude (as also mentioned in Valinia & Marshall, 1998).
In a second run, we did not correct the X5 spectrum for the contribution of
the Galactic ridge, and we did not include a normalisation constant
between the S3 and X5 spectra (we therefore made the assumption that
Swift and RXTE are perfectly cross calibrated). The spectra were fit with an absorbed power law and the best-fitting model for the Galactic ridge spectrum obtained by Valinia & Marshall (1998). A multiplicative constant precedes this spectral component whose parameters are frozen. The spectral model is therefore phabs*powerlaw+constant*(wabs*(raymond+powerlaw)) in the XSPEC terminology. We initially fitted the S3 spectrum alone (with the constant
fixed at 0) to obtain the parameters of the source. Then, we added the X5 spectrum
and only left the normalisation constant to the X5 data free to vary while it was
held at 0 for the S3 data. Therefore, we assume that the average spectral parameters obtained in the are still valid at the position of IGR J19294+1816 , and that only the overall flux of the ridge emission changes.
The most precise value obtained for the constant is 0.85 (at 90% confidence). In subsequent analyses, we used this value to correct all PCA spectra according to:
| (1) |
5.2 Results of the spectral analysis
The Swift/XRT spectra were rebinned so as to have a minimum of 20 cts per channel, except for the channels below about 1.2 keV that were grouped in 2 bins: one below 0.2 keV that was not considered further for the spectral fitting, and one between 0.2–1.2 keV to obtain an additional spectral point to better constrain the absorption column density NH. The Swift spectra were fitted between and keV, while the RXTE spectra were fitted between and keV. We fitted each individual spectrum alone in XSPEC 11.3.2ag, except the spectra from observations S3 and X5 that were fitted simultaneously. Different spectral models were used to fit the spectra. The Swift spectra are well fitted using either an absorbed blackbody or an absorbed power law. Only the latter model provides a good fit to the RXTE spectrum, and joint Swift and RXTE spectra. Considering the detection at energies greater than 20 keV with INTEGRAL and Swift , this suggests that the true origin of the emission is probably not from a blackbody. However, we report the parameters of the blackbody together with those obtained with the power-law model in Table 3. Observations S3 and X5 were simultaneous with an INTEGRAL observation, but the source was not detected by the latter satellite with an 18–40 keV 3- upper limit of 5 mCrab with IBIS.
| Obs | NH | kTbb | F2-10,unabs. | ⋆ | |
|---|---|---|---|---|---|
| ( cm-2) | (keV) | (erg cm-2 s-1 ) | (DOF†) | ||
| S1 | 4.0 | 0.9 | 3.6 | 1.0 (66) | |
| 2.0 | 2.1 | 3.0 | 0.86 (66) | ||
| S2 | 3.4 | 1.0 | 3.8 | 0.78 (34) | |
| 1.8 | 1.8 | 3.0 | 0.74 (34) | ||
| X1 | 3.4 (Frozen) | 1.17 | 2.65 | 0.94 (25) | |
| X2 | 3.4 (Frozen) | 1.0 | 0.9 | 0.49 (10) | |
| X3 | 3.4 (Frozen) | 1.2 | 2.6 | 0.91 (25) | |
| X4 | 3.4 (Frozen) | 1.1 | 1.1 | 0.93 (12) | |
| S3+X5 | 3.4 | 1.2 | 0.74 | 0.86 (8) |
-
⋆
Reduced .
-
†
Degrees of freedom.
Since the PCA is well calibrated only above 3 keV, it is not suitable for proper measures of NH, especially in such a dim source. In fact, leaving all parameters free to vary during the spectral fits leads to poorly-constrained values for this parameter (NH cm-2 in Obs. X1). We therefore froze the value of NH to the value returned by the fit to the closest Swift data (Obs. S3 which, simultaneously fitted with X5, leads to cm-2 for a power-law model).
6 X-ray temporal analysis
Although the first hint for the presence of a pulsation came from Swift/XRT data (Rodriguez et al., 2009), we focus here only on the data from RXTE/PCA which is the instrument dedicated to the timing analysis of astrophysical sources. Also, we only consider here Obs. X1 and X3 which both have 2 PCUs on and exposure times longer than 2.5 ks, in order to increase the statistical significance of the pulse. We produced power spectral density (PSD) distributions between 0.00195 and 1024 Hz with powspec v1.0 averaging all sub-intervals of 512 s long of each of the two observations. The continuum of the 0.00195–1024 Hz PSD is equally well represented by a model consisting of a constant (to account for the contribution of Poisson noise), and either a power law (of index ) or a zero-centred Lorentzian (with a width of Hz). Fig. 4 displays the white-noise corrected PSD restricted to the 0.00195–1 Hz range. Above Hz, the PSD is compatible with white noise.
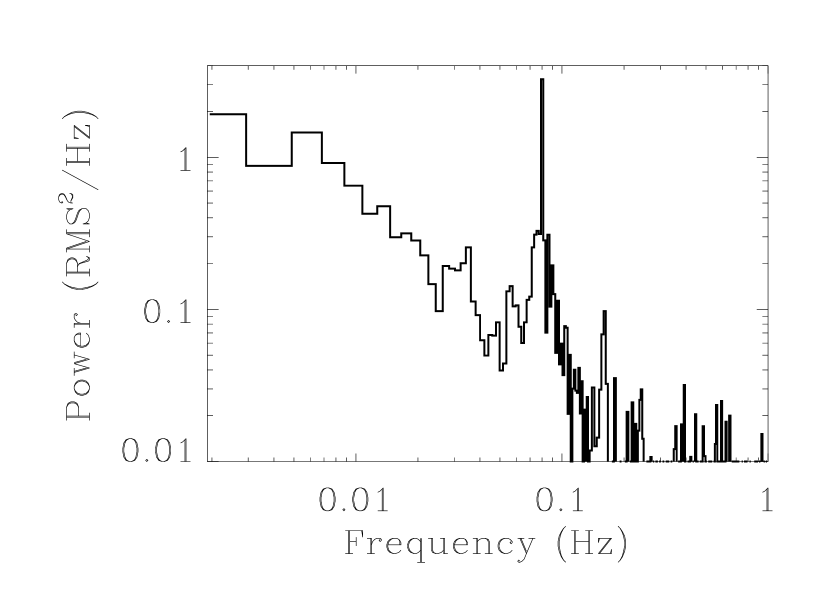
A strong peak at around 0.08 Hz and its first harmonic at about 0.16 Hz can be seen above the PSD continuum (Fig. 4). The main peak (at 0.08 Hz) is contained within a single frequency bin which is indicative of a coherent pulsation. However, we point out that the bottom of this thin peak is broadened. This broad feature can be fitted with a Lorentzian of centroid frequency Hz, and a width of Hz. It has a (raw) power of 11.1% RMS. We also note the presence of a possible feature at Hz, yet the inclusion of a second Lorentzian to the model does not improve the fit in a significant way. To study the properties of the coherent pulsation, we barycentred the 1-s light curves with barycorr v1.8 using the orbital ephemeris of the satellite, and we corrected the light curves for the background. The pulsation period was searched for using a Lomb-Scargle periodogram as described in Press & Rybicki (1989) with the errors calculated from the periodogram following Horne & Baliunas (1986) (see also the original work of Kovacs, 1981). This is the same method used by Rodriguez et al. (2006) to find the pulse’s most precise period in IGR J16320$-$4751. The light curves were folded with efold v1.1.
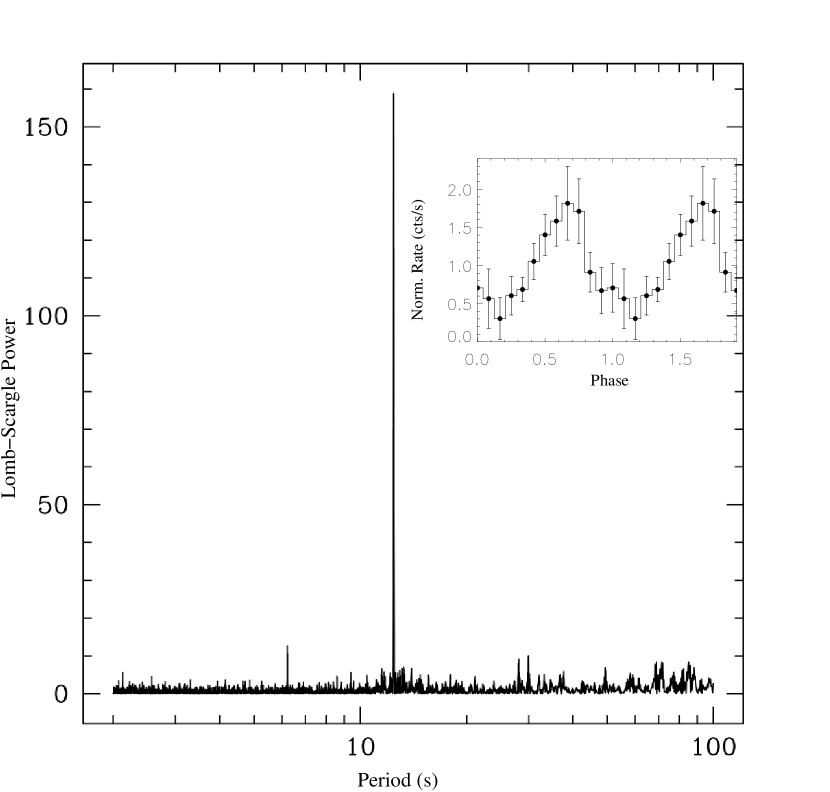
We combined Obs. X1 & X3 to obtain the most precise measure of the pulsation. A very prominent peak is visible in the periodogram (Fig. 5), together with its first harmonic. We derived a pulse period of P=12.43781(3) s (0.080400 Hz). The light curve, folded at a period of 12.44 s, is shown in Fig. 5 as an insert. The pulse fraction was calculated in a standard way (, see e.g. Rodriguez et al., 2006). Without taking the emission of the Galactic ridge into account, we estimate a pulse fraction . Given the source’s location in the Galactic plane which has a non-negligible contribution to the total flux, this value underestimates the true pulse fraction, and should be considered as a lower limit. According to the results of the spectral analysis presented in the previous section, we obtained the “true” background following Eq. 1, which includes the estimated contribution from the Galactic ridge at the position of IGR J19294+1816. The light curves corrected for this total background yields .
7 Discussion and conclusions
We have reported here the results obtained from a multi-instrumental
campaign dedicated to the X-ray properties of new INTEGRAL sources.
The refinement of the X-ray position provided by the Swift/XRT observations enabled us to identify a possible counterpart at infrared wavelengths. The
differences of dereddened magnitudes (Table 2) do not lead to
any of the spectral types tabulated in Tokunaga (2000). With
NH=2.0 cm-2, JH=0.28 would indicate an F7 V or F8 I
star. However the value of HKs is inconsistent with both possibilities.
With NH=2.73 cm-2, JH seems too high for any spectral type, although
we remark a marginal compatibility (at the edge of the errors on the magnitude) with an
O9.5 V star (JH=, HKs=0.04 Tokunaga, 2000). This
value is, however, a measure of the interstellar absorption through the whole Galaxy. Since IGR J19294+1816 probably lies closer than the other end of the Galaxy, it is
likely that the interstellar absorption along the line of sight is lower. In particular, we note
that with NH=2.5 cm-2, we obtain JH= and
HKs=0.05, which is very close to the values tabulated for a B3 I star
(JH=, HKs=0.03 Tokunaga, 2000). In that case, the source
would lie at a distance kpc.
The X-ray behaviour of the source is indicative of an HMXB:
the X-ray spectra are power law like in shape with a hard photon index.
One of the spectra (Obs. S1 with the longest exposure)
shows evidence for absorption in clear excess to the
absorption on the line of sight, which may indicate some intrinsic absorption in
this source. However, the evidence is marginal in the other spectra, which could suggest that the intrinsic absorption varies in this
system, as has been observed in a number of HMXBs.
A long-term periodicity was revealed in the Swift/BAT data which confirms the binarity of the
source (Corbet & Krimm, 2009). We clearly detect an X-ray pulse at a period of
12.44 s, indicating the presence of an X-ray pulsar. We estimate a pulse fraction
. Apart from millisecond X-ray pulsars, found in systems that are at the end of
the evolutionary path of X-ray binaries (and are LMXBs), pulsars are young objects
that are usually found in HMXBs. We also remark that the PSD of IGR J19294+1816 shows a
broadening at the bottom of the coherent pulsation. Sidelobes and other noise features
around coherent pulsation signals have been seen in other HMXBs
(e.g. Kommers et al., 1998; Kaur et al., 2007, in, respectively, 4U 1626$-$67, and
XTE J0111.2$-$7317).
Such features can be produced by artificial effects (such as the finite
length of the time intervals used to make the PSD), or they can be
real if, e.g., a quasi-periodic oscillation (QPO) beats with the coherent
signal (Kommers et al., 1998; Kaur et al., 2007). In the case of IGR J19294+1816, a possible QPO might be present
at Hz (Fig. 4), even if the quality of the data does
not allow us to firmly establish its presence. On the other hand,
we cannot exclude that the Hz feature is itself a QPO at a frequency
close to that of the coherent pulsation. Given the faintness of the source,
we cannot conclude further on that matter.
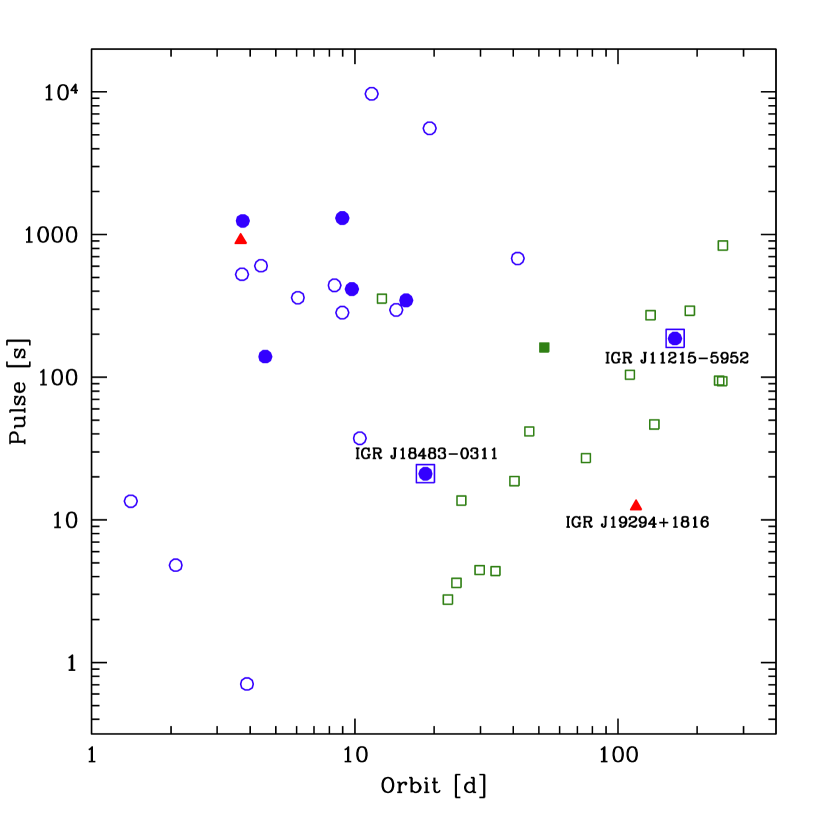
In fact, IGR J19294+1816 lies in a region populated
by Be-HMXBs in the so-called “Corbet diagram” (Corbet, 1986; Corbet & Krimm, 2009), as
demonstrated in Fig. 6. Note that this plot is the most recent update of the Corbet
diagram for INTEGRAL sources as of June, 2009 (Bodaghee et al. 2009 in prep.).
Recently, Bodaghee et al. (2007) further explored the
parameter spaces occupied by high-energy sources. They noticed
that Be-HMXB and supergiant HMXB also segregate in different parts of the
NH vs. orbital period and NH vs. spin period diagrams. The value of the
absorption we obtained through our spectral analysis, combined with the values of
the spin and orbital periods, make IGR J19294+1816 lie in a region populated by Be-HMXBs in these
diagrams as well. At first order, one can easily understand the
segregation in these three different diagrams as results of the age, type of accretion,
and probable type of orbit. Be systems are younger, and hence have eccentric orbits,
longer orbital periods, and shorter spin periods, whereas supergiant systems are older, are
mostly circularised with shorter orbital periods, and longer spin periods. In these latter systems,
in addition, the compact object is embedded in the wind of the companion (the feed matter for
accretion) which explains their (usually) higher intrinsic absorption. In this respect,
all our results point towards IGR J19294+1816 being a Be-HMXB (the same conclusion, although only based
on the Corbet diagram, was presented by Corbet & Krimm, 2009) .
INTEGRAL has unveiled a new (sub-)type of supergiant HMXB, characterised by
short (hours) and intense flares seen at X-ray energies: the so-called SFXTs.
Models of SFXTs
involve stochastic accretion of clumps from the (heterogeneous) wind of the
supergiant (e.g. in’t Zand, 2005; Negueruela et al., 2006), on top
of longer, but fainter, periods of activity (e.g. Sidoli et al., 2007).
In this respect, the detection of periods of short and intense
flares in IGR J19294+1816 with INTEGRAL (Fig. 1), a behaviour typical of SFXTs,
raises the possibility that this source belongs
to this new class. Its position in the Corbet and the NH vs. spin or orbital period
diagrams (Fig. 6) is not a definitive
contradiction to this hypothesis, since systematic X-ray studies of SFXTs
have shown that, contrary to other HMXBs, they
seem to populate any part of the diagrams. In particular, IGR J18483$-$0311
and IGR J11215$-$5952, the only two SFXTs for which both orbital and pulse
periods are known, lie in the region of Be-systems in these representations
(Fig. 6). The former source has a pulse period
of 21.05 s, an orbital period of 18.5 d, and has a B0.5 Ia companion
(see Rahoui & Chaty, 2008, and references therein). The latter has a pulse period of about
187 s, an orbital period of about 165 d (e.g. Sidoli et al., 2007; Ducci et al., 2009), and is associated
with a B supergiant (Negueruela et al., 2005). To reconcile the fact that they are long period systems
with a rather low absorption, an eccentric orbit is invoked. IGR J19294+1816 could be the third member
of SFXTs (with a known pulse period) having a long and eccentric orbit.
In this case, this may point towards
the existence of an evolutionary link between Be-HMXBs and eccentric
SFXTs (Liu et al. 2009 in prep.).
The quality of the data is not good enough to permit us to make any firm conclusions concerning the nature of the system, and only an identification of the optical counterpart’s spectral type will resolve this issue.
Acknowledgements.
JR acknowledges useful and productive discussions with Farid Rahoui. We thank the referee for the careful reading of this paper and his/her comments that helped us to improve it. We would like to warmly thank the RXTE and Swift PIs and mission planners for having accepted to perform these observations, and the efficient scheduling in simultaneity with one of the INTEGRAL pointings. AP acknowledges the Italian Space Agency financial support via contract I/008/07/0. JAZH acknowledges the Swiss National Science Foundation for financial support. This research has made use of the USNOFS Image and Catalogue Archive operated by the United States Naval Observatory, Flagstaff Station (http://www.nofs.navy.mil/data/fchpix/) This research has made use of the SIMBAD database, operated at CDS, Strasbourg, France. It also makes use of data products from the Two Micron All Sky Survey, which is a joint project of the University of Massachusetts and the Infrared Processing and Analysis Center/California Institute of Technology, funded by the National Aeronautics and Space Administration and the National Science Foundation. The Digitized Sky Surveys were produced at the Space Telescope Science Institute under U.S. Government grant NAG W-2166. The images of these surveys are based on photographic data obtained using the Oschin Schmidt Telescope on Palomar Mountain and the UK Schmidt Telescope. The plates were processed into the present compressed digital form with the permission of these institutions. The Second Palomar Observatory Sky Survey (POSS-II) was made by the California Institute of Technology with funds from the National Science Foundation, the National Geographic Society, the Sloan Foundation, the Samuel Oschin Foundation, and the Eastman Kodak Corporation.References
- Bodaghee et al. (2007) Bodaghee, A., Courvoisier, T. J.-L., Rodriguez, J., et al. 2007, A&A, 467, 585
- Cardelli et al. (1989) Cardelli, J. A., Clayton, G. C., & Mathis, J. S. 1989, ApJ, 345, 245
- Condon et al. (1998) Condon, J. J., Cotton, W. D., Greisen, E. W., et al. 1998, AJ, 115, 1693
- Corbet (1986) Corbet, R. H. D. 1986, MNRAS, 220, 1047
- Corbet & Krimm (2009) Corbet, R. H. D. & Krimm, H. A. 2009, The Astronomer’s Telegram, 2008, 1
- Dame et al. (2001) Dame, T. M., Hartmann, D., & Thaddeus, P. 2001, ApJ, 547, 792
- Ducci et al. (2009) Ducci, L., Sidoli, L., Mereghetti, S., Paizis, A., & Romano, P. 2009, MNRAS, 398, 2152
- Horne & Baliunas (1986) Horne, J. H. & Baliunas, S. L. 1986, ApJ, 302, 757
- in’t Zand (2005) in’t Zand, J. J. M. 2005, A&A, 441, L1
- Kalberla et al. (2005) Kalberla, P. M. W., Burton, W. B., Hartmann, D., et al. 2005, A&A, 440, 775
- Kaur et al. (2007) Kaur, R., Paul, B., Raichur, H., & Sagar, R. 2007, ApJ, 660, 1409
- Kommers et al. (1998) Kommers, J. M., Chakrabarty, D., & Lewin, W. H. G. 1998, ApJ, 497, L33+
- Kovacs (1981) Kovacs, G. 1981, Ap&SS, 78, 175
- Negueruela et al. (2005) Negueruela, I., Smith, D. M., & Chaty, S. 2005, The Astronomer’s Telegram, 470, 1
- Negueruela et al. (2006) Negueruela, I., Smith, D. M., Reig, P., Chaty, S., & Torrejón, J. M. 2006, in ESA Special Publication, Vol. 604, The X-ray Universe 2005, ed. A. Wilson, 165–+
- Prat et al. (2008) Prat, L., Rodriguez, J., Hannikainen, D. C., & Shaw, S. E. 2008, MNRAS, 389, 301
- Predehl & Schmitt (1995) Predehl, P. & Schmitt, J. H. M. M. 1995, A&A, 293, 889
- Press & Rybicki (1989) Press, W. H. & Rybicki, G. B. 1989, ApJ, 338, 277
- Rahoui & Chaty (2008) Rahoui, F. & Chaty, S. 2008, A&A, 492, 163
- Rahoui et al. (2008) Rahoui, F., Chaty, S., Lagage, P.-O., & Pantin, E. 2008, A&A, 484, 801
- Rodriguez et al. (2006) Rodriguez, J., Bodaghee, A., Kaaret, P., et al. 2006, MNRAS, 366, 274
- Rodriguez et al. (2008a) Rodriguez, J., Hannikainen, D. C., Shaw, S. E., et al. 2008a, ApJ, 675, 1436
- Rodriguez et al. (2008b) Rodriguez, J., Tomsick, J. A., & Chaty, S. 2008b, A&A, 482, 731
- Rodriguez et al. (2009) Rodriguez, J., Tuerler, M., Chaty, S., & Tomsick, J. A. 2009, The Astronomer’s Telegram, 1998, 1
- Sidoli et al. (2007) Sidoli, L., Romano, P., Mereghetti, S., et al. 2007, A&A, 476, 1307
- Skrutskie et al. (2006) Skrutskie, M. F., Cutri, R. M., Stiening, R., et al. 2006, AJ, 131, 1163
- Strohmayer et al. (2009) Strohmayer, T., Rodriguez, J., Markwardt, C., et al. 2009, The Astronomer’s Telegram, 2002, 1
- Tokunaga (2000) Tokunaga, A. T. 2000, Infrared Astronomy, ed. A. N. Cox, 143–+
- Tuerler et al. (2009) Tuerler, M., Rodriguez, J., & Ferrigno, C. 2009, The Astronomer’s Telegram, 1997, 1
- Valinia & Marshall (1998) Valinia, A. & Marshall, F. E. 1998, ApJ, 505, 134