ATLAS Muon Detector Commissioning
Abstract
The ATLAS muon spectrometer consists of several major components: Monitored Drift Tubes (MDTs) for precision measurements in the bending plane of the muons, supplemented by Cathode Strip Chambers (CSC) in the high region; Resistive Plate Chambers (RPCs) and Thin Gap Chambers (TGCs) for trigger and second coordinate measurement in the barrel and endcap regions, respectively; an optical alignment system to track the relative positions of all chambers; and, finally, the world’s largest air-core magnetic toroid system. We will describe the status and commissioning of the muon system with cosmic rays and plans for commissioning with early beams.
I Introduction
The ATLAS experiment is one of two general-purpose collider detectors for the Large Hadron Collider (LHC) at CERN. The ATLAS detector consists of an inner detector employing silicon pixel, strip, and transition radiation tracking detectors, all in a solenoidal magnetic field of 2 Tesla; electromagnetic and hadronic calorimeters using liquid argon and scintillator tile detectors; and a muon spectrometer. The muon spectrometer consists of a large air-core barrel and endcap toroid magnets with a typical field of 1 Tesla, and four types of trigger and precision tracking detectors, described below. The spectrometer is designed to measure the transverse momentum () of muons with GeV with a resolution of 3% for GeV and increasing to 10% @ 1 TeV. This paper describes the commissioning of the ATLAS muon detector for the first LHC collisions which are expected in Fall, 2009.
II Muon Spectrometer Overview
The ATLAS muon spectrometer consists of monitored drift tubes (MDTs) for precision tracking in the spectrometer bending plane, Resistive Plate Chambers (RPCs) and Thin Gap Chambers (TGCs) for triggering in barrel and endcap, respectively, and Cathode Strip Chambers (CSCs) for precision measurements in the high-rate endcap inner layer where MDTs would have occupancy problems.
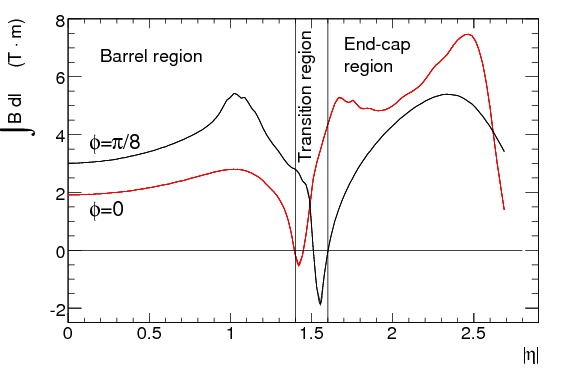
The magnet system consists of 3 sets of air-core toroids, each with 8 coils, 1 for the barrel, and 1 for each endcap. The barrel toroids coils are each 25m 7m and the endcap coils are 9m 4m. The magnetic field provides an approximately 1T field at the center of each coils, but is rather non-uniform, especially in the barrel-endcap transition region. For track reconstruction, the field is mapped using computer models of the field which are normalized to measurements from 1850 Hall sensors mounted on spectrometer chambers. Figure 2 shows the of the spectrometer magnetic field.
Alignment measurements of the spectrometer are also critical for momentum determination and are accomplished with an optical alignment system of 12k sensors. Measurements from these sensors allow a 3 dimensional reconstruction of chamber positions accurate to better than 50 m. In addition, the optical alignment system is complemented by alignment done with tracks.
| Type | Purpose | location | coverage | Channels |
|---|---|---|---|---|
| MDT | Tracking | barrel+endcap | 354k | |
| CSC | Tracking | endcap layer 1 | 30.7k | |
| RPC | Trigger | barrel | 373k | |
| TGC | Trigger | endcap | 318k |
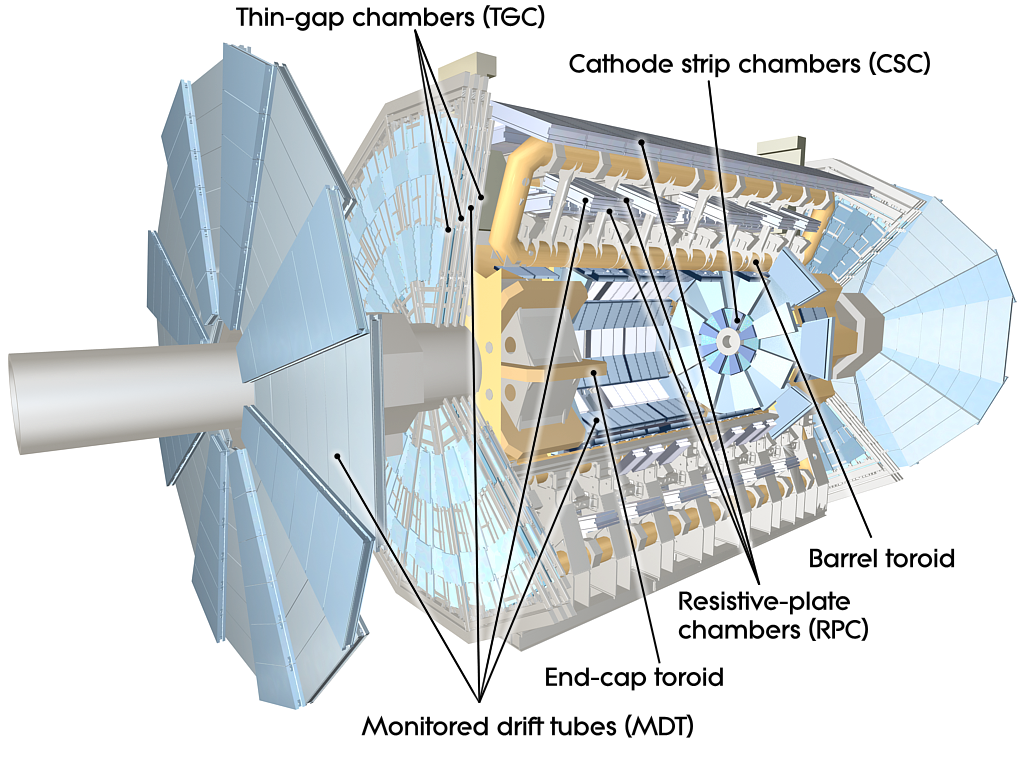
The spectrometer is designed so that muons cross three layers of MDT chambers for the sagitta measurement. The track coordinate in the bending plane of the spectrometer is measured by the precision chambers with a resolution of 60-70 m. In comparison, the sagitta of a 1 TeV muon will be about 500 m. The trigger chambers are placed on opposite sides of the middle MDT layer. The trigger chambers provide a trigger based on muon momentum in addition to identifying the bunch crossing time of the muon. The also provide the second coordinate measurement (non-bending plane) accurate to 5-10 cm.
The following sections describe the commissioning of the various components of the muon spectrometer. The data shown are all from studies with cosmics rays made in 2008 and 2009. A longer description of the ATLAS detector has been published in atlas_paper .
III RPC commissioning
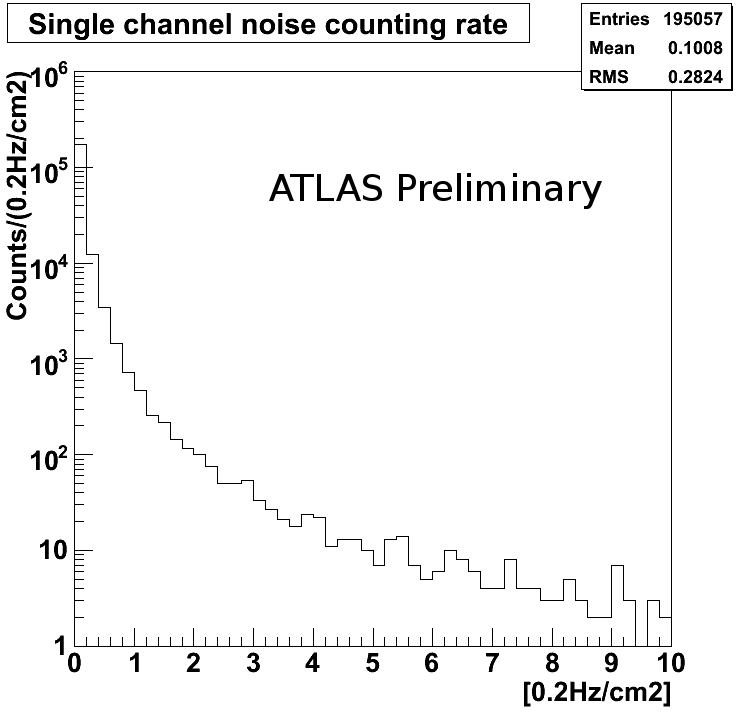
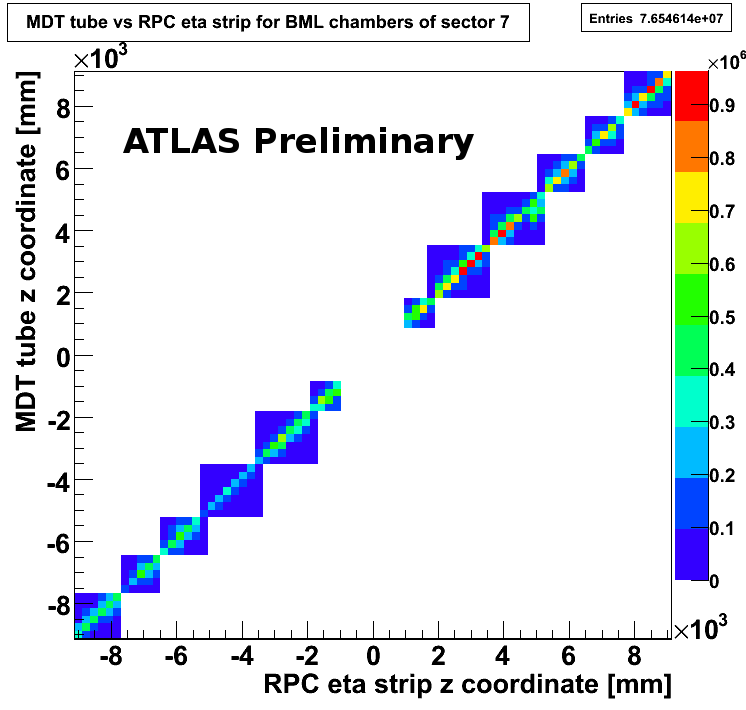
All 606 RPC have been installed and 95.5% are functioning as of July 2009. Further commissioning efforts will push the percentage higher before the first collisions. Figure 3 shows the RPC noise measured in the ATLAS cavern. Noise rates are typically quite low, around . Figure 4 shows the RPC occupancy measured in January 2009. The occupancy is fairly uniform, though a few chambers are missing. Many of the missing chambers have since been brought online. Figure 5 shows the correlation between RPC and MDT hits for one barrel sector. The plot shows the expected correlation. The blue background is due to uncorrelated noise hits.
IV TGC commissioning
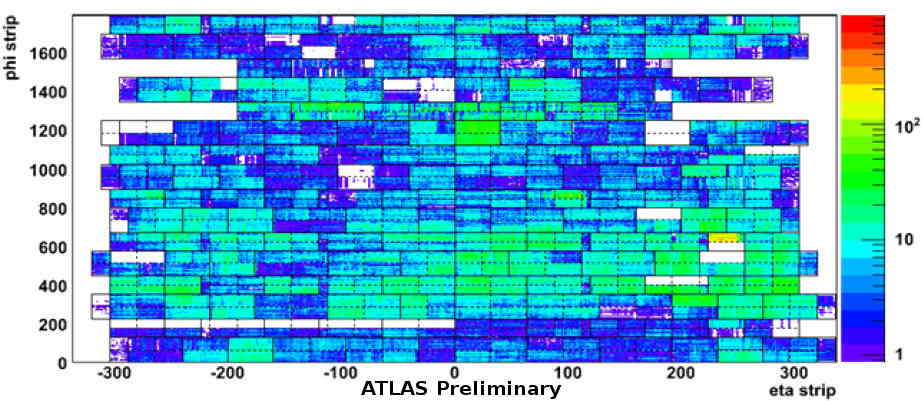
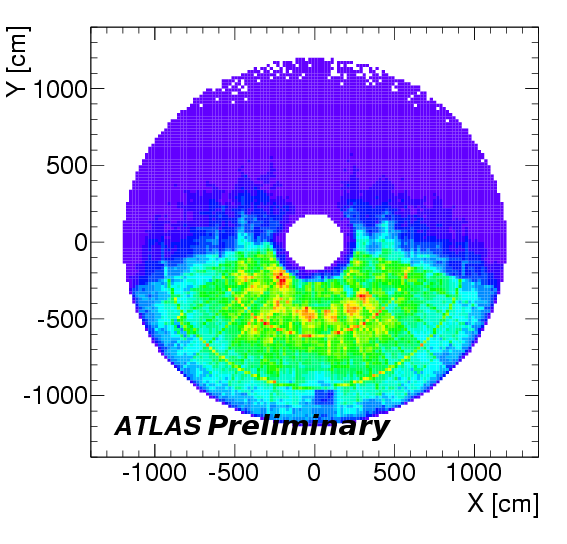
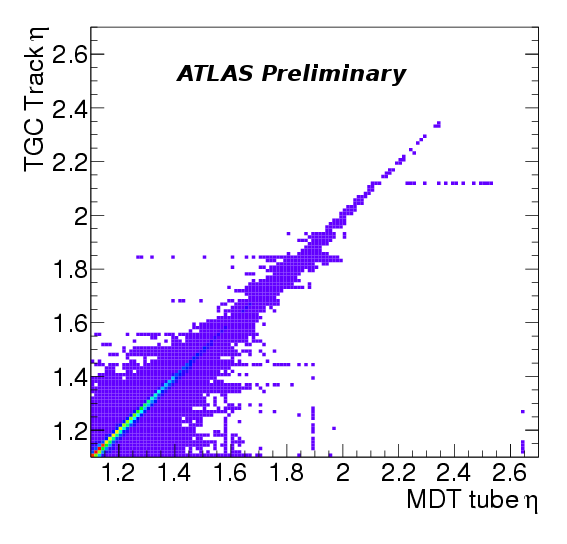
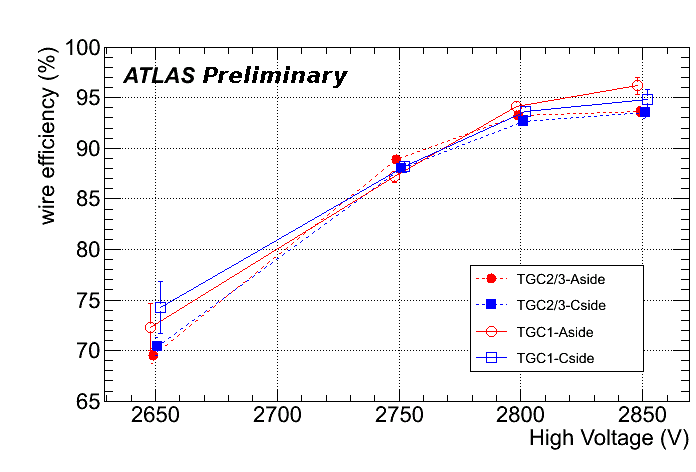
All 3588 TGC chambers have been installed in the endcaps with 99.9% functioning. Figure 6 shows an occupancy plot for one of the TGC endcap wheels. In this data only the bottom half of the detector was set to trigger to select (cosmic-ray) tracks which point to the interaction point, which accounts for the non-uniform occupancy. Figure 7 shows the correlation between TGC and MDT in . The expected correlation is seen, along with a few vertical and horizontal lines due to noisy chambers. Figure 8 shows the TGC wire efficiency versus voltage which is around 95% at the operating voltage of 2850V. Trigger timing has been adjusted so that 99.14% of events are read out in the current (i.e. correct) bunch crossing.
V CSC commissioning
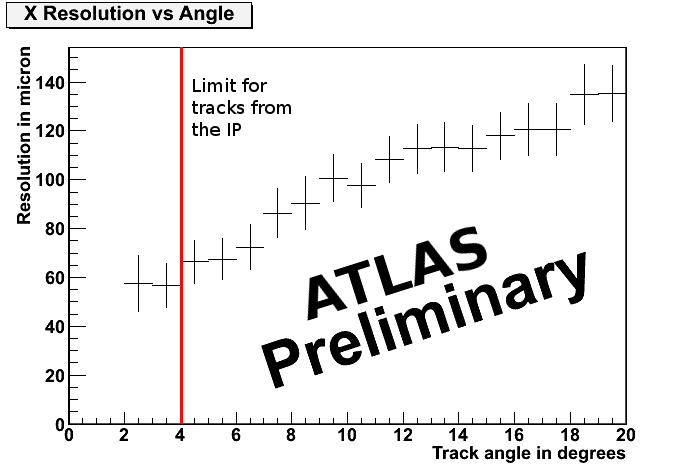
The CSCs are installed in the inner high- region of the first endcap wheel where the background will be highest. All 32 chambers have been installed with 98.5% of the layers working. There had been a problem with poor performance of the readout firmware, but a recent firmware re-write shows greatly improved results and we anticipate a smoothly running system in time for the beam. Figure 9 shows the CSC tracking resolution as a function of track incidence angle using cosmic-ray data. The resolution is around 60 m for tracks within , the angular limit for tracks from collisions.
VI MDT commissioning
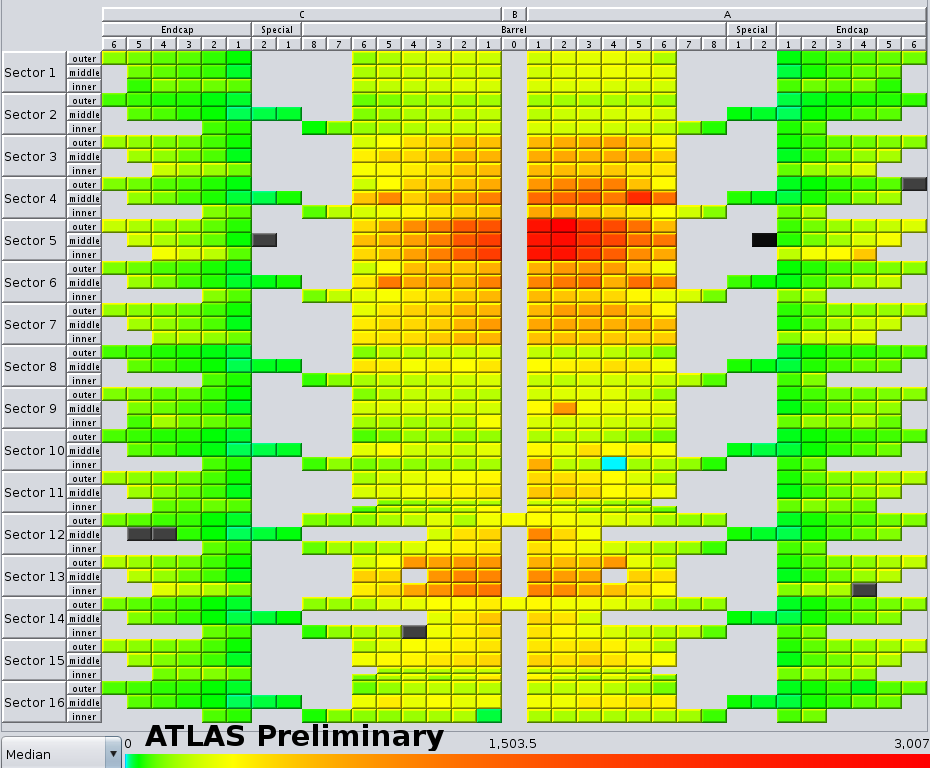
In the MDTs 1090 of 1150 chambers are installed and 99.6% are working. The remaining few chambers will be installed over the coming year. Figure 10 shows the MDT occupancy for cosmic-ray data.
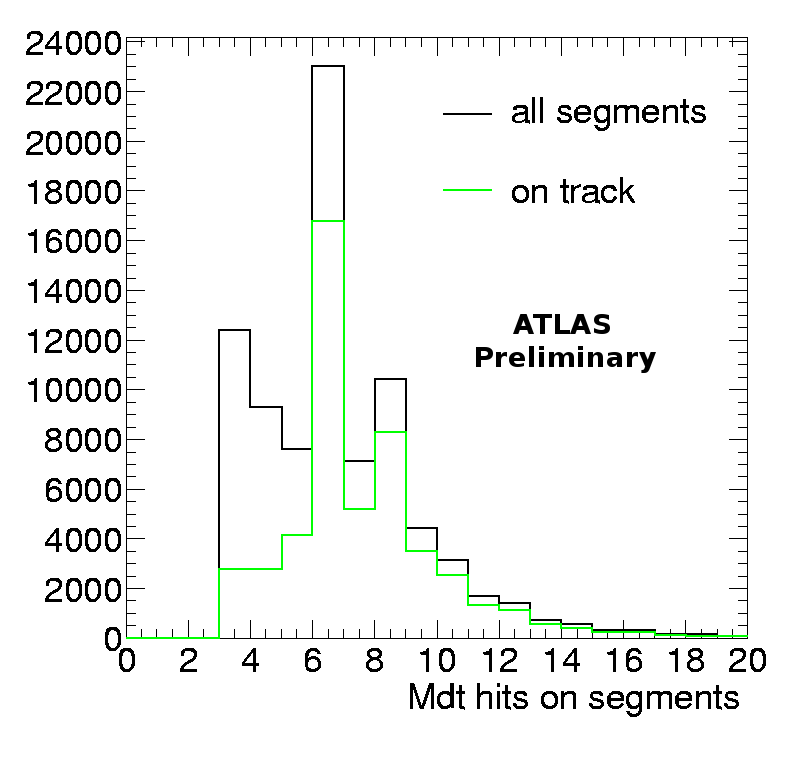
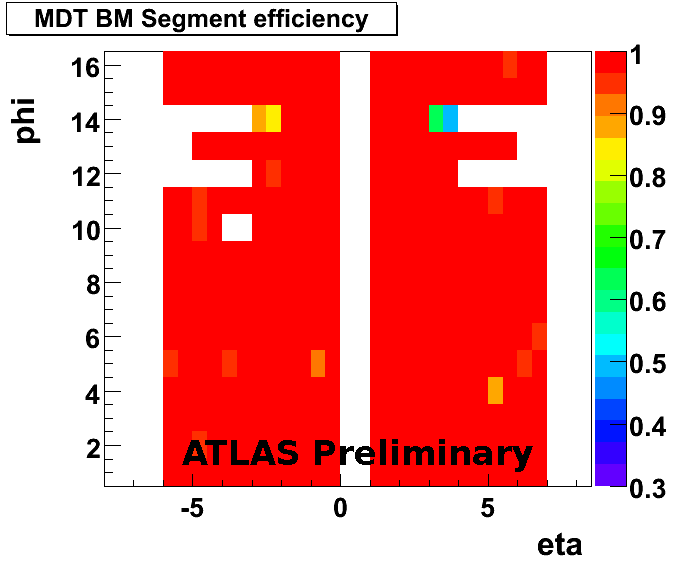
Track reconstruction has been carefully studied in the spectrometer. Figure 11 shows the distribution of the number of hits in track segments reconstructed in MDT chambers. The distribution shows peaks at 6 and 8 hits which correspond to the number of tube layers in MDT chambers. Studies of track reconstruction in MDTs show that the efficiency of reconstruction of track segments within chambers is . This efficiency was determined extrapolating tracks reconstructed from 2 chambers to a chamber traversed by the track and then checking for a segment matching the incident track. Figure 12 shows the segment efficiency in the MDT middle barrel layer.
MDTs require calibrations to determine a timing offset (), and a time-to-space function (RT function). These calibrations will be performed with a special data stream from the level-2 trigger which will deliver up to the regular rate of single muons to provide high statistics for calibrations. This data stream will be processed at 3 off-site calibration centers in Rome, Munich, and Michigan.
The ’s are determined by fitting the rising edge of the drift time spectrum with a Fermi-Dirac function as shown in Figure 13. The RT function is determined by an autocalibration technique minimizing track residuals using either chamber data, or data from an MDT monitoring chamber on the surface which samples the MDT gas. Figure 14 shows an example of tracking residuals versus tube radius after RT auto-calibration. Additional details about the ATLAS MDT calibration process are discussed in more detail in the DPF talk of S. McKee (“ATLAS Great Lakes Tier-2 Computing and Muon Calibration Center Commissioning”) and in calib_paper .
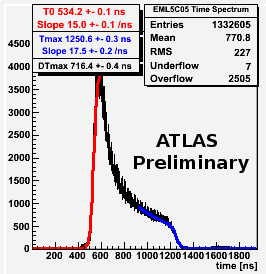
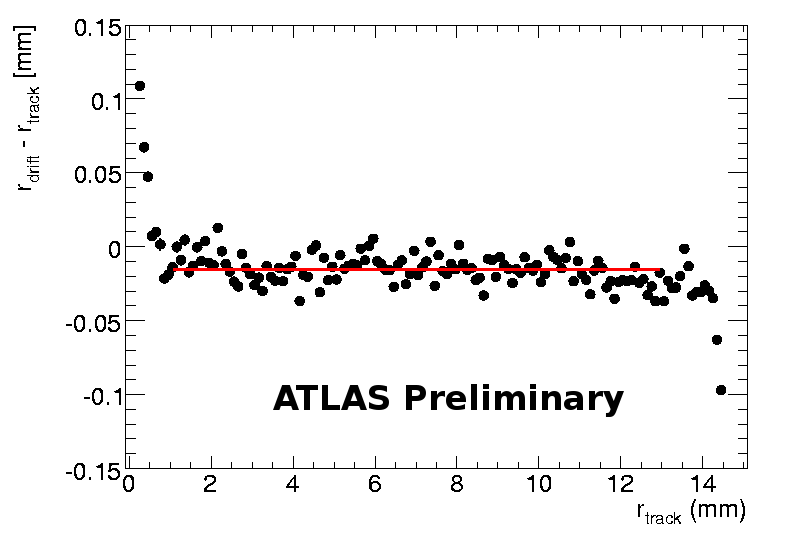
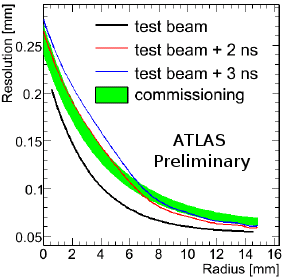
Figure 15 shows the MDT resolution versus tube radius as measured with both cosmic rays and testbeam datatestbeam_paper . The resolution obtained with cosmic-ray data is poorer than that measured in testbeam data. The cosmic-ray resolution could be matched roughly by adding an additional jitter of about 2 ns to testbeam plot. The decrease in resolution for cosmic rays is due to the non-synchronous arrival of cosmic rays compared to the 25 ns beam clock which is used for clocking the drift time measurements. This cosmic-ray jitter is mostly removed with an event-by-event fitting procedure, but a residual jitter remains. We expect that with collision data we will be able to match the testbeam resolution.
VII Alignment system commissioning
The ATLAS muon spectrometer has separate optical alignment systems for the barrel and endcap. These employ a network of sensors to provide a 3D reconstruction of detector positions, which are essential for the muon sagitta measurement, and therefore momentum measurement of muons. The endcap optical system has been validated by looking at the “false” sagitta of straight tracks (i.e. with no magnetic field) which pass through the 3 endcap wheels. A track is reconstructed by hits on the inner and outer wheels and a sagitta calculated relative to this track using hits from the middle wheel as shown in Figure 16. Figure 17 shows the sagitta distribution with and without the alignment corrections applied. Without corrections, using nominal geometry, the sagitta distribution is broad and distorted. When alignment corrections are applied the distribution is centered on zero to within 15 m, (i.e. no net sagitta, as expected for straight tracks) with a much narrower and uniform shape. The width of the distribution is primarily due to multiple scattering which is relatively high in cosmic rays.
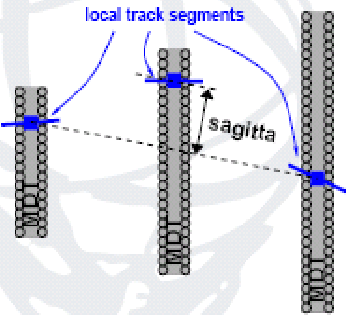
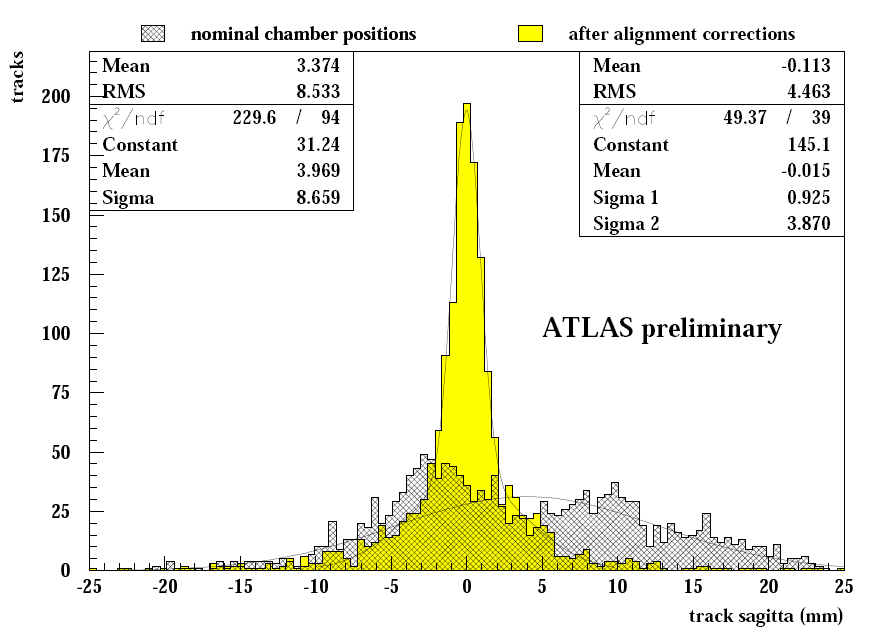
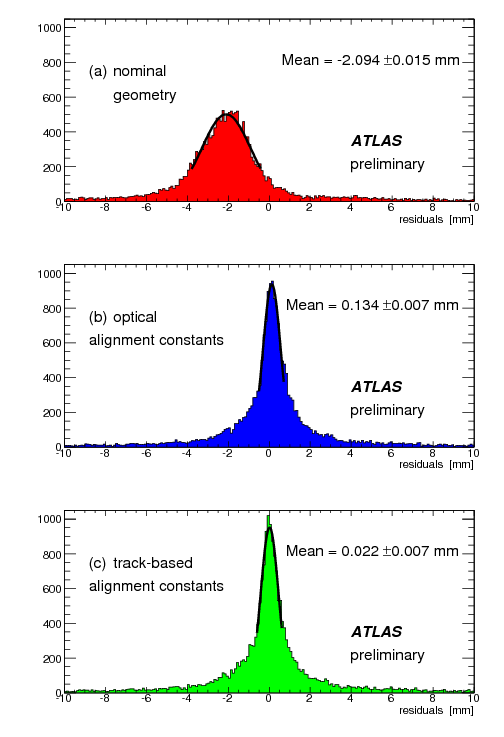
Figure 18 shows sagitta measurements for barrel tracks, with and without alignment corrections. For the barrel the alignment corrections were derived from both optical sensors and straight tracks, since the optical system of the barrel only covers half of the chambers. The corrections from straight tracks work considerably better those from the barrel optical system, due to some limitations in the optical system which are being addressed by additional commissioning work. The alignment with tracks corrects the sagitta to within 30 m as required for optimal spectrometer performance, whereas the barrel optical system is currently only able to correct chamber positions to 100-200 m.
VIII Conclusions
The ATLAS muon system is nearly fully installed and tested in the ATLAS cavern. Data from cosmic rays show that the detector is performing well with cosmic rays though a complete evaluation of detector performance will only be possible with collision data. The spectrometer will be ready for the first collisions data from the LHC, expected in fall 2009.
References
- (1) “The ATLAS Experiment at the CERN Large Hadron Collider”, The ATLAS Collaboration, G Aad et al 2008 JINST 3 S08003, http://www.iop.org/EJ/abstract/1748-0221/3/08/S08003
- (2) “Calibration model for the MDT chambers of the ATLAS Muon Spectrometer”, P. Bagnaia et al, ATLAS Note ATL-MUON-PUB-2008-004, http://cdsweb.cern.ch/record/1089868
- (3) “System Test of the ATLAS Muon Spectrometer in the H8 Beam at the CERN SPS”, Adorisio et al, C Nucl. Instrum. Methods Phys. Res., A593, 3 (2008) 232-254, http://cdsweb.cern.ch/record/1056267