Dynamics and Thermodynamics of a Novel Phase of NaAlH4
Abstract
We characterize a novel orthorhombic phase () of NaAlH4, discovered using first-principles molecular dynamics, and discuss its relevance to the dehydrogenation mechanism. This phase is close in energy to the known low-temperature structure and becomes the stabler phase above 320 K, thanks to a larger vibrational entropy associated with AlH4 rotational modes. The structural similarity of -NaAlH4 to -Na3AlH6 suggests it acts as a key intermediate during hydrogen release. Findings are consistent with recent experiments recording an unknown phase during dehydrogenation.
pacs:
71.15.Pd,66.30.-h,66.30.DnComplex light-metal hydrides represent a materials solution to the hydrogen-storage problem Schlapbach and Züttel (2001) because of their potential for acceptably high gravimetric capacities, as well as an ability to be engineered for favorable hydrogen release kinetics. Of these, sodium alanate (NaAlH4) has attracted particular interest by combining relatively high theoretical hydrogen release with ready reversibility through the addition of transition metal dopants Bogdanović and Schwickardi (1997); Schüth et al. (1997). As such, the material has been widely studied as a template for developing novel hydrogen storage solutions. Several recent first-principles studies M. E. Arroyo y de Dompablo and Ceder (2004); A. Peles et al. (2004); Aguayo and Singh (2004); J. Íñiguez et al. (2004); V. Ozoliņš et al. (2004); C. Moysés Araùjo et al. (2005); O. M. Løvvik and Opalka (2005); Ke and Tanaka (2005); Vegge (2006); Li et al. (2006); Frankcombe and O. M. Løvvik (2006); A. Marashdeh et al. (2006); Peles and Chou (2006); Du et al. (2007); Peles and Van de Walle (2007); J. Íñiguez and Yildirim (2007); Gunaydin et al. (2008) have addressed the structure and thermodynamics of the sodium alanate system. Nevertheless, important questions regarding the precise mechanism of dehydrogenation and the nature of the key phase transition from NaAlH4 to Na3AlH6 remain unanswered.
In this Letter, we present static, linear-response, and molecular dynamics (MD) calculations based on density-functional theory (DFT) that support the existence of a hitherto unknown orthorhombic phase of NaAlH4 (), found to be thermodynamically favored over the low-temperature phase at relevant operating temperatures for dehydrogenation. This phase is entropically stabilized by activation of AlH4 rotation and readily nucleates in MD simulations of (001) surface slabs. Our evidence is presented alongside recent experiments to highlight the likely significance of this phase in stabilizing and mediating the decomposition reaction.
Our calculations are based on DFT in the plane-wave pseudopotential formalism P. Giannozzi et al. using the PBE exchange-correlation functional Perdew et al. (1996). Ultrasoft pseudopotentials Vanderbilt (1990) for Na (2s22p63s0.5), H, and Al (3s23p2) were taken from the Quantum-Espresso distribution P. Giannozzi et al. . A second Troullier-Martins pseudopotential Troullier and Martins (1991) for Na, used only for the MD runs, was generated in a 3s0.53p0.05 valence configuration, with nonlinear core corrections Louie et al. (1982) added. For the MD simulations, cutoffs of 25 and 200 Ry were used for the wavefunctions and charge density, respectively, representing convergence of forces to within 0.02 eV/Å. These were raised to 30 and 300 Ry for the total-energy and linear-response calculations. The transition was studied using Car-Parrinello MD simulations Car and Parrinello (1985) of bulk supercells of NaAlH4 with 96 atoms (221 unit cells) and of slab supercells with 192 atoms (8 layers; 222 unit cells). Slabs were cleaved along the (001) plane—verified experimentally and theoretically as the stablest facet Frankcombe and O. M. Løvvik (2006)—with 14 Å of vacuum inserted between images. Except where indicated, slab simulations were performed in the NVT ensemble, whereas bulk simulations were performed in the NPT ensemble at zero pressure using the Parrinello-Rahman extended Lagrangian formalism Focher et al. (1994). The theoretical lattice parameter was used for the initial cell state. Bulk NaAlH4 was sampled at 50 K intervals from 300–650 K; surface slabs at 25 K intervals from 225–425 K. Temperatures were maintained using Nosé-Hoover chains Martyna et al. (1992), with electronic fictitious mass au and au. Following 5 ps of thermalization, each bulk simulation ran for 25 ps and each surface simulation for 15 ps.
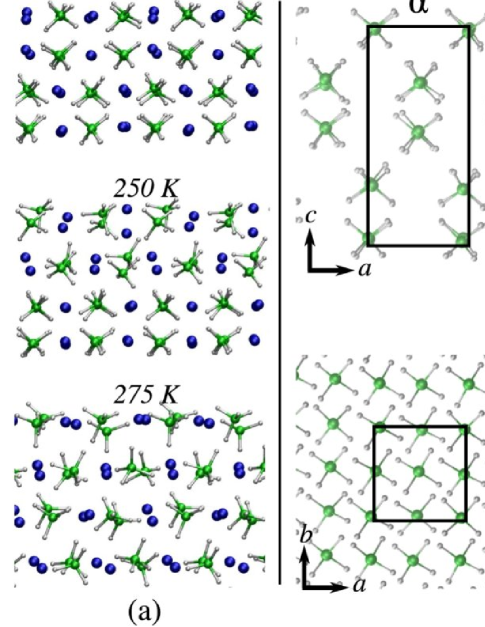
The new phase, designated throughout this Letter as to distinguish it from the high-pressure phase R. S. Kumar et al. (2007), manifests itself in our MD simulations of the (001) surface slab of NaAlH4. Specifically, we find that the (001) slab exhibits a spontaneous transition from the to the phase for K, within 15 ps into the production run. This transition is clearly visible in Fig. 1a, which compares final configurations of the surface slab at select simulation temperatures. (Melting occurred above 350 K; tendency to melt is enhanced by our finite slab thickness). To rule out finite-size or supercell restrictions, we ran additional surface simulations at 300 K, one with a larger 270-atom supercell and one in the NPT ensemble. Both evidenced the same transition to the phase. An NPT simulation of bulk -NaAlH4 at 300 K was also performed, with the new phase remaining stable throughout the run.
Figure 1b illustrates the basic structural differences between the and phases, as observed in the slab simulations. Three qualitative features of the transition emerge in the MD runs: a rotational disordering of the AlH4 groups; an expansion of the crystal along ; and a shear of successive crystal planes parallel to the surface, generating the lattice symmetry of the phase.
In contrast to the surface slab, no structural reorganization was observed in NPT simulations of bulk NaAlH4 (until melting at K). Given its facile expression in the (001) slab, we conclude that any observation of the transition to in the bulk must be kinetically hindered, requiring much longer simulations for observation. This hindrance relates to the volume expansion of the lattice during the transition, as discussed further below.
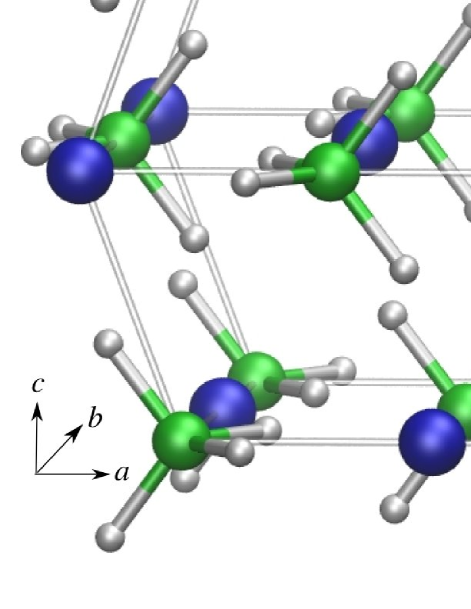
In Fig. 2, we present the structure of -NaAlH4, taken from representative dynamics timesteps and relaxed with respect to all internal parameters and lattice vectors. The unit cell is best described as a 12-atom base-centered orthorhombic (bco) structure with space group Pmmn and Å, Å, and Å (see Table 1 for details; note the near-degeneracy of and ). We compared the energy of this structure, calculated using 216 -points in the full Brillouin Zone, to that of the low-temperature phase, calculated using a 324- point mesh of similar density. At 0 K, the phase is lower in energy by only 9 meV/atom, pointing to a close competition for stability between these two phases. The accuracy of the PBE energetics was also checked against quantum-chemistry calculations on isolated 72-atom clusters of - and -NaAlH4 using the B3LYP functional and a 6-311+G basis; the difference between B3LYP and PBE in the relative stability of the two clusters (likely bracketing the exact result) was 2 meV/atom.
| Atom type | |||
|---|---|---|---|
| Na | 0.141 | 0.141 | 0.250 |
| Al | 0.349 | 0.349 | 0.250 |
| H | 0.198 | 0.198 | 0.067 |
| H | 0.198 | 0.198 | 0.433 |
| H | 0.313 | 0.317 | 0.250 |
| H | 0.317 | 0.313 | 0.250 |
A comparison of Figs. 1 and 2 reveals differences between the phase at finite temperature and its zero-temperature, fully relaxed equivalent. The zero-temperature structure features alignment of H (but not Al) in successive AlH4 tetrahedra along . At finite temperatures, -NaAlH4 instead exhibits an average alignment of Al along , a consequence of randomized AlH4 orientations and increased configurational freedom.
To establish finite-temperature properties, we have calculated the phonons Supplementary Information (2009) and phonon density of states (PDOS) for the and phases using density-functional perturbation theory Baroni et al. (2001). Figure 3 compares the PDOS for -NaAlH4 (in close agreement with Ref. Peles and Chou, 2006) with -NaAlH4. Bands below 180 cm-1 are Na/Al translational lattice modes; 180–580 cm-1, AlH4 rotational modes; 750–900 cm-1, bending modes; and above 1600 cm-1, stretching modes. The most essential difference in the phonon spectra is that the AlH4 rotational modes (350–580 cm-1 in the phase) are softened substantially (200–420 cm-1) in the phase. This translates to an increase in vibrational entropy at temperatures for which these modes are active. We estimate the temperature-dependent free energy of the phases by adding the Bose-Einstein vibrational entropy contribution onto the ground-state total energy :
where sums run over band indices and wavevectors in the first Brillouin Zone. Neglecting further contributions to , we find good agreement between the transition temperature predicted by the free-energy analysis and that found in the dynamics simulations (250 K) when using identical simulation parameters. Upon increasing the plane-wave cutoff and including the Na semicore states to more accurately account for the zero-point motion as reported in Ref. Peles and Chou, 2006, we obtain the results in Fig. 3, indicating a thermodynamic preference for the phase for K (see inset). Notably, this establishes the phase as the stablest variant within the experimental temperature range for dehydrogenation.
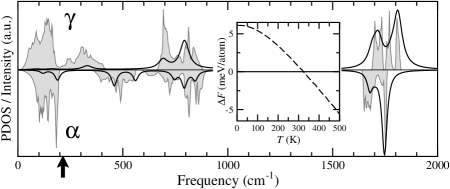
In a recent in-situ Raman study H. Yukawa et al. (2007), Yukawa et al. found evidence of an unknown intermediate phase of NaAlH4 in first-stage dehydrogenation, emerging in the uncatalyzed sample just before melting at 458 K. The authors suggest that, like our proposed -NaAlH4, this phase should be stable upon cooling to near room temperature and contain intact AlH4 units with little constraint from the surrounding crystal lattice. Accordingly, we have calculated the Raman spectrum for -NaAlH4, shown in Fig. 3 Supplementary Information (2009). A comparison between our results and the spectrum at 458 K in Ref. H. Yukawa et al., 2007 shows a remarkable agreement between the two. Foremost, we note the new signature Al–H stretching peak near 1800 cm-1 in both experiment and simulation. The simulations also record a second resonance at 1750 cm-1; although not explicitly visible in Ref. H. Yukawa et al., 2007, asymmetry in their 1800 cm-1 signature does suggest the presence of an additional lower-frequency peak. The difficulty in experimentally resolving these two peaks can be attributed to the thermally averaged nature of the finite-temperature structure with respect to its zero-temperature counterpart, as well as additional soft lattice modes activated during the transition (similar broadening is observable in the pair correlation data of Fig. 4). In the experiment, the 400–500 cm-1 peaks disappear, and distinct peaks at 770 and 817 cm-1 merge into a single broad peak. Both features are also visible in Fig. 3. Note that in reality, the 400–500 cm-1 rotational modes in -NaAlH4 do not disappear in but rather shift to a broad peak at 300 cm-1; however, the corresponding Raman-active peaks are too weak to demonstrate a resolvable signal. Collectively, these similarities present a strong case for the interpretation of the unknown phase in Ref. H. Yukawa et al., 2007 as -NaAlH4.
A closer examination of the MD results elucidates why the transition is not observed in our bulk NPT simulations. In the surface slab simulations, -NaAlH4 nucleated only upon activation of the rotational modes of surface AlH4 units (center panel, Fig. 1a). This agrees with Fig. 3, since softening of AlH4 rotational modes is the predominant contributor to the thermodynamic stability of the phase. However, in bulk -NaAlH4 the AlH4 units cannot rotate: the barrier to rotational mobility is larger than for the relatively unconstrained surface groups, and rotation must be coupled with large volume fluctuations. This makes ready nucleation of the phase in bulk NaAlH4 difficult. Correspondingly, rotation of interior AlH4 units in the (001) surface slab is strongly coupled to the volume expansion perpendicular to the surface. The calculated surface energy of -NaAlH4(001) is also much smaller than -NaAlH4(001) (3.1 versus 8.2 meV/Å2), favoring the transition in the slab. The results show that AlH4 rotation percolates once activated at the surface, as the slab thickness increases to accommodate. This lowers the barrier for -planar shear, finalizing the transition. We therefore assume that nucleation of -NaAlH4 should occur more readily at an exposed (001) surface, at grain boundaries in a polycrystalline sample, or in low-stress regions that can accommodate the local volume fluctuations necessary for AlH4 rotation.
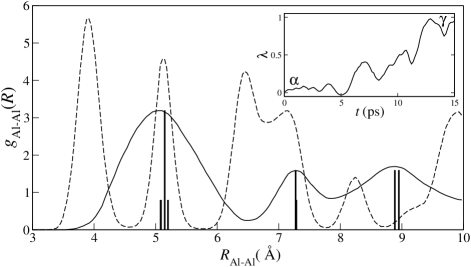
We investigate the transition timescale in the MD simulations by introducing an order parameter as a reaction coordinate, defined as . Here and are the fractional occupancies of the edge-center and corner sublattices in the projection of the unit-cell geometry onto the surface plane (see Fig. 1b). The rapid evolution from (i.e., pure ) to (i.e., pure ) evidences the strong thermodynamic driving force for the transition (see inset, Fig. 4).
Geometric similarities in the aluminum substructures of -NaAlH4 and -Na3AlH6 suggest a phenomenological connection between the transition and the NaAlH4 Na3AlH6 dehydrogenation reaction. These are quantified in Fig. 4, which compares the Al–Al pair correlation function for the (001) slab during the transition with one for Na3AlH6 that is constrained to be lattice matched to the cell. Specifically, -Na3AlH6 peaks were obtained by isotropically shrinking the cell volume (-10%) to match the mean lattice parameter in the plane to the -NaAlH4 cell boundaries. The striking agreement between the locations and relative heights of the two sets of peaks strongly hints at the role of -NaAlH4 as a key intermediate during dehydrogenation. If so, the role of exposed surfaces in nucleating may help to account for the enhancement of dehydrogenation kinetics due to ball milling without a catalyst Anton (2003), as well as improved kinetics of NaAlH4 nanoparticles Zheng et al. (2008). We did not examine the impact of transition metal additives; however, the catalyst is likely to further aid the conversion of -NaAlH4 to -Na3AlH6. A detailed investigation of this possibility is currently underway.
In conclusion, we have discovered and characterized a new phase of NaAlH4, labeled here as . Our description is fully consistent with an unknown intermediate found in a recent in-situ Raman study. Activation of the AlH4 rotational modes drives the transition to , which occurs readily in (001) surface slab simulations for K. The thermodynamic stability of -NaAlH4 beyond this temperature has been further confirmed by vibrational entropy calculations using density-functional perturbation theory. Remarkable structural similarities between -NaAlH4 and -Na3AlH6 suggest that the phase should play a key role in mediating dehydrogenation. Notably, no Al–H bonds were broken in our simulations; this agrees with Ref. Majzoub et al., 2005 and underscores the need for an additional defect-driven mechanism to fully account for dehydrogenation. Accordingly, further investigation of low-energy defects in -NaAlH4 that could facilitate Al–H cleavage is recommended.
Funding was provided by DOE via CSGF and Hydrogen Program DE-FG02-05ER46253. Calculations were performed using Quantum-Espresso P. Giannozzi et al. on facilities provided through NSF Grant DMR-0414849. The authors thank Gerbrand Ceder for helpful discussions, and Elise Li for the quantum-chemistry results.
References
- Schlapbach and Züttel (2001) L. Schlapbach and A. Züttel, Nature 414, 353 (2001).
- Bogdanović and Schwickardi (1997) B. Bogdanović and M. Schwickardi, J. Alloys Comp. 253&254, 1 (1997).
- Schüth et al. (1997) F. Schüth, B. Bogdanović, and M. Felderhoff, Chem. Commun., 2249 (2004).
- M. E. Arroyo y de Dompablo and Ceder (2004) M. E. Arroyo y de Dompablo and G. Ceder, J. Alloys Comp. 364, 6 (2004).
- A. Peles et al. (2004) A. Peles et al., Phys. Rev. B 70, 165105 (2004).
- Aguayo and Singh (2004) A. Aguayo and D. J. Singh, Phys. Rev. B 69, 155103 (2004).
- J. Íñiguez et al. (2004) J. Íñiguez et al., Phys. Rev. B 70, 060101 (2004).
- V. Ozoliņš et al. (2004) V. Ozoliņš, E. H. Majzoub, and T. J. Udovic, J. Alloys Comp. 375, 1 (2004).
- C. Moysés Araùjo et al. (2005) C. Moysés Araùjo et al., Phys. Rev. B 72, 165101 (2005).
- O. M. Løvvik and Opalka (2005) O. M. Løvvik and S. M. Opalka, Phys. Rev. B 71, 054103 (2005).
- Ke and Tanaka (2005) X. Ke and I. Tanaka, Phys. Rev. B 71, 024117 (2005).
- Vegge (2006) T. Vegge, Phys. Chem. Chem. Phys. 8, 4853 (2006).
- Li et al. (2006) S. Li, P. Jena, and R. Ahuja, Phys. Rev. B 73, 214107 (2006).
- Frankcombe and O. M. Løvvik (2006) T. J. Frankcombe and O. M. Løvvik, J. Phys. Chem. B 110, 622 (2006).
- A. Marashdeh et al. (2006) A. Marashdeh et al., Chem. Phys. Lett. 426, 180 (2006).
- Peles and Chou (2006) A. Peles and M. Y. Chou, Phys. Rev. B 73, 184302 (2006).
- Du et al. (2007) A. J. Du, S. C. Smith, and G. Q. Lu, Appl. Phys. Lett. 90, 143119 (2007).
- Peles and Van de Walle (2007) A. Peles and C. G. Van de Walle, Phys. Rev. B 76, 214101 (2007).
- J. Íñiguez and Yildirim (2007) J. Íñiguez and T. Yildirim, J. Phys. Cond. Matt. 19, 176007 (2007); Appl. Phys. Lett. 86, 103109 (2005).
- Gunaydin et al. (2008) H. Gunaydin, K. N. Houk, and V. Ozoliņš, PNAS 105, 3673 (2008).
- (21) P. Giannozzi et al., J. Phys. Condens. Matt. 21, 395502 (2009).
- Perdew et al. (1996) J. P. Perdew, K. Burke, and M. Ernzerhof, Phys. Rev. Lett. 77, 3865 (1996).
- Vanderbilt (1990) D. Vanderbilt, Phys. Rev. B 41, 7892 (1990).
- Troullier and Martins (1991) N. Troullier and J. L. Martins, Phys. Rev. B 43, 1993 (1991).
- Louie et al. (1982) S. G. Louie, S. Froyen, and M. L. Cohen, Phys. Rev. B 26, 1738 (1982).
- Car and Parrinello (1985) R. Car and M. Parrinello, Phys. Rev. Lett. 55, 2471 (1985).
- Focher et al. (1994) P. Focher et al., Europhys. Lett. 26, 345 (1994).
- Martyna et al. (1992) G. J. Martyna, M. L. Klein, and M. E. Tuckerman, J. Chem. Phys. 97, 2635 (1992).
- R. S. Kumar et al. (2007) R. S. Kumar et al., Phys. Rev. B 75, 174110 (2007).
- Supplementary Information (2009) See EPAPS Document No. ??? for list of Raman peak locations and for full phonon and XRD spectra.
- Baroni et al. (2001) S. Baroni, S. de Gironcoli, and A. D. Corso, Rev. Mod. Phys. 73, 515 (2001).
- H. Yukawa et al. (2007) H. Yukawa et al., J. Alloys Comp. 446-447, 242 (2007).
- Anton (2003) D. L. Anton, J. Alloys Comp. 356-357, 400 (2003).
- Zheng et al. (2008) S. Zheng et al., Chem. Mater. 20, 3954 (2008).
- Majzoub et al. (2005) E. H. Majzoub, K. F. McCarty, and V. Ozoliņš, Phys. Rev. B 71, 024118 (2005).