A Proper Motion for the Pulsar Wind Nebula G359.230.82, “the Mouse,” Associated with the Energetic Radio Pulsar J17472958
Abstract
The “Mouse” (PWN G359.230.82) is a spectacular bow shock pulsar wind nebula, powered by the radio pulsar J17472958. The pulsar and its nebula are presumed to have a high space velocity, but their proper motions have not been directly measured. Here we present 8.5 GHz interferometric observations of the Mouse nebula with the Very Large Array, spanning a time baseline of 12 yr. We measure eastward proper motion for PWN G359.230.82 (and hence indirectly for PSR J17472958) of mas yr-1, which at an assumed distance of 5 kpc corresponds to a transverse space velocity of km s-1. Considering pressure balance at the apex of the bow shock, we calculate an in situ hydrogen number density of approximately cm-3 for the interstellar medium through which the system is traveling. A lower age limit for PSR J17472958 of kyr is calculated by considering its potential birth site. The large discrepancy with the pulsar’s spin-down age of 25 kyr is possibly explained by surface dipole magnetic field growth on a timescale 15 kyr, suggesting possible future evolution of PSR J17472958 to a different class of neutron star. We also argue that the adjacent supernova remnant G359.10.5 is not physically associated with the Mouse system but is rather an unrelated object along the line of sight.
Subject headings:
ISM: individual (G359.10.5, G359.230.82) — pulsars: individual (PSR J17472958) — stars: neutron — supernova remnants1. Introduction
The evolution of neutron stars and the potential relationships between some of their observed classes remain outstanding problems in astrophysics. Proper motion studies of neutron stars can provide independent age estimates with which to shed light on these questions. In particular, the well defined geometry of bow shock pulsar wind nebulae (PWNe; Gaensler & Slane 2006), where the relativistic wind from a high-velocity pulsar is confined by ram pressure, can be used as a probe to aid in the understanding of both neutron star evolution and the properties of the local medium through which these stars travel.
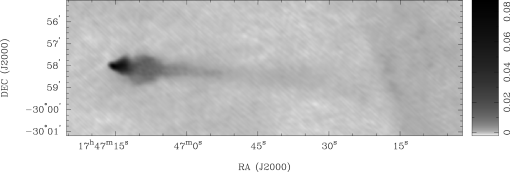
The “Mouse” (PWN G359.230.82), a non-thermal radio nebula, was discovered as part of a radio continuum survey of the Galactic center region (Yusef-Zadeh & Bally, 1987), and was suggested to be powered by a young pulsar following X-ray detection (Predehl & Kulkarni, 1995). It is now recognized as a bow shock PWN moving supersonically through the interstellar medium (ISM; Gaensler et al. 2004). Its axially symmetric morphology, shown in Figure 1, consists of a compact “head”, a fainter “body” extending for 10′′, and a long “tail” that extends westward behind the Mouse for 40′′ and 12′ at X-ray and radio wavelengths respectively (Gaensler et al., 2004; Mori et al., 2005). The cometary tail appears to indicate motion away from a nearby supernova remnant (SNR), G359.10.5 (Yusef-Zadeh & Bally, 1987).
A radio pulsar, J17472958, has been discovered within the “head” of the Mouse (Camilo et al., 2002). PSR J17472958 has a spin period ms and period derivative , implying a spin-down luminosity ergs s-1, surface dipole magnetic field strength G, and characteristic age kyr (Camilo et al. 2002; see also updated timing data from Gaensler et al. 2004). The distance to the pulsar is 4 kpc from X-ray absorption (Gaensler et al., 2004), and 5.5 kpc from HI absorption (Uchida et al., 1992). Here we assume that the system lies at a distance of kpc, where ().
Given such a small characteristic age, it is natural to ask where PSR J17472958 was born and to try and find an associated SNR. While it is possible that no shell-type SNR is visible, such as with the Crab pulsar (Sankrit & Hester, 1997) and other young pulsars (Braun et al., 1989), an association with the adjacent SNR G359.10.5 appears plausible. This remnant was initially suggested to be an unrelated background object near the Galactic center (Uchida et al., 1992). However, it is now believed that the two may be located at roughly the same distance (Yusef-Zadeh & Gaensler 2005, and references therein). By determining a proper motion for PSR J17472958, this association can be subjected to further scrutiny (for example, see analysis of PSR B175724, PWN G5.270.90 and SNR G5.41.2; Blazek et al. 2006; Zeiger et al. 2008).
As PSR J17472958 is a very faint radio source, it is difficult to measure its proper motion interferometrically. It is also difficult to use pulsar timing to measure its proper motion due to timing noise and its location near the ecliptic plane (Camilo et al., 2002). To circumvent these issues, in this paper we investigate dual-epoch high-resolution radio observations of the Mouse nebula, spanning 12 years from 1993 to 2005, with the intention of indirectly inferring the motion of PSR J17472958 through the motion of its bow shock PWN. In § 2 we present these observations. In § 3 we present our analysis and measurement of proper motion using derivative images of PWN G359.230.82. In § 4 we use our measurement to determine an in situ hydrogen number density for the local ISM, to resolve the question of a possible association with SNR G359.10.5, and to investigate the age and possible future evolution of PSR J17472958. We summarize our conclusions in § 5.
2. Observations
PWN G359.230.82 was observed with the Very Large Array (VLA) on 1993 February 2 (Program AF245) and again111An observation of PWN G359.230.82 was also carried out on 1999 October 8 (Program AG571). However, the target was observed mainly at low elevation and the point spread function and spatial frequency coverage were both poor as a result, thus ruling out the observation’s amenability to astrometric comparison. on 2005 January 22 (Program AG671). Each of these observations were carried out in the hybrid BnA configuration at a frequency near 8.5 GHz. The 1993 and 2005 epochs used on-source observation times of 3.12 and 2.72 hours respectively. The 1993 observation only measured and circular polarization products, while the 2005 observation measured the cross terms and as well. Both observations used the same pointing center, located at RA 4715764, Dec ∘58′112 (J2000), as well as the same primary flux calibrator, 3C286. Both were phase-referenced to the extragalactic source TXS 1741312, located at RA 442359, Dec ∘16′3597 (J2000), which is separated by from the pointing center.
Data reduction was carried out in near identical fashion for both epochs using the MIRIAD package (Sault & Killeen, 2006), taking into consideration the slightly different correlator mode used in the 1993 data. This process involved editing, calibrating, and imaging the data using multi-frequency synthesis and square pixels of size 50 50 milli-arcseconds. These images were then deconvolved using a maximum entropy algorithm and smoothed to a common resolution with a circular Gaussian of full width at half-maximum (FWHM) 081. The resulting images are shown in the left column of Figure 2.
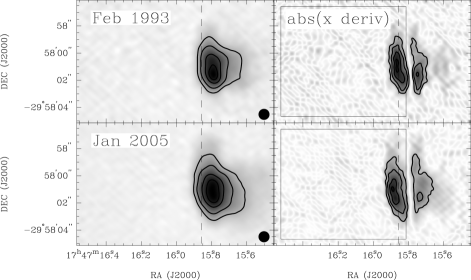
The peak flux densities of the 1993 and 2005 images are 3.24 and 3.25 mJy beam-1, respectively; the noise in these two images are 51 and 35 Jy beam-1, respectively. The pulsar J17472958 is located at RA 4715882, Dec ∘58′10 (J2000), within the region of intense synchrotron emission seen in each image (see § 3.5 of Gaensler et al. 2004). Qualitatively comparing each epoch from the left column of Figure 2, it appears that the head of PWN G359.230.82 has the same overall shape in both images, with a quasi-parabolic eastern face, approximate axial symmetry along a horizontal axis through the centre of the nebula (although the position of peak intensity seems to shift slightly in declination), and a small extension to the west. By eye the PWN seems to be moving from west to east over time, in agreement with expectation from the cometary morphology seen in Figure 1. Beyond any minor morphological changes seen between the images in the left column of Figure 2, the Mouse nebula seems to have expanded slightly over time.
3. Analysis
To quantify any motion between epochs, an algorithm was developed to evaluate the cross-correlation coefficient over a range of pixel shifts between images, essentially by producing a map of these coefficients. This algorithm made use of the Karma visualization package (Gooch, 1996) to impose accurate non-integer pixel shifts.
We applied our algorithm to the image pair from the left column of Figure 2 to determine an image offset measurement. To check that this offset measurement would be robust against any possible nebular morphological change between epochs, we also applied our algorithm to the same image pair when both images were equally clipped at various flux density upper-level cutoffs. We found that the offset measurement was strongly dependent on the choice of flux density cutoff. Clearly such variation in the measured shift between epochs was not desirable, as selection of a final solution would have required an arbitrary assumption about the appropriate level of flux density clipping to use. There was also no strong indication that the region of peak flux density in each image coupled with the exact location of PSR J17471958. In order to isolate the motion of the pulsar from as much nebular morphological change as possible, we focused on a different method involving the cross-correlation of spatial derivatives of the images from the left column of Figure 2.
As there is not enough information to solve for an independent Dec-shift, we will only focus on an RA-shift, and will assume that any Dec changes are primarily due to morphological evolution of the Mouse nebula. To justify this assumption, we note simplistically that the cometary tail of the Mouse in Figure 1 is oriented at 5∘ from the RA-axis, and thus estimate that any Dec motion contributes less than 10% to the total proper motion of the nebular system. The small angle also justifies our decision not to calculate derivatives along orthogonal axes rotated against the RA-Dec coordinate system.
For each epoch, an image of the first spatial derivative of intensity in the x (RA) direction was created by shifting the original image by 0.1 pixels along the RA-axis, subtracting the original from this shifted version, and then dividing by the value of the shift. These x-derivative images are shown in the right column of Figure 2, where the brighter pixels represent regions of larger x-derivative from the corresponding left column images (note that these derivative images are shown in absolute value so as to increase their visual contrast; this operation was not applied to the analyzed data).
The x-derivative images have signal-to-noise ratios 13, since progression to higher derivatives degrades sensitivity. As seen in the right column of Figure 2, the x-derivative images of the Mouse are divided into two isolated regions: an eastern forward region and a western rear region. Derivatives in the eastern region are greater in magnitude than those in the western region.
As we will justify in § 4, we propose that the eastern region of the x-derivative images tracks the forward termination shock of the Mouse nebula, which in turn acts as a proxy for an upper limit on the motion of PSR J17472958. The eastern region provides a natural localized feature at each epoch with which to generate cross-correlation maps in order to track the motion of PSR J17472958.
3.1. Calculation of Nebular Proper Motion
To prepare the x-derivative images for cross-correlation, their eastern regions, extending between Right Ascensions (J2000) of 1747158 and 1747165 (see Figure 2), were extracted and padded along each side with 50 pixels (2500 mas) of value zero. These cropped and padded x-derivative images for the 1993 and 2005 epochs were then cross-correlated with each other over a range of non-integer pixel shifts between 2500 and 2500 mas in both RA and Dec. The resultant 20051993 cross-correlation map, which indicates the shift required to make the 1993 epoch colocate with the 2005 epoch, is shown in the left of Figure 3.
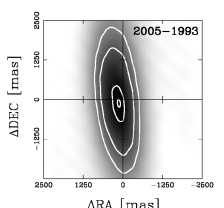

Note that the map in Figure 3 incorporates trial shifts large enough to probe regions where the cross-correlation falls to zero (corresponding to cross-correlation between signal and a source-free region, as opposed to only probing trial shifts close to the maxima of each x-derivative map). In this way, the contours presented in Figure 3 represent percentages of the peak cross-correlation value.
To quantify the shift between epochs, a profile along a line parallel to the RA-axis was taken through the peak of the cross-correlation map, as shown in the right of Figure 3. We assume that morphological changes are negligible in the eastern region of the x-derivative images; therefore, by taking a profile through the peak we tolerate small Dec shifts between the two epochs.
The RA shift between the 2005 and 1993 epochs was determined by fitting a Gaussian to the central 660 mas of the cross-correlation profile. The resultant shift is 154 mas with a statistical uncertainty of 7 mas, where the latter is equal to the FWHM divided by twice the signal-to-noise ratio. This calculation reflects the angular resolution and noise in the images, but to completely quantify the error on the shift between the two epochs, systematic errors also need to be incorporated.
To estimate the positional error in the image plane, corresponding to phase error in the spatial frequency plane, the phases of the complex visibility data for each epoch were self-calibrated222Note that self-calibration was not used in the general reduction process because it would have caused a degradation in relative positional information between the final images, as the phases would no longer be tied to a secondary calibrator of known position.. By dividing the standard error of the mean of the phase variation in the gain solutions by 180∘, the fraction of a diffraction-limited beam by which positions may have been in error in the image plane were calculated. By multiplying this fraction with the diffraction limited beamwidth for the 1993 and 2005 epochs, the two-dimensional relative positional uncertainty of these two reference frames was estimated to be 22 and 20 mas respectively.
The systematic error in our measurement, which describes the relative positional error between the two epochs, was then determined by reducing the self-calibrated positional uncertainties for each epoch by (we are only looking at random positional uncertainties projected along the RA-axis), and added in quadrature. This error was found to be 21 mas, which totally dominates the much smaller statistical error of 7 mas.
By calculating the total error as the quadrature sum of the statistical and systematic errors, the RA-shift of the PWN tip between the 1993 and 2005 epochs was found to be mas. When divided by the 4372 days elapsed between these two epochs, the measured shift corresponds to a proper motion of mas yr-1 in an eastward direction. We therefore detect motion at the level. Note that, at an assumed distance of 5 kpc along a line of sight toward the Galactic center, this motion is unlikely to be contaminated significantly by Galactic rotation (Olling & Merrifield, 1998).
If we simplistically compare the eastward component of the proper motion with the angle of the Mouse’s cometary tail, as described earlier in § 3, we obtain a crude estimate of 1 mas yr-1 for the northerly component of the nebula’s proper motion. As this value is well within the error for the eastward motion, which is dominated by systematic effects, we feel that our earlier assumption of pure eastward motion in the presence of relative positional uncertainty between the 1993 and 2005 reference frames is justified.
4. Discussion
Bow shock PWNe have a double-shock structure consisting of an outer bow shock where the ambient ISM is collisionally excited, an inner termination shock at which the pulsar’s relativistic wind is decelerated, and a contact discontinuity between these two shocks which marks the boundary between shocked ISM and shocked pulsar wind material (Gaensler & Slane, 2006). The outer bow shock may emit in H, though for systems such as PWN G359.230.82 with high levels of extinction along their line of sight, the detection of such emission would not be expected. The inner termination shock, which encloses the pulsar’s relativistic wind, may emit synchrotron radiation detectable at radio/X-ray wavelengths. It is expected that any synchrotron emission beyond the termination shock would be sharply bounded by the contact discontinuity (Gaensler et al., 2004).
As mentioned in § 3, we suggest that the eastern regions of the x-derivative images from Figure 2 provide the best opportunity to track motion of PSR J17472958, relatively independent of any morphological changes occurring in PWN G359.230.82. Physically, these regions of greatest spatial derivative (along the RA-axis) might correspond to the vicinity of the termination shock apex, or possibly the contact discontinuity between the two forward shocks, where motion of the pulsar is causing confinement of its wind and where rapid changes in flux might be expected to occur over relatively small angular scales. This is consistent with hydrodynamic simulations which predict that the apex of the bow shock will be located just outside a region of intense synchrotron emission in which the pulsar lies (Bucciantini, 2002; van der Swaluw et al., 2003).
The assumption that the eastern region of each x-derivative image can be used as a proxy to track the motion of PSR J17472958 is therefore plausible, but difficult to completely justify. To show that motion calculated in this way provides an upper limit to the true motion of PSR J17472958 we recall the overall morphological change described at the end of § 2, namely that the Mouse nebula has expanded with time between the 1993 to 2005 epochs. This expansion suggests that the ISM density may be dropping, causing the termination shock to move further away from pulsar, so that any motion calculated using the nebula may in fact overestimate the motion of the pulsar (a similar argument was used by Blazek et al. 2006 in placing an upper limit on the motion of the PWN associated with PSR B175724). Such changes in density are to be expected as the nebula moves through interstellar space, where like the spectacular Guitar nebula (Chatterjee & Cordes, 2004) motion may reveal small-scale inhomogeneities in the density of the ISM. We therefore assume that our measurement of proper motion from § 3.1 corresponds to an upper limit on the true proper motion of PSR J17472958.
4.1. Space Velocity and Environment of PSR J17472958
Using our proper motion result from § 3.1 and the arguments for interpreting this motion as an upper limit from § 4, the projected eastward velocity of PSR J17472958 is inferred to be km s-1. Given that no motion along the line of sight or in Dec could be measured, we will assume that our estimate of approximates the 3-dimensional space velocity .
In a bow shock PWN, the pulsar’s relativistic wind will be confined and balanced by ram pressure. Using our proper motion upper limit (assuming ), the pressure balance relationship333This relationship assumes a uniform density with typical cosmic abundances, expressed as , where is the mass of a hydrogen atom and is the number density of the ambient ISM. km s-1 from § 4.4 of Gaensler et al. (2004), and Monte Carlo simulation, we find an in situ hydrogen number density cm-3 at 68% confidence, or cm-3 at 95% confidence. Our calculated density implies a local sound speed of 5 km s-1, corresponding to motion through the warm phase of the ISM.
Our space velocity for PSR J17472958 is comparable with other pulsars that have observed bow shocks (Chatterjee & Cordes, 2002), and is consistent with the overall projected velocity distribution of the young pulsar population (Hobbs et al., 2005; Faucher-Giguère & Kaspi, 2006). We note that Gaensler et al. (2004) estimated a proper motion and space velocity of 25 mas yr-1 and 600 km s-1, respectively, which are a factor of two larger than the values determined in this paper. However, by halving their assumed sound speed of 10 km s-1, their estimates of motion correspondingly halve.
We now use our proper motion and hydrogen number density results to resolve the question of association between PSR J17472958 and SNR G359.10.5, and to investigate the age and possible future evolution of this pulsar.
4.2. Association with SNR G359.10.5?
If PSR J17472958 and the adjacent SNR G359.10.5 are associated and have a common progenitor, then an age estimate for the system that is independent of both distance and inclination effects is simply the time taken for the pulsar to traverse the eastward angular separation between the explosion site inferred from the SNR morphology and its current location, at its inferred eastward proper motion . Assuming pulsar birth at the center of the SNR, the eastward angular separation between the center of SNR G359.10.5 from Uchida et al. (1992) and the location of PSR J17472958 from the timing solution by Gaensler et al. (2004) is found to be , which would imply a system age of 110 kyr.
Given such a large age, and the unremarkable interstellar hydrogen number density at the (currently assumed) nearby Mouse (from § 4.1), it would be difficult to argue why SNR G359.10.5 has not dissipated and faded from view. Instead, SNR G359.10.5 appears to be a middle aged remnant 18 kyr old which continues to emit thermal X-rays (Bamba et al., 2000). We conclude, independent of distance estimates to either the pulsar or the SNR, that PSR J17472958 is moving too slowly to be physically associated with the relatively young SNR G359.10.5.
4.3. Age Estimate for PSR J17472958
Given that an association between the Mouse and SNR G359.10.5 is unlikely, as outlined in § 4.2, we now estimate the age of PSR J17472958 assuming that it is unrelated to this SNR.
As seen in Figure 1, there is a cometary tail of emission extending around 12′ (17 pc) westward of the Mouse, containing shocked pulsar wind material flowing back from the termination shock about PSR J17472958 (Gaensler et al., 2004). We begin by simplistically assuming that this pulsar was born at the tail’s western tip. By dividing the tail length by the proper motion , we estimate an age of kyr. Note that this age is independent of any distance estimates to the Mouse or of inclination effects. However, given that the tail appears to simply fade away rather than terminate suddenly, it is possible that tail could be much longer, and thus that the system could be much older (by considering the upper limit arguments from § 4, this system age may be even greater still). As discussed in § 4.7 of Gaensler et al. (2004), it is unlikely that the Mouse or its entire tail could still be located inside an unseen associated SNR, given that the tail is smooth and uninterrupted. In addition, the lack of a rejuvenated SNR shell anywhere along the length of the tail (or indeed beyond it), such as that seen, for example, in the interaction between PSR B195132 and SNR CTB80 (van der Swaluw et al., 2002), supports the conclusion that the Mouse’s tail is located entirely in the ISM. Therefore, the rim of the Mouse’s unseen associated SNR must be located at a minimum angular separation of 12′ west of the Mouse’s current location, implying that is a lower limit on the time elapsed since PSR J17472958 was in the vicinity of this rim.
To estimate the total age of PSR J17472958 we thus need to incorporate the time taken for this pulsar to escape its associated SNR and reach its current location, taking into account the continued expansion of the SNR following pulsar escape (which will sweep up, and therefore shorten, part of the Mouse’s tail initially located in the ISM). Using Monte Carlo simulation and following van der Swaluw et al. (2003), we find that the time taken for a pulsar, traveling with velocity km s-1 through a typical interstellar environment with constant hydrogen number density from § 4.1, to escape from its SNR (while in the pressure-drive snowplow phase) of typical explosion energy 1051 ergs, and leave behind a 12′ tail in the ISM which remains ahead of the expanding SNR, is kyr at 68% confidence, or kyr at 95% confidence. Note that the errors quoted for this total time incorporate the error in and are only weakly dependent on the uncertainty in distance (for comparison, when the distance to PSR J17472958 is fixed at 5 kpc, the 68% and 95% confidence intervals are reduced to kyr and kyr, respectively).
Assuming that PSR J17472958 was created in such a supernova explosion, and noting that the pulsars’s travel time in the ISM is a lower limit (even without taking into account the upper limit associated with , as described earlier in this section), we can thus establish a lower limit on the age of the pulsar of kyr (68% confidence). This lower limit is greater than 6 times the characteristic age 25.5 kyr of PSR J17472958, which was derived from its measured pulse and (Camilo et al., 2002), suggesting that, within the context of the characteristic approximation, the spindown properties of this pulsar deviate significantly from magnetic dipole braking (see § 4.4).
Our result is similar to the age discrepancy previously claimed for PSR B175724 (Gaensler & Frail, 2000); however, ambiguity regarding association with SNR G5.41.2 presents difficulties with this claim (Thorsett et al., 2002; Zeiger et al., 2008). In comparison, given the relatively simple assumptions made in this paper, PSR J17472958 arguably provides the most robust evidence to date that some pulsars may be much older than their characteristic age. We now discuss the potential implications of this age discrepancy with regard to the future evolution of PSR J17472958.
4.4. Possible Future Evolution of PSR J17472958
Pulsars are assumed to slow down in their rotation according to the spin-down relationship , where is the pulsar’s angular rotation frequency, is the angular frequency derivative, is the braking index, and is a positive constant that depends on the pulsar’s moment of inertia and magnetic moment. By taking temporal derivatives of this spin-down relationship, the rate at which the characteristic age changes with time can be expressed as = (e.g., Lyne 2004). Evaluating as the ratio between 25.5 kyr and the lower age limit , we estimate a braking index of for PSR J17472958 (incorporating the error limits from does not significantly affect this value). Given that magnetic dipole braking corresponds to (the value assumed when calculating ), the smaller braking index calculated here indicates that either some form of non-standard pulsar braking is taking place, or that standard magnetic dipole braking is occurring in the presence of evolution of the magnetic field or of the moment of inertia (e.g., Blandford & Romani 1988; Camilo 1996). If we adopt a constant moment of inertia and assume standard electromagnetic dipole braking, then by performing a similar derivation from the spin-down relationship for the surface magnetic field, the magnetic field growth timescale can be expressed as = (e.g., Lyne 2004). Evaluating this with our braking index, the magnetic field growth timescale444As noted by Lyne (2004) the magnetic field growth is not linear over time, as can be appreciated by taking an example of a pulsar with braking index =1. is estimated to be 15 kyr.
It is interesting to note that the braking index inferred here for PSR J17472958 is comparable to the value obtained from an estimate of made for the Vela pulsar B083345, which was found to have (Lyne et al., 1996). To investigate the possible future evolution of PSR J17472958, we plot its implied trajectory (along with that of the Vela pulsar) across the diagram, as shown in Figure 4. Note that the magnitude of each plotted vector indicates motion over a timescale of 50 kyr assuming that is constant, which is not true for constant ; however, the trend is apparent. The longer vector for the Vela pulsar simply indicates that it is braking more rapidly than PSR J17472958.
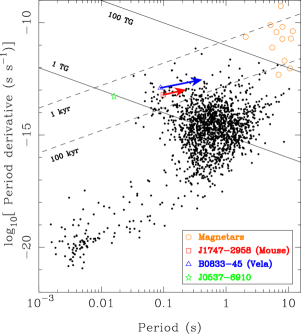
The plotted vectors for the Vela and Mouse pulsars both seem to point in the direction of the magnetars (high-energy neutron stars for which 1014 G; for a review of magnetars, see Woods & Thompson 2006). By extrapolating the trajectories in Figure 4, and assuming negligible magnetic field decay over time, it can be suggested that young, energetic, rapidly spinning pulsars such as PSR J05376910 (Marshall et al., 1998), whose location in the plane is shown with a star symbol, may evolve into objects like the Vela or Mouse pulsars, which, as proposed by Lyne (2004), may in turn continue to undergo magnetic field growth until arriving in the parameter space of the magnetars.
5. Conclusions
We have investigated two epochs of interferometric data from the VLA spanning 12 years to indirectly infer a proper motion for the radio pulsar J17472958 through observation of its bow shock PWN G359.230.82. Derivative images were used to highlight regions of rapid spatial variation in flux density within the original images, corresponding to the vicinity of the forward termination shock, thereby acting as a proxy for the motion of the pulsar.
We measure an eastward proper motion for PWN G359.230.82 of mas yr-1, and interpret this value as an upper limit on the motion of PSR J17472958. At this angular velocity, we argue that PSR J17472958 is moving too slowly to be physically associated with the relatively young adjacent SNR G359.10.5, independent of distance estimates to either object or of inclination effects.
At a distance kpc, the proper motion corresponds to a projected velocity of km s-1, which is consistent with the projected velocity distribution for young pulsars. Combining the time taken for PSR J17472958 to traverse its smooth 12′ radio tail with the time to escape a typical SNR, we calculate a lower age limit for PSR J17472958 of kyr (68% confidence).
The lower age limit exceeds the characteristic age of PSR J17472958 by more than a factor of 6, arguably providing the most robust evidence to date that some pulsars may be much older than their characteristic age. This age discrepancy for PSR J17472958 suggests that the pulsar’s spin rate is slowing with an estimated braking index and that its magnetic field is growing on a timescale 15 kyr. Such potential for magnetic field growth in PSR J17472958, in combination with other neutron stars that transcend their archetypal categories such as PSR J17183718, a radio pulsar with a magnetar-strength magnetic field that does not exhibit magnetar-like emission (Kaspi & McLaughlin, 2005), PSR J18460258, a rotation-powered pulsar that exhibits magnetar-like behaviour (Gavriil et al., 2008; Archibald et al., 2008), and magnetars such as 1E 1547.05408 that exhibit radio emission (Camilo et al. 2008, and references therein), supports the notion that there may be evolutionary links between the rotation-powered and magnetar classes of neutron stars. However, such a conclusion may be difficult to reconcile with evidence suggesting that magnetars are derived from more massive progenitors than normal pulsars (e.g., Gaensler et al. 2005; Muno et al. 2006). If the massive progenitor hypothesis is correct, then this raises further questioning of whether, like the magnetars, there is anything special about the progenitor properties of neutron stars such as PSR J17472958, or whether all rotation-powered pulsars exhibit similar magnetic field growth or even magnetar-like phases in their lifetimes.
To constrain the motion of PSR J17472958 further, future observational epochs are desirable. It may be possible to better constrain the motion and distance to this pulsar by interferometric astrometry with the next generation of sensitive radio telescopes (e.g., Cordes et al. 2004). High time resolution X-ray observations may also be useful to detect any magnetar-like behaviour from this rotation-powered radio pulsar. In general, more neutron star discoveries, as well as measured or inferred braking indices, may allow for a better understanding of possible neutron star evolution.
References
- Archibald et al. (2008) Archibald, A. M., Kaspi, V. M., Livingstone, M. A., & McLaughlin, M. A. 2008, ApJ, 688, 550
- Bamba et al. (2000) Bamba, A., Yokogawa, J., Sakano, M., & Koyama, K. 2000, PASJ, 52, 259
- Blandford & Romani (1988) Blandford, R. D., & Romani, R. W. 1988, MNRAS, 234, 57P
- Blazek et al. (2006) Blazek, J. A., Gaensler, B. M., Chatterjee, S., van der Swaluw, E., Camilo, F., & Stappers, B. W. 2006, ApJ, 652, 1523
- Braun et al. (1989) Braun, R., Goss, W. M., & Lyne, A. G. 1989, ApJ, 340, 355
- Bucciantini (2002) Bucciantini, N. 2002, A&A, 387, 1066
- Camilo (1996) Camilo, F. 1996, in Pulsars: Problems and Progress, ed. S. Johnston, M. A. Walker, & M. Bailes (San Francisco: ASP), 105, 39
- Camilo et al. (2002) Camilo, F., Manchester, R. N., Gaensler, B. M., & Lorimer, D. R. 2002, ApJ, 579, L25
- Camilo et al. (2008) Camilo, F., Reynolds, J., Johnston, S., Halpern, J. P., & Ransom, S. M. 2008, ApJ, 679, 681
- Chatterjee & Cordes (2002) Chatterjee, S., & Cordes, J. M. 2002, ApJ, 575, 407
- Chatterjee & Cordes (2004) Chatterjee, S., & Cordes, J. M. 2004, ApJ, 600, L51
- Cordes et al. (2004) Cordes, J. M., Kramer, M., Lazio, T. J. W., Stappers, B. W., Backer, D. C., & Johnston, S. 2004, New Astronomy Review, 48, 1413
- Faucher-Giguère & Kaspi (2006) Faucher-Giguère, C.-A., & Kaspi, V. M. 2006, ApJ, 643, 332
- Gaensler et al. (2004) Gaensler, B. M., van der Swaluw, E., Camilo, F., Kaspi, V. M., Baganoff, F. K., Yusef-Zadeh, F., & Manchester, R. N. 2004, ApJ, 616, 383
- Gaensler et al. (2005) Gaensler, B. M., McClure-Griffiths, N. M., Oey, M. S., Haverkorn, M., Dickey, J. M., & Green, A. J. 2005, ApJ, 620, L95
- Gaensler & Frail (2000) Gaensler, B. M., & Frail, D. A. 2000, Nature, 406, 158
- Gaensler & Slane (2006) Gaensler, B. M., & Slane, P. O. 2006, ARA&A, 44, 17
- Gavriil et al. (2008) Gavriil, F. P., Gonzalez, M. E., Gotthelf, E. V., Kaspi, V. M., Livingstone, M. A., & Woods, P. M. 2008, Science, 319, 1802
- Gooch (1996) Gooch, R. 1996, in Astronomical Data Analysis Software and Systems V, ed. G. H. Jacoby, & J. Barnes (San Francisco: ASP), 101, 80
- Hobbs et al. (2005) Hobbs, G., Lorimer, D. R., Lyne, A. G., & Kramer, M. 2005, MNRAS, 360, 974
- Kaspi & McLaughlin (2005) Kaspi, V. M., & McLaughlin, M. A. 2005, ApJ, 618, L41
- Lyne (2004) Lyne, A. G. 2004, in Young Neutron Stars and Their Environments, ed. F. Camilo & B. M. Gaensler (San Francisco: ASP), 218, 257
- Lyne et al. (1996) Lyne, A. G., Pritchard, R. S., Graham-Smith, F., & Camilo, F. 1996, Nature, 381, 497
- Manchester et al. (2005) Manchester, R. N., Hobbs, G. B., Teoh, A., & Hobbs, M. 2005, AJ, 129, 1993, http://www.atnf.csiro.au/research/pulsar/psrcat/
- Marshall et al. (1998) Marshall, F. E., Gotthelf, E. V., Zhang, W., Middleditch, J., & Wang, Q. D. 1998, ApJ, 499, L179
- Mori et al. (2005) Mori, H., Maeda, Y., Pavlov, G. G., Sakano, M., & Tsuboi, Y. 2005, Advances in Space Research, 35, 1137
- Muno et al. (2006) Muno, M. P., et al. 2006, ApJ, 636, L41
- Olling & Merrifield (1998) Olling, R. P., & Merrifield, M. R. 1998, MNRAS, 297, 943
- Predehl & Kulkarni (1995) Predehl, P., & Kulkarni, S. R. 1995, A&A, 294, L29
- Sault & Killeen (2006) Sault, R. J., & Killeen, N. E. B. 2006, The Miriad User’s Guide (Sydney: ATNF), http://www.atnf.csiro.au/computing/software/miriad/
- Sankrit & Hester (1997) Sankrit, R., & Hester, J. J. 1997, ApJ, 491, 796
- Thorsett et al. (2002) Thorsett, S. E., Brisken, W. F., & Goss, W. M. 2002, ApJ, 573, L111
- Uchida et al. (1992) Uchida, K., Morris, M., & Yusef-Zadeh, F. 1992, AJ, 104, 1533
- van der Swaluw et al. (2003) van der Swaluw, E., Achterberg, A., Gallant, Y. A., Downes, T. P., & Keppens, R. 2003, A&A, 397, 913
- van der Swaluw et al. (2002) van der Swaluw, E., Achterberg, A., & Gallant, Y. A. 2002, in Neutron Stars in Supernova Remnants, ed. P. O. Slane & B. M. Gaensler (San Francisco: ASP), 271, 135
- Woods & Thompson (2006) Woods, P. M., & Thompson, C. 2006, in Compact stellar X-ray sources, ed. W. Lewin & M. van der Klis (Cambridge, UK: Cambridge University Press), 547
- Yusef-Zadeh & Bally (1987) Yusef-Zadeh, F., & Bally, J. 1987, Nature, 330, 455
- Yusef-Zadeh & Gaensler (2005) Yusef-Zadeh, F., & Gaensler, B. M. 2005, Advances in Space Research, 35, 1129
- Zeiger et al. (2008) Zeiger, B. R., Brisken, W. F., Chatterjee, S., & Goss, W. M. 2008, ApJ, 674, 271