The SWIRE/Chandra Survey: The X-ray Sources.
Abstract
We report a moderate-depth (70 ksec), contiguous 0.7 deg2, Chandra survey, in the Lockman Hole Field of the Spitzer/SWIRE Legacy Survey coincident with a completed, ultra-deep VLA survey with deep optical and near-infrared (NIR) imaging in-hand. The primary motivation is to distinguish starburst galaxies and Active Galactic Nuclei, including the significant, highly obscured (log 23) subset. Chandra has detected 775 X-ray sources to a limiting broad band (0.3-8 keV) flux erg cm-2 s-1. We present the X-ray catalog, fluxes, hardness ratios and multi-wavelength fluxes. The log N vs. log S agrees with those of previous surveys covering similar flux ranges. The Chandra and Spitzer flux limits are well matched: 771 (99%) of the X-ray sources have IR (infared) or optical counterparts, and 333 have MIPS 24 m detections. There are 4 optical-only X-ray sources and 4 with no visible optical/IR counterpart. The very deep (2.7 Jy rms) VLA data yields 251 () radio counterparts, 44% of the X-ray sources in the field. We confirm that the tendency for lower X-ray flux sources to be harder is primarily due to absorption. As expected, there is no correlation between observed IR and X-ray flux. Optically bright, Type 1 and red AGN lie in distinct regions of the IR vs X-ray flux plots, demonstrating the wide range of SEDs in this sample and providing the potential for classification/source selection. Many optically-bright sources, which lie outside the AGN region in the optical vs X-ray plots (), lie inside the region predicted for red AGN in IR vs X-ray plots consistent with the presence of an active nucleus. More than 40% of the X-ray sources in the VLA field are radio-loud using the classical definition, RL. The majority of these are red and relatively faint in the optical so that the use of RL to select those AGN with the strongest radio emission becomes questionable. Using the 24 m to radio flux ratio (q24) instead results in 13 of the 147 AGN with sufficient data being classified as radio-loud, in good agreement with the 10% expected for broad-lined AGN based on optical surveys. We conclude that q24 is a more reliable indicator of radio-loudness. Use of RL should be confined to optically-selected, Type 1 AGN.
1 Introduction
SWIRE, the largest Spitzer Legacy program, is tracing the evolution of dusty, star-forming galaxies, evolved stellar populations and AGN, as a function of environment from z 2.5 to the present epoch. SWIRE covers 6 fields with a total area of 49 deg2 in all seven Spitzer bands, selected from the entire IRAS/DIRBE sky as those areas with the lowest 100 surface brightness (which scales with , Schlegel et al. 1998); the Lockman Hole is one of the two best regions, having several contiguous deg2 of low () sky. SWIRE’s power comes from its large surface area, its depth, which probes the Universe out to redshifts z 2.5 and over time intervals , and its sensitivity to both evolved stellar populations (IRAC: 3–8) and dusty objects (starbursts & obscured AGN; MIPS: 24,70,160). Thus their distribution relative to environment, and evolution with respect to time and to the development of structure, can be studied together. SWIRE is one of several, on-going, medium-depth surveys which fill the gap between the deep and shallow surveys, dramatically illustrating the need for a multi-layered approach to efficiently fill the L-z plane in several wave-bands.
The SWIRE prime science goal is to study the structure, evolution and environments of AGN, starbursts and spheroidal galaxies out to z2.5. Key to this extensive multi-wavelength campaign is an X-ray survey deep enough to distinguish starbursts and AGN, including the significant numbers which are highly obscured 1023 cm-2. We carried out a Chandra X-ray survey in the best (in terms of Galactic extinction and absence of nearby bright sources, including no bright radio sources) extragalactic 1 deg2 field within SWIRE. The X-ray observations cover 0.7 deg2 contiguously. The broad band (0.3-8.0 keV) flux limit is erg cm-2 s-1 at the field centers, sufficient to detect all SWIRE IR AGN except for those with high absorption at low redshift (z0.8, log N 24) while IR galaxies are not detected. Thus we are able to distinguish all but the most highly obscured AGN from amongst the IR sources by their X-ray emission.
The standard AGN model includes a super-massive black hole surrounded by an accretion disk in the center of a galaxy. The central regions of the AGN produce strong, hard X-ray emission (and relativistic jets in radio-loud sources) along with thermal emission from an accretion disk. Gas in the vicinity is heated by the nuclear emission and produces the broad and narrow emission lines characteristic of Type 1 and Type 2 AGN respectively. The viewing orientation of an AGN effects its classification, as demonstrated by the detection of polarized broad lines in NGC1068 (Antonucci & Miller 1985). This result led to a general acceptance that some fraction of Type 2 AGN are edge-on Type 1s. Such unification schemes require highly opaque dust surrounding the accretion disk. In addition to obscuring our view to the nucleus, this dust is heated by the nuclear source producing strong IR emission. Thus the observed Spectral Energy Distribution (SED) of an AGN is dependent on viewing angle and the traditional optical/ultraviolet surveys are incomplete to obscured sources (e.g. Polletta et al. 2006). It is now clear that there is a significant obscured AGN population which has been missed from earlier surveys. The powerful combination of radio, X-ray and IR observations available for the current surveys facilitates a different and potentially unbiased view of the AGN in the field and so probes the full AGN population, including obscured sources. The variety of new techniques has resulted in new types of AGN being found, including: red AGN (Cutri et al. 2002), X-ray bright optically-normal galaxies (XBONGS, Comastri et al. 2002), Type 2 quasars (Norman et al. 2002), X-ray detected Extremely Red Objects (V/EROs, Alexander et al. 2002, Brusa et al. 2005).
Despite the several multi-wavelength surveys in progress during this era of Great Observatories, a full view of the AGN population remains elusive. Shallow surveys, which are dominated by Type 1 AGN, find largely distinct subsets of the population depending on waveband (Hickox et al. 2009). While overlap is significant in deeper surveys, selection in any single waveband does not find all the AGN (Barmby et al 2006, Polletta et al. 2006, Donley et al. 2008, Park et al. 2008). Samples of obscured AGN remain relatively small and biases are still in the process of being understood, so that the nature of the new AGN and their significance to the population as a whole remain undetermined. Compton thick AGN are hard to find because their X-ray flux is obscured to energies 10 keV. Estimates of the fraction of the general population which are Compton thick vary. X-ray selected AGN include % (Polletta et al. 2006, Treister et al. 2004) Compton-thick sources. This number doubles to when IR-selected AGN are included (Polletta et al. 2006, Treister et al. 2009). Estimates generated by stacking X-rays from IR-selected AGN also suggest a factor of two increase in IR-selected compared with X-ray selected Compton thick AGN (Fiore et al. 2008, Daddi et al. 2007), although the absolute numbers differ by factors of 100 depending on selection techniques and assumptions. The latest estimate from modeling the Cosmic X-ray Background (CXRB) postulates an obscured population larger than the unobscured by a factor of 8 at low luminosities, half of which are Compton thick. This decreases to a factor of 2 at high luminosities (Gilli, Comastri & Hasinger 2007). Alternatively, many X-ray-selected, low-luminosity AGN may be intrinsically X-ray hard rather than obscured, possibly reducing the fraction of obscured (including Compton thick) AGN to 20% (Hopkins et al. 2009).
A number of wide area, multi-wavelength surveys with sufficient depth to view the full AGN population are currently in progress, including: ECDFS (Lehmer et al. 2005, 0.3 deg2), OPTX (Trouille et al. 2008, 1 deg2 non-contiguous), SWIRE/Chandra (this paper, 0.7 deg2), AEGIS-X (Laird et al. 2009, 0.67 deg2), and C-COSMOS (Elvis et al. 2009, 0.5+0.4 deg2). They are beginning to provide significant samples of the relatively rare sources, such as the high redshift or obscured AGN, found in small numbers in the deep Chandra surveys (Luo et al. 2008, Alexander et al. 2003). These various surveys will allow us to properly characterize these populations and understand their significance to AGN as a whole.
In this paper we present the 0.7 deg2 SWIRE/Chandra X-ray source catalog, SWIRE identifications and IR, optical and radio fluxes. IR properties of X-ray sources range from the power-law shape characteristic of AGN-dominated sources, mostly unobscured Type 1 AGN, to SEDs which are dominated by star formation or host-galaxy emission, implying obscuration of the AGN at these wavelengths (Franceschini et al. 2005, Barmby et al. 2006, Polletta et al. 2007, Feruglio et al. 2008, Cardamone et al. 2008, Gorjian et al. 2008). X-ray hardness is loosely related to the optical/IR colors, generally supporting this view. We characterize the X-ray and multi-wavelength properties of the SWIRE/Chandra sample and take an initial look at these properties as a function of X-ray hardness and radio-loudness. Detailed study and modeling of the spectral energy distributions (SEDs) will be presented in a companion paper (Polletta et al. in prep.).
2 X-ray Data and Analysis
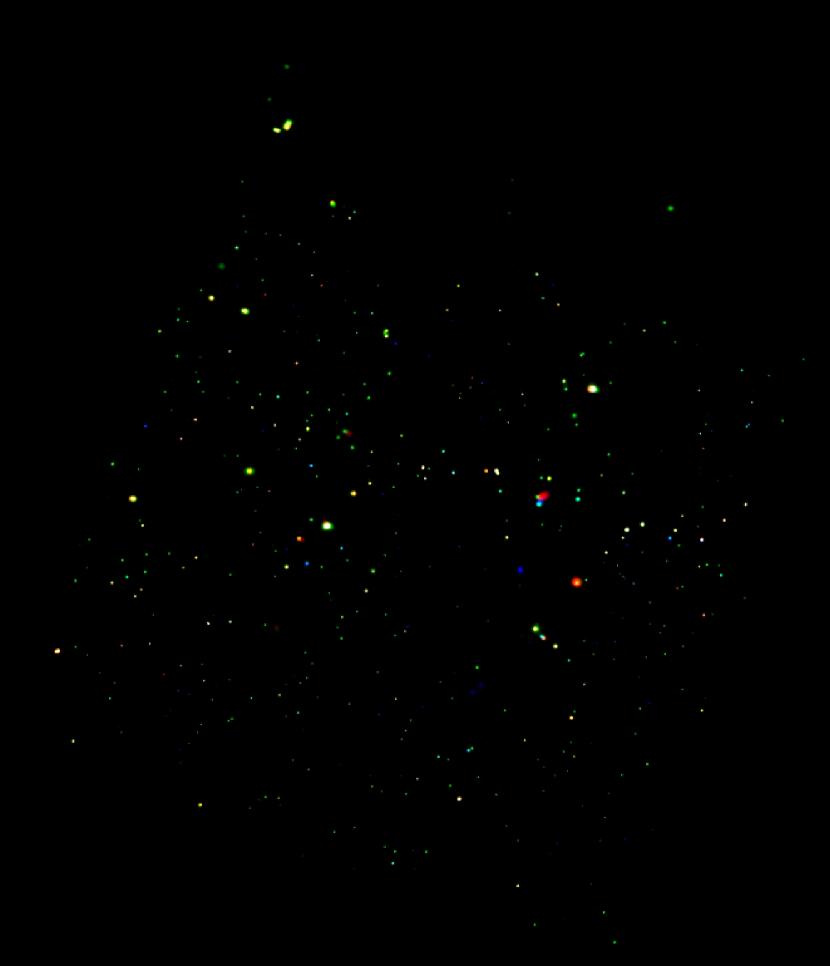
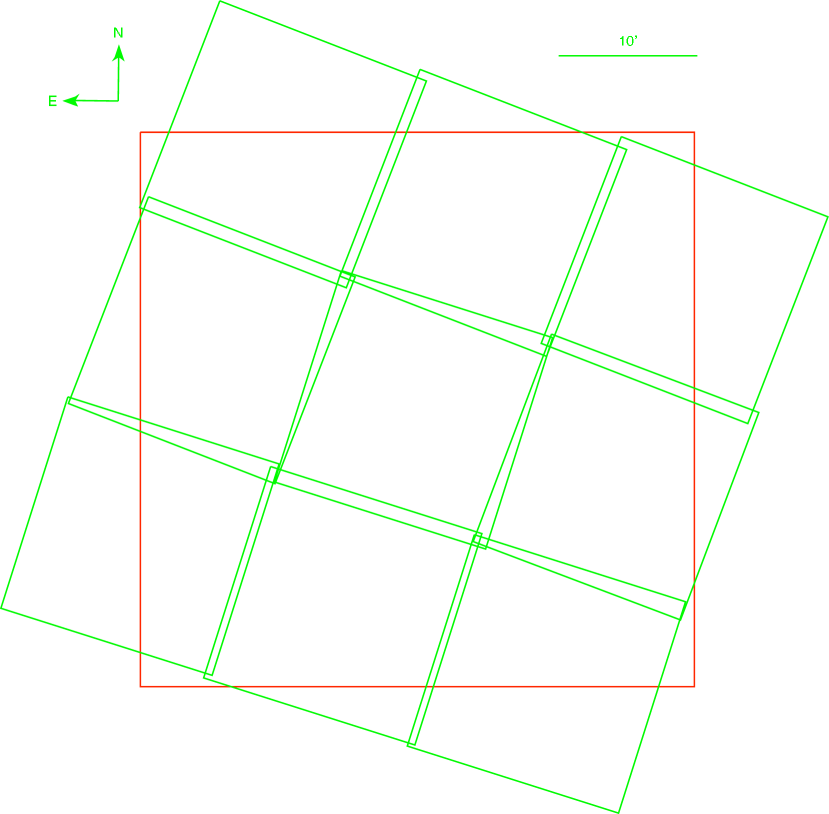
We have obtained Chandra ACIS-I observations in a 3 3 raster of a contiguous 0.7 deg2 area of sky within the Lockman Hole region of the SWIRE survey, see image in Figure 1 (left) color-coded for X-ray energy. In addition to the standard 4 ACIS-I chips, we also include the ACIS-S2 chip in our analysis. The exposure time for each observation was 70 ksecs, reaching broad band fluxes of erg cm-2 s-1 (for counts, on-axis). The nine observations, listed in Table 1 along with the Galactic values from Stark et al. (1992), were obtained between 12 and 26 September 2004. They were arranged in a 33 raster spaced by 15′ in order to ensure overlap of the individual pointings. The observations were made within a 15-day period with roll angles (Table 1) from 17.6021.20o, a sufficiently small range that the fields overlapped and coverage was contiguous (Figure 1, right).
The data were processed using the XPIPE pipeline developed for analysis of Chandra data for the ChaMP using CIAO v3.1 (Kim et al. 2004, hereafter DK04). XPIPE screens bad data, corrects instrumental effects remaining after the standard pipeline processing, detects the X-ray sources (using wavdetect in the broad band 0.38 keV) and determines source properties including counts, fluxes, hardness ratios and colors using the soft (0.32.5keV), hard (2.58.0keV) and broad (0.38.0keV) bands as well as the commonly used soft (0.52.0keV) and hard (28keV) (Table 2). A threshold of 10-6 in wavdetect was used to accept a source, corresponding to spurious source per ACIS-I chip, or 4 per field. To avoid finding spurious sources located at the edge of the CCD chips, a minimum of 10% of the on-axis exposure was required for source detection. Exposure maps of the SWIRE/Chandra fields were generated for each CCD at an energy of 1.5 keV with an appropriate aspect histogram222See http://cxc.harvard.edu/ciao/threads/expmap_acis_single.. The maximum value of the exposure maps is cm2 counts/photon in each CCD. Since the area with exposure map values % of the maximum in each CCD is % of the geometrical area of each CCD, % of the total number of detected sources met this criterion, assuming the sources are randomly distributed across the CCD.
A total of 897 sources were detected in this initial analysis. From this list, 80 sources were multiply-detected “duplicate” sources found in the regions of overlap between observations. In these cases, we excluded detections with lower source significance from the catalog; given that the sources are likely not variable on the timescale between observations, the lower significance is either due to larger off-axis angle, lower net counts due to telescope dither when close to a chip edge or a combination of the two effects. An additional 42 sources were deemed to be spurious based on visual inspection of the X-ray, optical and IR images, consistent with the wavdetect threshold of 4 spurious sources per field. The final list (Table 3) thus contains 775 unique X-ray sources, 763 of which are found in the contiguous field with the remaining 12 detected on the S2 chips in the 3 most northerly pointings. The X-ray sources, including positions, counts, fluxes and hardness ratios are listed in Tables 3,4.333We present a page of each table here and the full tables in the online version of the journal and on our website (http://swire.ipac.caltech.edu/swire/swire.html). SWIRE/Chandra database access with a search capability is available at http://cosmosdb.iasf-milano.inaf.it/CHANDRA-SWIRE/index.jsp. Hardness ratios (defined as (H-S)/(H+S), where H and S are the counts in the hard (2.5-8.0 keV) and soft (0.3-2.5 keV) bands respectively) were determined with a Bayesian approach using the BEHR program444See http://hea-www.harvard.edu/AstroStat/BEHR (Park et al. 2006). This method is designed for low count sources where a Poisson distribution is appropriate and uses as input the hard and soft source and background counts. It was applied as described in Kim et al. (2007a) to estimate the hardness ratio and its error for all sources detected in the broad band. To estimate the flux of the X-ray point sources, we first calculated the energy conversion factor (ECF), which converts count rate to flux, assuming a single power law model for the X-ray source spectrum with photon indices of =1.2, 1.4, and 1.7 (see Section 3.2.4 of Kim et al. 2007a (hereafter MK07) for a detailed description of estimating ECF). The fluxes presented in Table 4 assume . For soft/hard-band fluxes where the net counts were negative, no flux estimation is provided. The logN-logS relation (Section 4) was derived adopting the ECFs for photon indices of =1.4 and 1.7.
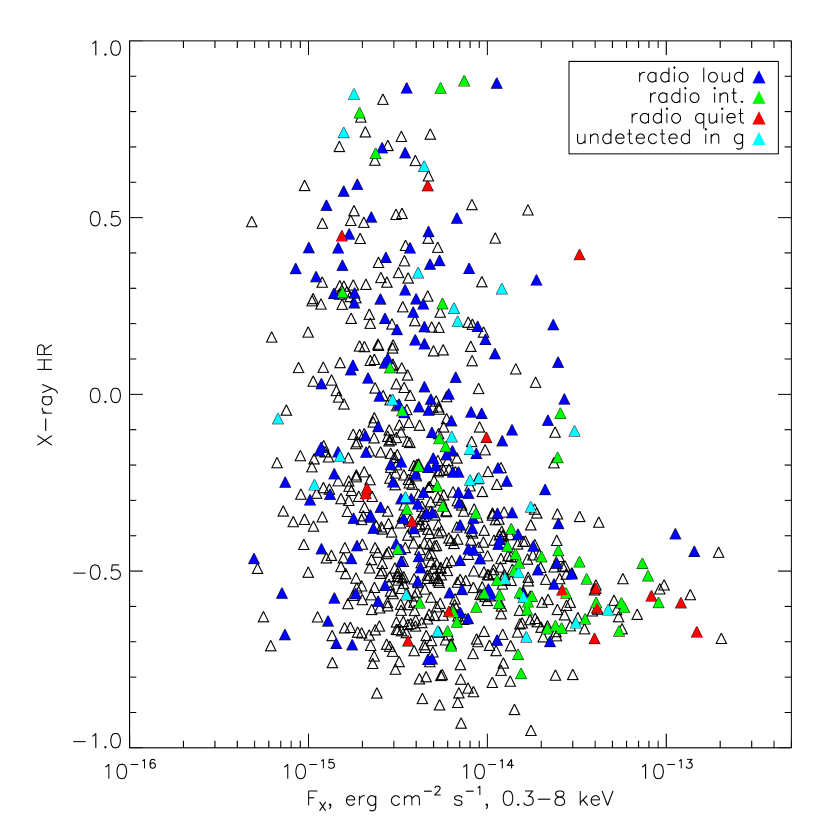
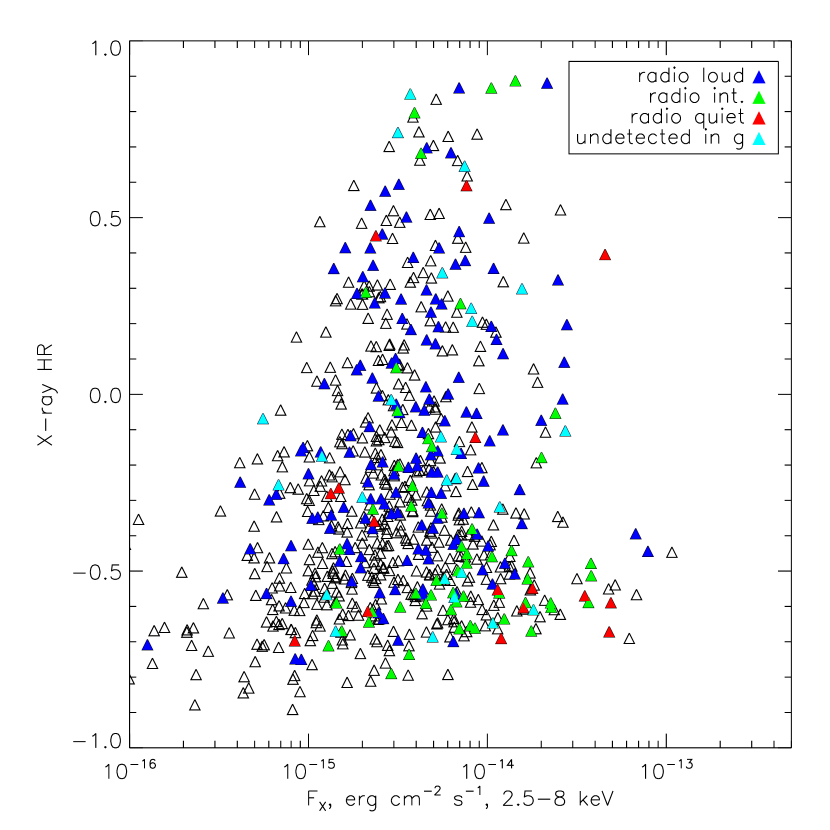
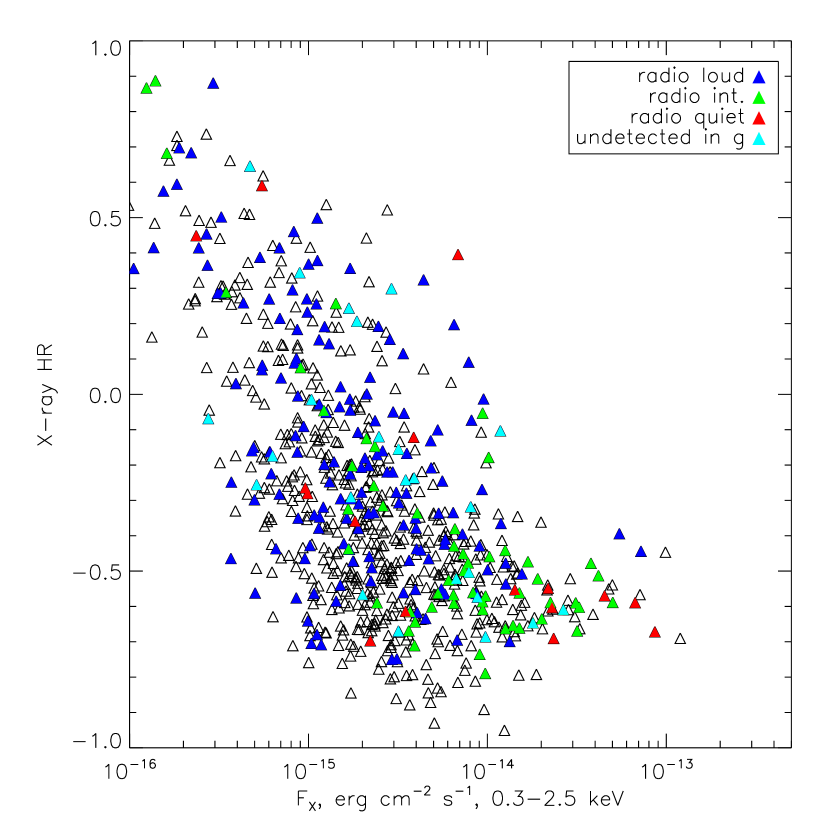
The X-ray flux limit of the sample is F(0.3-8keV) erg cm-2 s-1(5 counts, on-axis). The brightest source is at 3 erg cm-2 s-1. This survey covers the flux range in between the deepest Chandra surveys and the wide-area, shallow surveys. Figure 2 shows the X-ray hardness ratio as a function of flux in the broad band. The usual trend for hard sources to have fainter fluxes is visible. Figure 3 repeats Figure 2 as a function of the hard (left) and soft (right) band fluxes. The trend is stronger in the soft band and largely absent in the hard band, consistent with the general interpretation of the hardness being due to obscuration (DK04, MK07). Radio-loud, -intermediate, and -quiet sources are also labelled, based on the original RL classification scheme (see Section 5.5 for more discussion). Radio-loudness does not show any particular trend in these figures.
During the final stages of preparation of this paper, an X-ray source list derived from these Chandra data was published (CLANS, Trouille et al. 2008). This source list includes 761 X-ray sources, similar to our 775, but a detailed comparison yields significant differences. The CLANS list was derived using a wavdetect threshold of . We find 94 CLANS sources with no match in our X-ray source list. Ten of these were in our preliminary list but were deleted as spurious following visual inspection. There are 113 sources in our X-ray list which have no CLANS match, including 33 sources with 162.2o, a sky region not included in their analysis. With the exception of these 33, the sources which appear in only one list are at low flux levels. There are 662 sources in common, 5 of which are counted as double in the CLANS list but confirmed by visual inspection to be single in ours. The derived X-ray fluxes in the two samples generally agree well, except at low count rates in the hard band.
2.1 X-ray Spectral Analysis
Fifteen of the X-ray sources have 300 net counts, facilitating spectral analysis. Spectra and associated response functions were extracted and the spectra were grouped with a minimum of 15 counts per bin. Fits were performed utilizing the CIAO (v3.4) tool Sherpa with the Levenberg-Marquardt optimization method and statistics with variance computed from the (chi-dvar). 90% errors were computed using the projection method in Sherpa.
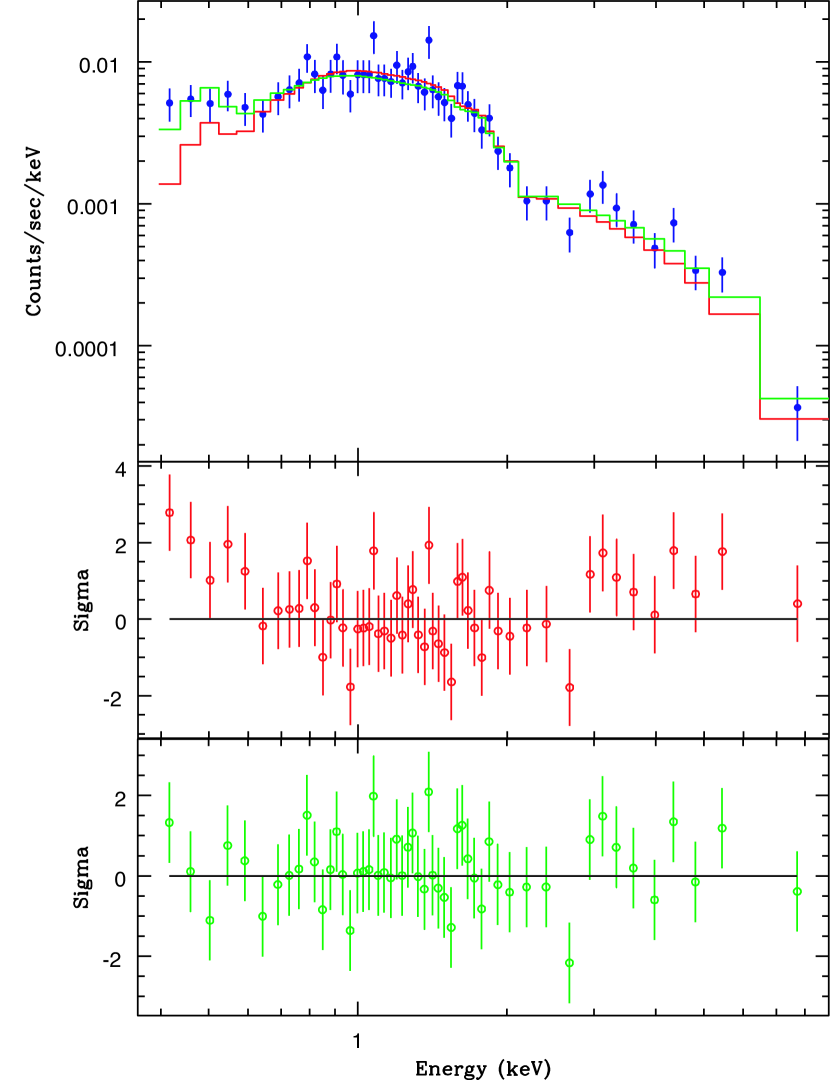
We first fit all the spectra with a power law model (F, where is the energy index and photon index, ) and cold absorption at redshift zero (). The minimum allowed was set to 5.9, below the lowest Galactic value (Table 1, Stark et al. 1992). The results are shown in Table 5. Eleven sources are acceptably fit with this model alone. The average power-law slope, = 1.890.36, is consistent with the results for luminous sources in the Chandra Deep Field South (CDFS, Tozzi et al. 2006). For 5 of these 11 sources, hit the minimum allowed value, suggesting a soft excess in the spectrum that was not accounted for in the model. To examine the soft excess in more detail, we performed fits with an absorption component frozen to the Galactic value and added a soft excess component, modelled with a power-law, to the spectrum. Since the single power-law models provided statistically acceptable fits, we cannot substantially improve upon them with the additional soft component. In 4 cases the additional soft component provides a visually more acceptable fit in the low energy range. For the fifth, CXOSW J104540.1+584254, while the single power-law fit is statistically acceptable ( = 59.50 for 50 degrees of freedom), the addition of a soft component does improve the fit. The simplest possible model is the addition of a second power-law component, which results in slopes of = 5.00, = 1.89, with = 46.63 for 48 degrees of freedom (see Figure 4).
Of the remaining 4 sources, only one: CXOSW J104803.4+585547, has a statistically acceptable fit to a Mewe-Kaastra-Liedahl thermal plasma model (MEKAL) with temperature kT = 3.15 kV. It is likely that poor counting statistics prevent us from obtaining good model fits for the remaining 3 sources.
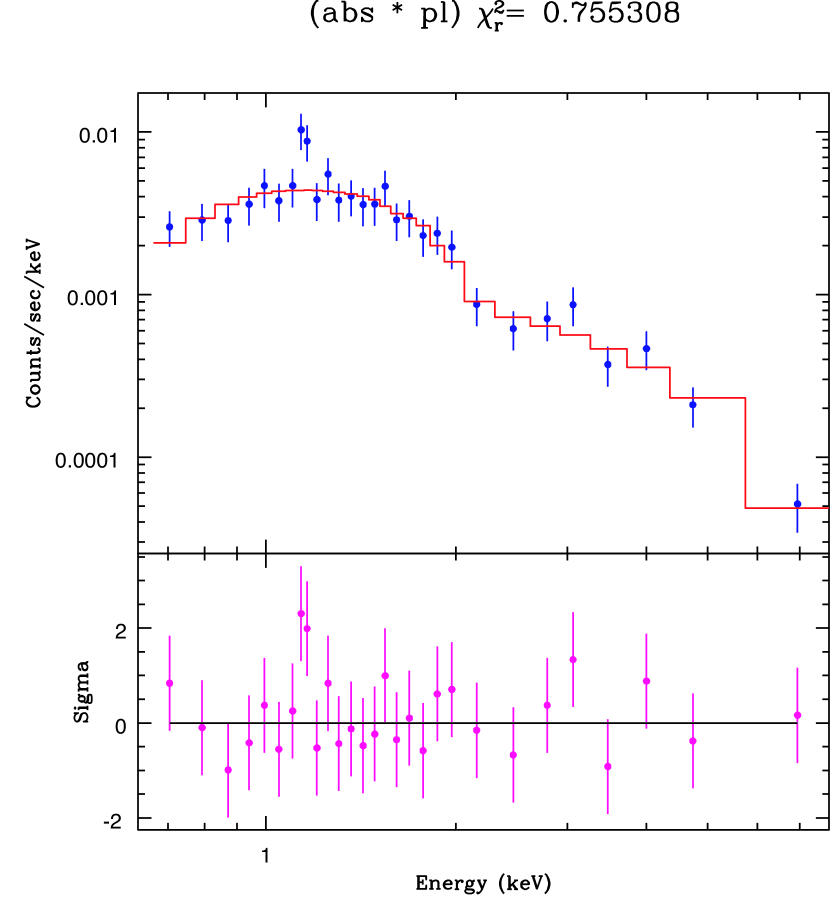
2.2 Emission Line Feature in CXOSW J104404.0+590241
Source CXOSW J104404.0+590241 shows evidence for a spectral line at 1.14 keV (see Figure 5). It is not required for the fit, but is preferred at around the 1.5 level based on an F-test, having an (unconstrained) equivalent width eV. In general a single line is interpreted as the Fe K line at 6.4 keV (rest-frame), the strongest emission line present in AGN X-ray spectra. However, in this case the source would be at z = 4.6 and the X-ray luminosity would be very high at 4.9.
Trouille et al. (2008) give z=0.5 for this source (their #136) and assign a BLAGN type based on a strong Balmer series in the optical spectrum (Trouille, private communication). The closest possible identification for the X-ray line at this redshift is the Silicon K fluoresence line, rest energy 1.74keV, yielding z = 0.52. This line has been observed in AGN, though not generally in isolation. For example, photoionized material in the Broad-line Radio Galaxy, 3C445, provides several emission lines, including Si K with an equivalent width 73 eV (Sambruna et al. 2007). At the redshift of this source, the other expected lines are redshifted to energies below the observed band in this source, apart from Fe K, 4.2 keV. However the signal-to-noise in the higher-energy X-ray spectrum is too low to confirm or exclude the presence of a Fe K line (Figure 5). We conclude that the emission line is Si K at z.
3 Multi-wavelength X-ray Source Identification
The extensive multi-wavelength data for the SWIRE/Chandra field are described in Polletta et al. (2006) and will be presented in detail, along with classification of the sources and SED fitting, in a companion paper (Polletta et al., in prep.). For completeness they are briefly summarized here. The Spitzer data include imaging in the 4 IRAC bands to 5 depths of 4.2, 7.5, 46 and 47 Jy at 3.6, 4.5, 5.8, 8.0 m respectively. MIPS imaging at 24 m reaches depths of 209 Jy (, Shupe et al. 2008). The details of the IRAC and MIPS data processing are given in Surace (2005). Here we will refer to the optical and infrared imaging data in order to characterize the sample in comparison with other X-ray surveys. Optical imaging in U, , , , to 5 limiting Vega magnitudes of 24.8, 25.9, 25.2 and 24.4 respectively, was obtained with the MOSAIC Camera on the KPNO 4-m Mayall telescope for the field center and with magnitudes brighter limits towards the field edge (Polletta et al. 2006).
The X-ray source list was cross-correlated with the optical and Spitzer source lists in search of matches. The SWIRE catalog contains all sources detected in at least one IR band in the Lockman Hole field. The cross-match procedure searches for sources within a circular radius corresponding to the geometric sum of 2 ″and the X-ray positional error or 2 ″, whichever was greater, to ensure no potential matches were missed. We find an IR counterpart for 749 X-ray sources and 333 have 24 m identifications. Visual inspection of the images was carried out for 68 sources with multiple associations. The closest source is preferred when it was more than times closer than any other. For counterparts at similar distances from the X-ray source, the brightest in the IR is generally preferred. In some cases the source SED is taken into account, preferentially selecting the counterpart with an AGN-like SED. This inspection led to the selection of preferred counterparts in 63 cases while in the remaining 5 cases the identification remains ambiguous. Further inspection of the 26 sources with no IR counterpart revealed the presence of an IR source below the formal detection threshold in 8 cases. In 10 cases a visible counterpart is not listed in the catalogs due to the presence of a nearby bright star. Of the remaining 8 X-ray sources, 4 only have optical identifications and 4 are genuine X-ray only sources for which the optical and IR emission is fainter than the SWIRE sensitivity limits. Thus we have identified an optical/IR counterpart for 771 X-ray sources, or 99% of the sample. Given the uncertain IDs, contaminating sources and very faint flux levels of some of the identifications, we have accurate optical and/or IR flux measurements for 744 X-ray sources, corresponding to 96% of the entire X-ray sample (Table 7). Those sources with no optical/IR counterpart, those with ambiguous IDs and those with contaminating sources which prevent count extraction are labelled in Table 7 (electronic version).
A deep 1.4 GHz radio map covering the central 40 of the SWIRE/Chandra field was obtained at the VLA (Very Large Array). Owen & Morrison (2008) present a 5 catalog for which the flux limit in the center of the radio field is 15 Jy and a factor of brighter by 20′ off-axis (Owen & Morrison 2008). Shallower data are available for the full Chandra field-of-view. In this paper we use a radio source list extending down to a deeper, 4, flux limit, reliable given the additional requirement of identification with an X-ray source. This yields a radio flux limit (4) of 11 Jy at the field center. The radio source list was cross-correlated with the X-ray source list to determine candidate radio identifications. Candidate matches were determined based upon the positional errors in both radio (which take into account extent) and X-ray and then confirmed by visual inspection. The low density of radio and X-ray sources results in no ambiguous matches. Radio sources were identified with 251 X-ray sources in the overlapping field of view (Figure 1, right). We take a first look at the classification of the radio-detected sources in this paper. A detailed analysis of the radio properties will be presented in a future paper.
3.1 Extended X-ray Sources
We searched for extended X-ray sources using vtpdetect. Two candidates were found: CXOSW J104740.7+590704 and CXOSW J104653.1+592648. Modelling of their point spread function (PSF) at 1 keV confirmed their extent at 95% significance.
CXOSW J104740.7+590704 appears to be associated with a group of galaxies in the optical and IR images. The central galaxy is at a redshift of z=0.354. The X-ray emission is soft (HR = -0.22) and can be fit with a simple power-law of slope = 2.25. The extent of the X-ray emission is almost an arcminute in radius, though the association of galaxies is smaller. The 0.3-8 keV flux is which, at the redshift of the central galaxy, corresponds to a luminosity of . Though the X-ray emission does not appear to contain any discrete sources, it remains possible that one or more AGN contribute.
CXOSW J104653.1+592648 is associated with two galaxies in the IR which cannot be visually separated in the optical. The diffuse X-ray emission is concentrated in a much smaller area than the previous source: (30″ in radius) which, given the source’s large off-axis angle (7.3′), suggests that the diffuse emission is likely associated with these two galaxies only. The X-ray emission is quite soft (HR = -0.43) and the spectrum is well-fit by a soft power-law with absorption and photon index, = 3.0. The unabsorbed X-ray flux is . A spectroscopic redshift has not been measured for either IR-identified galaxy so the luminosity cannot be determined. No discrete sources are detected in the X-ray emission which is centered on the gap between the galaxies, so, though still possible, it is unlikely to be dominated by an AGN
4 The Log N vs. Log S Relation
To determine an accurate logN-logS relation, it is necessary to correct for the incompleteness of the sample as well as for instrumental effects such as vignetting and the off-axis degradation of the PSF. The actual source detection probability in a field is a complex function of off-axis angle and source counts: the detection probability decreases as off-axis angle increases and as source counts decrease (e.g. MK07). Therefore, to accurately determine the sky coverage of the SWIRE/Chandra sample, we performed a series of Monte Carlo simulations to correct incompleteness and biases within the sample fields. The technique for the Monte-Carlo simulations is based on previous studies (e.g. Kim and Fabbiano 2003; MK07; Kim et al. 2007b) and consists of three steps: (1) generating artificial X-ray sources with MARX555See http://space.mit.edu/CXC/MARX/ and MARX 4.0 Technical Manual., (2) adding them to the original observed image without subtracting any real, observed X-ray sources, and (3) detecting these artificial sources with and extracting source properties. In step (2), we used the real Chandra observations to accurately reflect the effects of background counts and source confusion/crowding in the SWIRE fields.
We performed simulations using all 4 CCDs in all 9 observations (see §2), generating artificial X-ray sources in each of our 9 sample fields extending to a flux level 10% of the survey detection limit. This corresponds to artificial X-ray sources per . The number of artificial sources detected in each field depends on the effective exposure time of the observation and the neutral hydrogen column density, , toward the observed region of the sky.
The observed X-ray differential logN-logS is described by a broken/double power law with a faint slope of and a bright slope of (Yang et al. 2004, Basilakos et al. 2005, Chiappetti et al. 2005) in most energy bands; however, the break flux has not been well determined. In our simulations, we assumed a cumulative logN-logS distribution with a single power law of slope of , corresponding to a slope of in the differential logN-logS. This is the average of the faint and bright slopes from the literature, in the 0.3-8 keV band. Since we use the fraction of artifical sources detected as a function of flux to determine the sensitivity (Vikhlinin et al. 1995, Kim & Fabbiano 2003), the exact form of the assumed logN-logS distribution is not critical. From the assumed logN-logS distribution, we selected artificial source fluxes and placed them in the actual event files at random positions, taking care not to over-crowd each CCD chip (see below). Applying the same detection software to these events files as we did to the original observations, we found that on average of the artificial X-ray sources are detected in our simulations. The flux range of the detected, artificial sources: to erg cm-2 s-1 in the broad band (Table 2); covers the flux range of the observed SWIRE/Chandra X-ray point sources ( to erg cm-2 s-1). The result was a total of artificial X-ray sources in the 9 SWIRE/Chandra fields. At 2.8 times the 775 observed sources, this is statistically sufficient to derive the sky coverage as a function of flux and to correct the effects of incompleteness and bias on the logN-logS relations derived for the SWIRE/Chandra sample.
The spectrum of the artificial sources was assumed to be a power law. Observed photon indices in this flux range generally span (KD04, MK07). In addition, Tozzi et al. (2006) performed X-ray spectral analysis for 82 X-ray bright sources in the CDFS, and found a weighted mean value for the slope of the power law spectrum, , and no significant correlation between the photon index, , and the intrinsic absorption column density . The flux range of these bright sources in the CDFS overlaps the faint flux end of the SWIRE/Chandra sources. We therefore assumed that the SWIRE/Chandra sources have a photon index, . We assumed a Galactic absorption, (Stark et al. 1992), for each observation; we did not include intrinsic absorption for the artificial source spectra. The spectrum of each X-ray point source was generated using the XSPEC666See http://xspec.gsfc.nasa.gov/. package.
The artificial source’s position was randomly selected in each CCD chip area, but was rejected if the source area at a selected position had an exposure map value of less than of the maximum. This requirement is identical to that in the SWIRE/Chandra X-ray point source catalog reduction procedure. To avoid over-crowding of the artificial sources, the artificial sources per CCD were divided into several groups to be added into the observed image: while we did not allow the artificial X-ray point sources to overlap one another, we allowed overlap between artificial and real X-ray sources to provide an estimate of source confusion in each observed field. This resulted in simulated images per ACIS-I CCD, corresponding CCD images (event files) on which we ran (). Since of the artificial sources () are detected, on average we added detectable, artificial sources to each simulated image. The net counts of those artificial sources which overlap/blend with real sources were corrected following the methods described in §3.2.2 of MK07.
Using the simulation results, we derived the sky coverage as a function of flux in 6 energy bands (Table 2). The sky coverage area is the fraction of artificial sources detected at a given flux, multiplied by the total sky area, and it is used to correct the incompleteness and bias in the derived logN-logS relations. The full sky area of the SWIRE/Chandra is . The geometrical area of a CCD chip is ; however, the net effective area is slightly larger due to the dither. To accurately calculate the effective area, we follow the same method as : all pixels in the exposure map were summed, excluding those pixels with an exposure map value less than of the maximum within the corresponding source area. This criterion automatically excludes pixel positions located near the edge of the CCD chip. We note that our sample is complete at the level at a flux of erg cm-2 s-1 in the keV when is assumed.
The cumulative logN-logS relation for sources brighter than a given flux , corrected by the corresponding sky coverage at , is:
| (1) |
where is the flux of the th X-ray point source and is the sky coverage, that is the maximum solid angle over which a source with flux is detectable. Using the SWIRE/Chandra X-ray point sources and the corresponding sky coverage, we derived the cumulative logN-logS relations for the SWIRE/Chandra X-ray point sources. Since the differential logN-logS relation is a derivative form of the cumulative logN-logS relation, we derived it from the cumulative logN-logS relation resulting from equation (1) as follows:
| (2) |
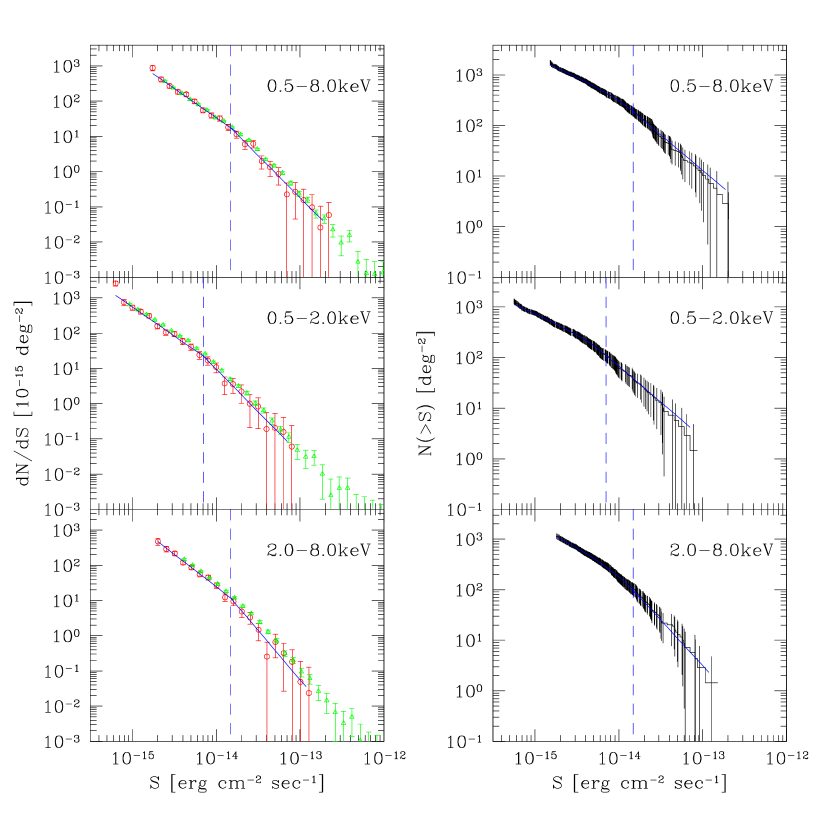
where is the cumulative source number at flux . Since the sky coverage rapidly decreases near the faint flux limit, there are large statistical errors for the logN-logS distribution at faint fluxes. Thus, for better statistics, we present the logN-logS relations brighter than the flux corresponding to of the full sky coverage. In Figure 6, we display the SWIRE/Chandra differential () and cumulative () logN-logS relations in 3 energy bands. Statistical errors on the logN-logS are assigned following Gehrels et al. (1986).
We fitted the differential logN-logS with a broken power law as follows:
| (3) |
where is a normalization constant and is a normalization flux. In this study, we set a normalization flux of erg cm-2 s-1, is the break flux at which the slope of the differential logN-logS changes, and are faint and bright power law indices. The best fit parameters for the differential logN-logS for various X-ray energy bands and photon indices of 1.4 and 1.7 are listed in Table 6 and displayed in Figure 6. The best fit parameters for the differential logN-logS of the ChaMP and ChaMP+CDFs (Kim et al. 2007b) are also listed in Table 6 for ease of comparison. The choice of photon index, , has little effect on and , but it shifts somewhat. In the different energy bands the break flux, Sb has different values, similar to the results of the ChaMP and the ChaMP+CDFs. We note that the best fit parameters and and agree, within the uncertainties, with previous studies covering comparable flux ranges, such as the ChaMP (Kim et al. 2007b). The faint end slope is somewhat steeper than that for the combined ChaMP+CDFs (Table 6) or the results of Trouille et al. (2008). This is most likely due to the inclusion of the fainter flux range from the CDFs in the latter, combined surveys.
5 Multi-wavelength Properties of the X-ray Sources
In Table 7 we present multi-wavelength fluxes for the SWIRE/Chandra X-ray sources along with the SWIRE ID number for the matched source. We include g′, r′ optical magnitudes, 3.6m and 8.0m Spitzer IRAC fluxes, 24m Spitzer MIPS fluxes and 20cm (1.4 GHz) VLA radio fluxes. The full table is available in electronic form only.
5.1 X-ray and Optical Properties
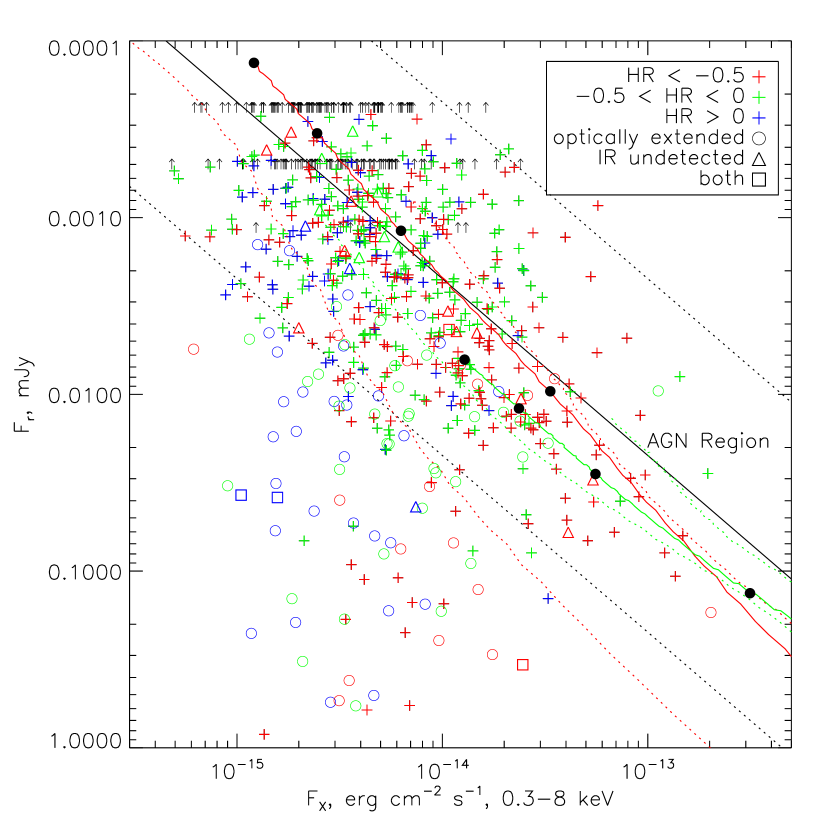
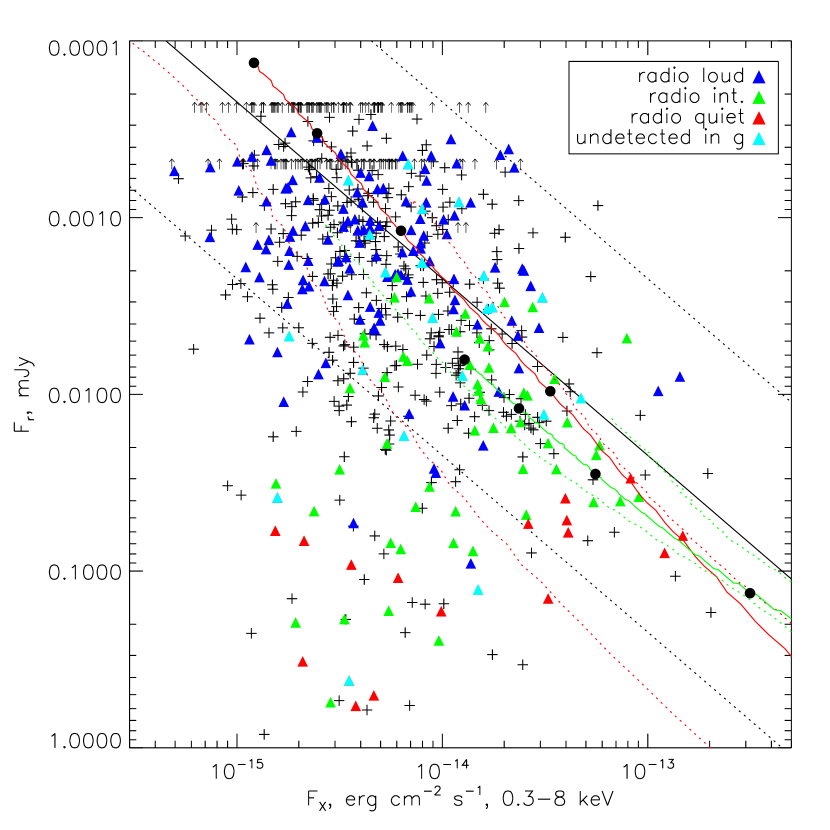
Figure 7 shows r′ magnitude vs. broad band X-ray flux for the SWIRE/Chandra X-ray sample. The fx/fr=0.110 region defined to include most extragalactic sources (most of which are AGN) in the Einstein Medium Sensitivity Survey (EMSS, Stocke et al. 1991, hereafter “the AGN region”) is shown by black dashed lines. X-ray sources identified with extended optical sources and those with no IR counterpart are labelled. Sources are colored according to their X-ray hardness ratios: hard (blue), medium (green) and soft (red). A hardness ratio, HR, implies an equivalent hydrogen absorption column density, cm-2 for a typical AGN power law spectrum.
Figure 7 also includes tracks for optically-bright, Type 1 (Elvis et al. 1994, green lines) and near-IR red (Kuraszkiewicz et al. 2009a, red lines) AGN SEDs, based on these low-redshift (z 0.4) samples, as a function of redshift up to z=4 (at the lower flux end). The 90% envelopes, shown as dotted lines, include the range in shape around this median, but do not include the range in luminosity expected at a given redshift. The tracks for the AGN SEDs are computed over a redshift range from z=0.025 to z=4 in increments of z = 0.025. At each redshift interval, the luminosity distance corresponding to the redshift is computed. This distance is used to compute the observed flux for an object at that redshift in each of the bands plotted. No absorption is assumed. For the X-ray flux, we use a monochromatic flux density at 1 keV assuming a power-law spectrum with slope of . The 1 keV luminosities (log) of the two medians are 44.61 (Elvis et al. 1994) and 43.51 (Kuraszkiewicz et al. 2009a). We smoothed the Elvis et al. (1994) % envelopes slightly in the radio range to remove artifacts due to poor data sampling.
As is typical, most of the X-ray sources lie within the range expected for extragalactic sources, which are predominantly AGN (fx/fr=0.110, “AGN region”). Below this region, where fx/f, there are 102 sources, 13% of the sample. The Elvis et al. (1994) median as a function of redshift (green lines) predicts AGN in a small area at the bright end of the AGN region in Figure 7, demonstrating the particular subset of the luminous AGN population targeted in traditional blue, optical surveys. The red AGN median (Kuraszkiewicz et al. 2009a, red lines) covers a much broader part of the AGN region, extending to fainter fluxes (Figure 7) and suggesting that faint sources are predominantly red and/or high redshift. Red optical colors may be due to a combination of one or more factors including: Eddington ratio (L/LEdd), obscuration, host galaxy and scattered light contributions (Kuraszkiewicz et al. 2009b). A decrease in L/LEdd decreases the strength of the optical-UV blue bump (Witt et al. 1997) so that sources with low L/LEdd will tend to lie on the optically fainter side of the AGN region (Kuraszkiewicz et al. 2009b). Pure obscuration of optically-bright, Type 1 AGN moves them below the AGN region in Figure 7 into the range of galaxies and XBONGS. Thus X-ray hard sources in this region may be low-redshift, obscured AGN.
5.2 X-ray Hardness Ratio
The X-ray hardness ratio distribution in Figure 7 generally supports the above discussion. The tendency for hard sources to lie at fainter soft X-ray flux is generally interpreted as due to obscuration (DK04, MK07, Section 2). At higher redshift, though, the effect of obscuration at low energies is shifted out of the observed band, softening the observed spectrum so that obscured, higher redshift sources cannot be distinguished by their X-ray hardness. Thus sources which are observed as X-ray hard tend to lie at low redshift (MK07). An investigation of the relation between optical/IR SEDs and X-ray obscuration requires redshifts in order to place reasonable limits on the amount of X-ray absorption for each source and will be presented in the companion SED paper (Polletta et al. in prep.).
Sources at faint flux levels in Figure 7 are preferentially hard. Most of the soft sources lie in the AGN region. Those sources which are optically-bright and X-ray faint lie below the AGN region in Figure 7, are X-ray medium/hard and optically extended, consistent with being low-redshift galaxies or obscured, Type 1 AGN.
5.3 X-ray and mid-IR Properties
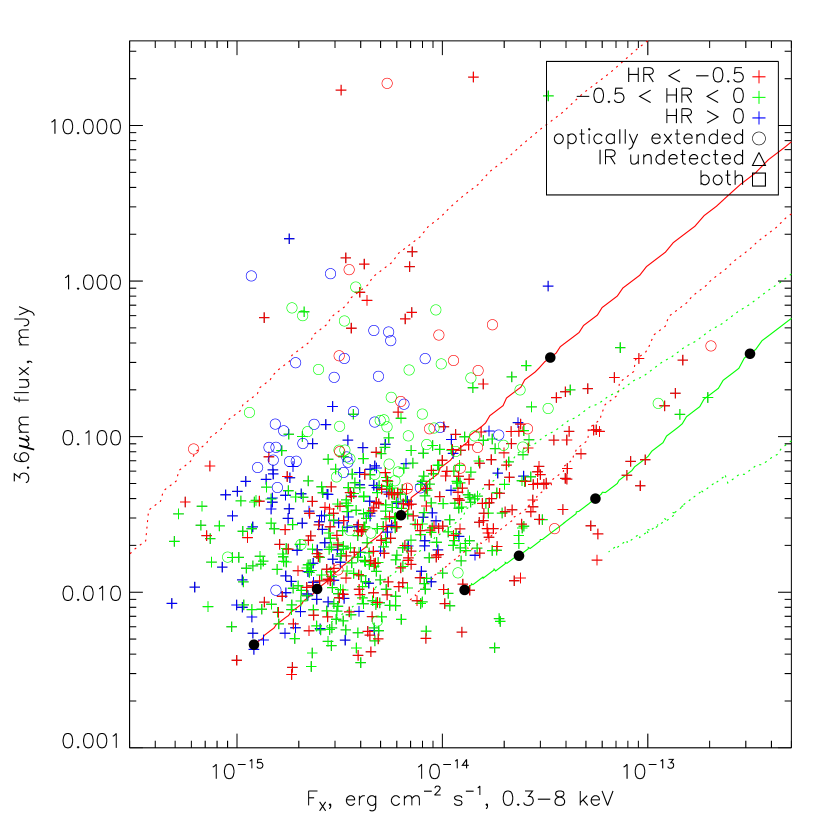
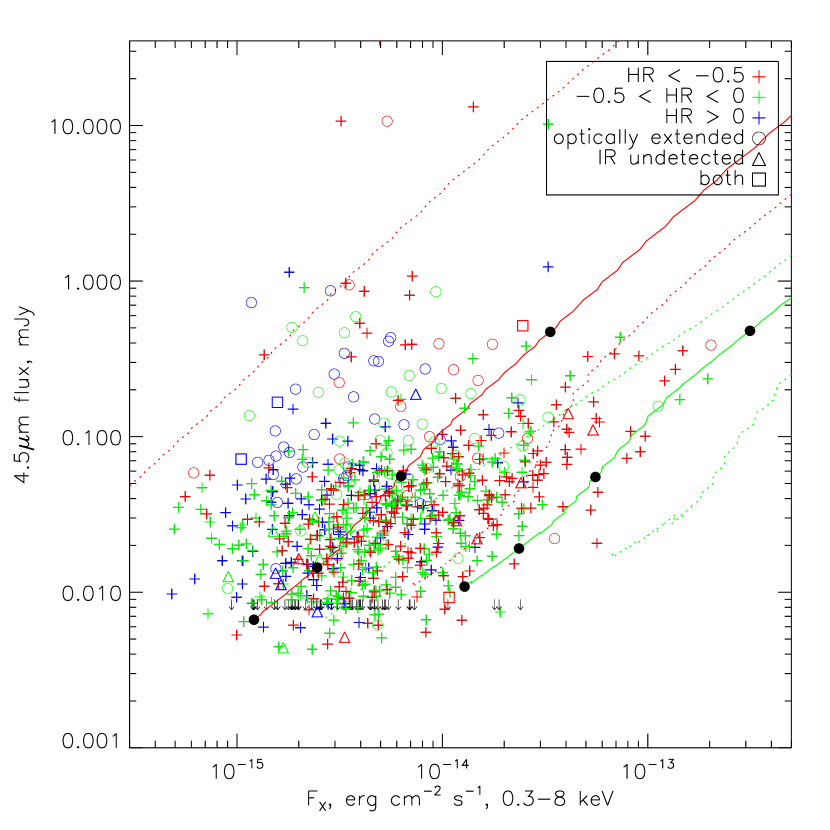
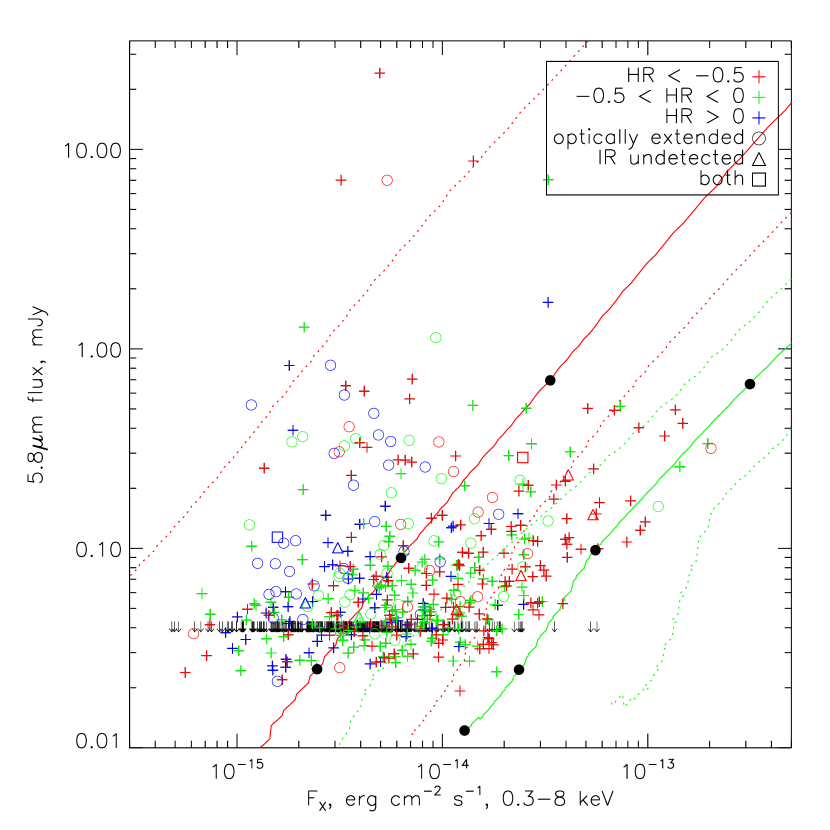
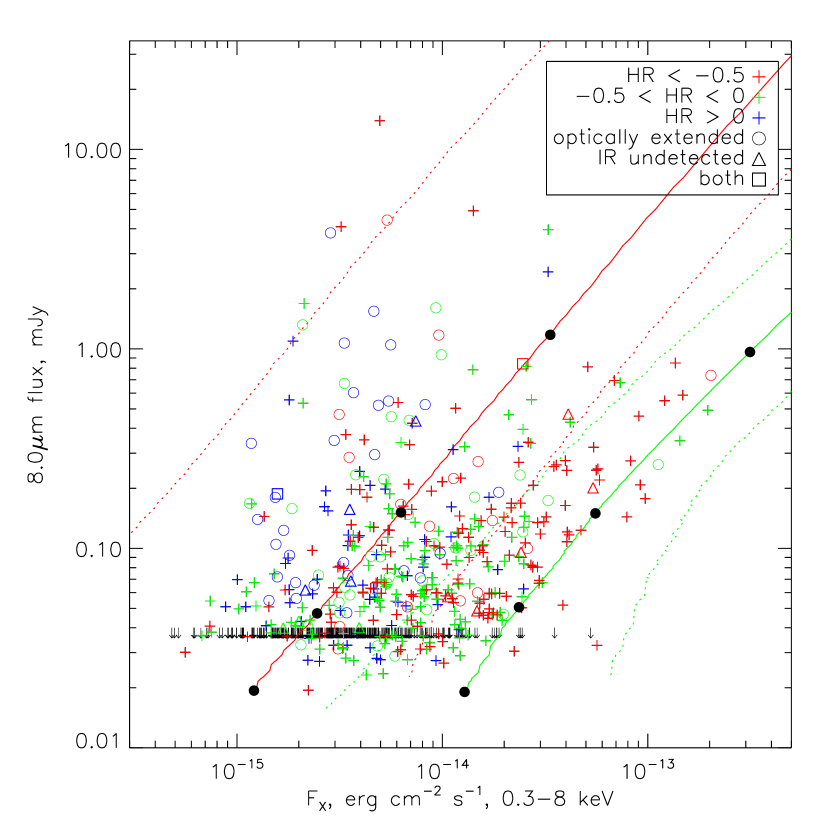
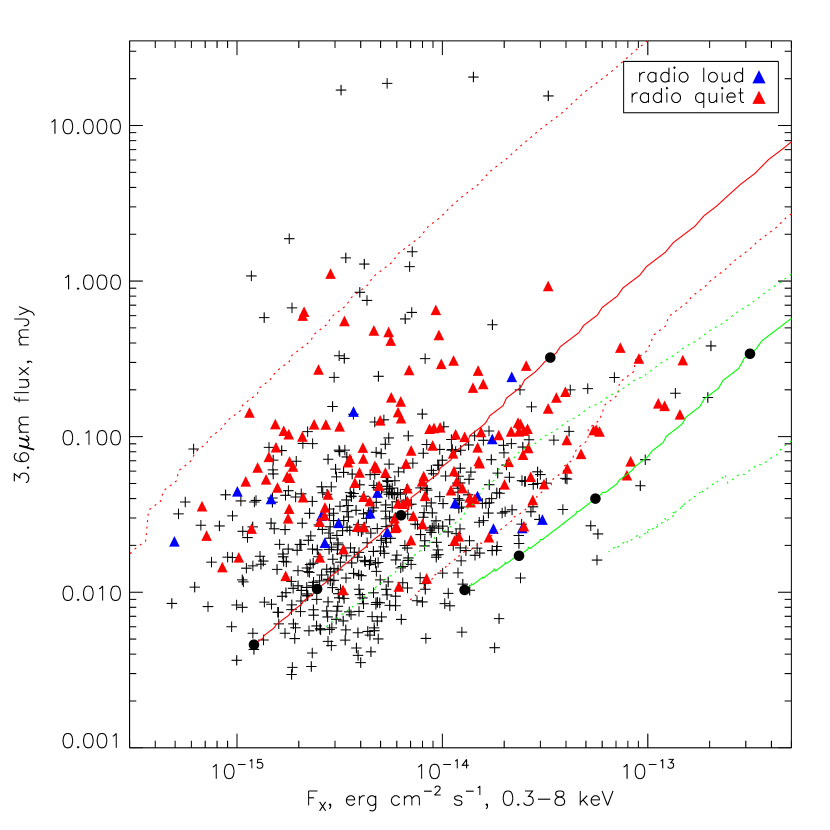
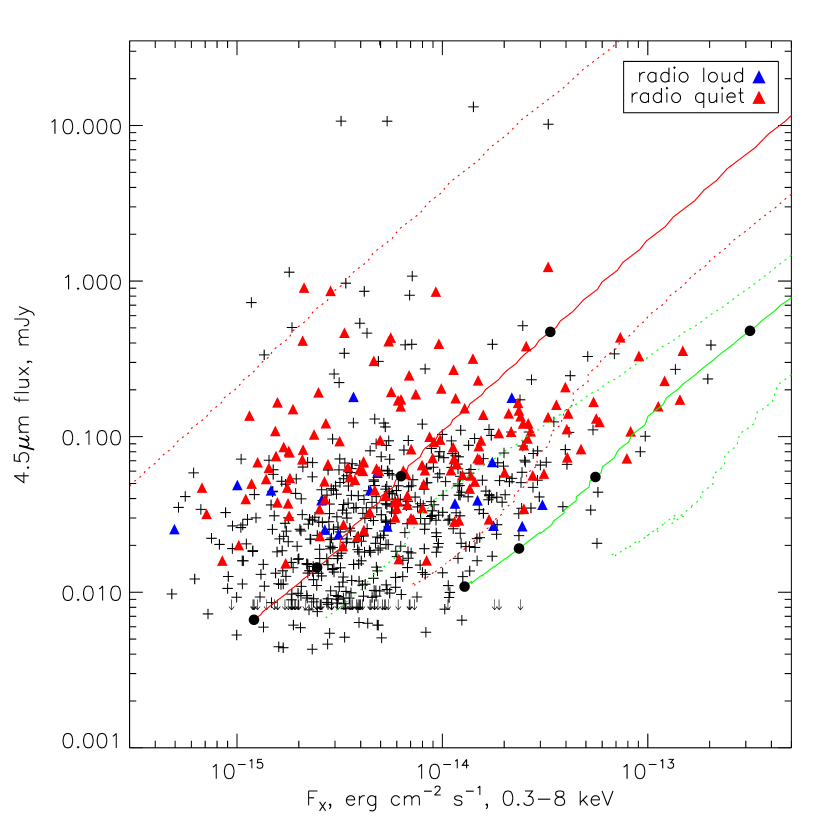
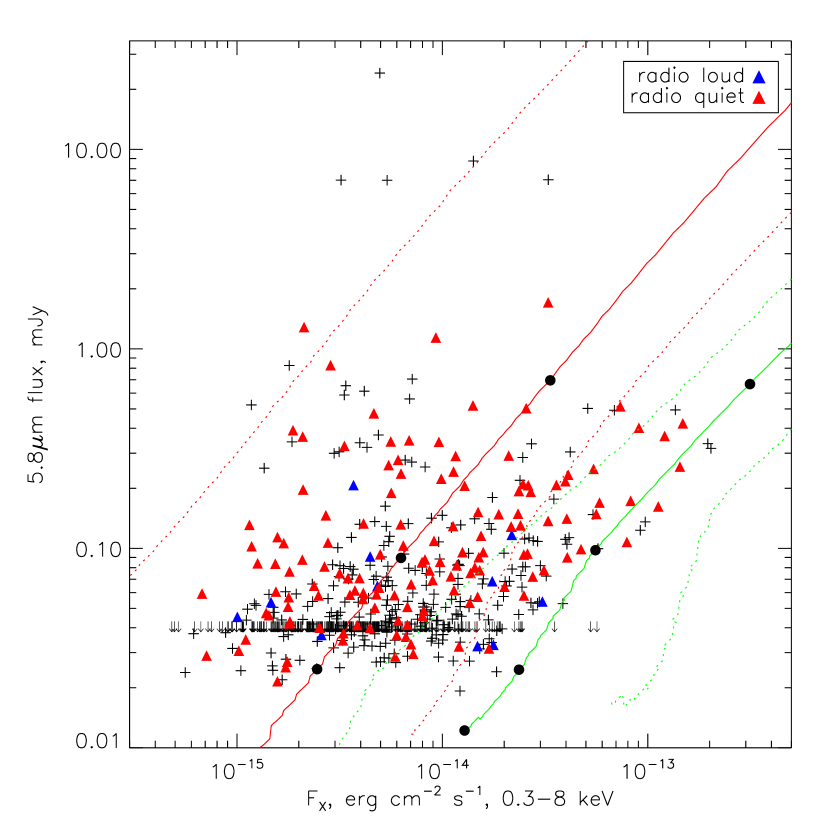
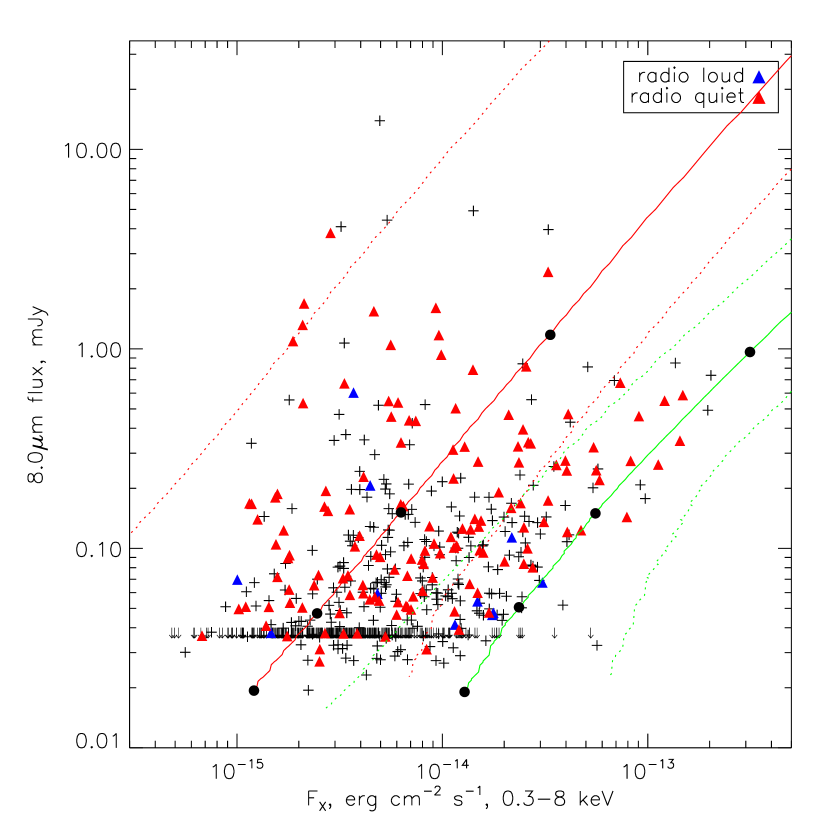
Figure 8 shows the broad band X-ray vs 3.6 m, 4.5 m, 5.8 m and 8.0 m fluxes with the tracks for median optically-selected, Type 1 (green) and red (red) AGN SEDs superposed. Optically extended X-ray sources generally lie at higher IR fluxes than the AGN in these figures, due to the lower observed X-ray flux of galaxies or low-luminosity/absorbed AGN. Stronger IR flux, due for example to larger amounts of heated dust, may also contribute.
There is good separation of the Type 1 and red AGN SED tracks in Figure 8. It is clearer than in Figure 7 that the majority of sources lie in the red AGN region, demonstrating the wider range of SED shapes and, in particular, the large population of red AGN in this hard X-ray selected sample. Many of the extended, optically bright sources which were below the AGN region in Figure 7, lie within the red AGN SED region. This provides further evidence that they are predominantly obscured AGN for which the optical colors are brightened by host galaxy and/or polarized light contributions (Kuraszkiewicz et al. 2009b, Smith et al. 2003).
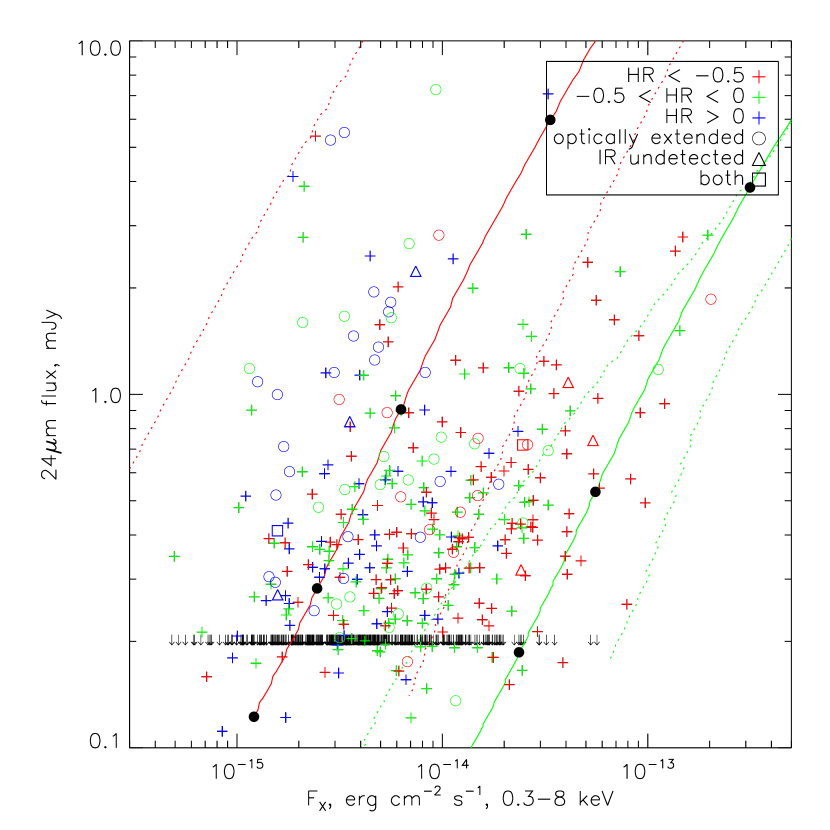
Moving to longer wavelength bands, the X-ray fainter sources are preferentially lost as the relatively higher flux limits cut down on the range of observable IR fluxes. This is most noticeable at 24m (Figure 9) where the left-hand plot shows the 24m vs the broad band X-ray flux and less than half the sample (333) are detected in the IR. The labelling is the same as for Figure 8.
5.4 X-ray Sources Extended in Optical
Of the 775 X-ray sources in the SWIRE/Chandra field, 107 were flagged as optically extended by the source extraction software (CASU pipeline Irwin & Lewis 2001). Visual inspection of the optical identifications of all the X-ray sources led to inclusion of an additional 9 optically extended sources, and exclusion of 22 sources for false positives arising from three causes: spikes from nearby saturated stars; multiple closely spaced sources detected as a single, extended source; and proximity to a different, unrelated extended source. A further 2 sources were excluded as it was determined that they are background AGN coincident with the extended region of foreground galaxies. The verified list thus consists of 92 optically extended sources.
In order to determine some of the general properties of the sample, we derive luminosities from spectroscopic redshifts where available (29 of 92 sources, Polletta et al., in preparation) and from photometric redshifts for all but 2 of the remaining sources, which were too faint to obtain accurate photometry. 12 of these 92 sources were identified as candidate non-nuclear ultraluminous X-ray sources (ULXs) based upon their positions within the host galaxies. 9 of the 12 have luminosities in excess of and are thus likely not individual X-ray binaries. A further 5 sources have luminosities below and are thus also considered ULX candidates, for a total of 8. These sources will be discussed in more detail in an upcoming paper (Kilgard et al., in preparation).
Most of the optically extended sources are at the optically bright edge or below the AGN region, where galaxies are expected to lie. Several of those within the AGN range are Sy2 galaxies. We summarize the properties of two unusual sources here.
CXOSW J104335.7+585249 has an SED which fits a Sy 1.8 template (Polletta et al. 2006) with a redshift, z. In the optical it is a bright, complex galaxy. Its X-ray flux is quite bright (F(0.3-8keV)=3.3 erg cm-2 s-1) with a hardness ratio implying moderate absorption, cm-2, lower than is usual for Type 1.82 AGN.
CXOSW J104552.4+590036 is faint and somewhat fuzzy in the optical and fits to a reddened AGN, MKN231-like SED (Polletta et al. 2006) at estimated redshift, z. Its X-ray hardness ratio, HR implies little absorption. It has two nearby sources at 3.6 and 4.5 m which may effect these flux estimates.
5.5 Radio-loudness
It is common practice to divide AGN into two classes based on the relative strength of their radio emission. However, there remain major questions concerning the reality of this dichotomy, its cause and even the observational classification of radio-loud vs radio-quiet AGN. For the former, physical properties such as larger central black hole mass (Lacy et al. 2001, Boroson 2002) and/or more rapid black hole spin in radio-loud sources have been suggested to cause either a dichotomy or a progression between one class and the other.
From an observational standpoint, radio-loudness is a useful tool to select out those sources with the strongest radio emission, either having large, extended structures or core-dominated and beamed. There are two alternative methods for defining a radio-loud source. First using the radio-loudness, RL, traditionally measured as log of the the ratio of 6 cm radio to optical flux (B magnitude, Wilkes & Elvis 1987, Kellermann et al. 1989), where values indicate a radio-loud source. Second using the absolute radio power where the number is around log L erg s-1 Hz-1 (e.g. Zamfir et al. 2008). Since we do not have good redshift estimates for the full sample, we will use the former definition here.
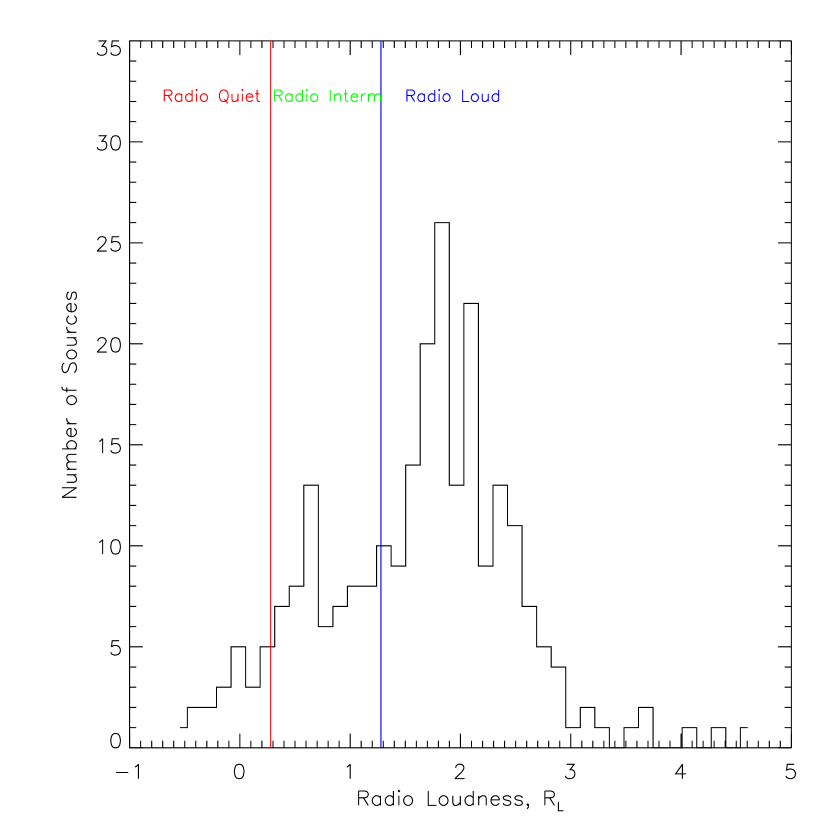
The bi-modality of the distribution of radio-loudness in AGN is more/less pronounced depending on the sample selection (Kellermann et al. 1989, White et al. 2000, Lacy et al. 2001, Komossa et al. 2006, Zamfir et al. 2008). In addition, the use of the optical magnitude is questionable given that it is strongly effected by redenning and/or orientation (White et al. 2007) which are important constituents in IR/X-ray-selected samples (Kuraszkiewicz et al. 2009a). Figure 10 shows the distribution of radio-loudness (RL= log[F20cm/g′]) for the radio-detected subset of the current X-ray selected sample. The use of g′ in place of B magnitude has a negligible effect on the parameter given the small change in effective wavelength (4770Å cf 4400Å, Fukujita et al. 1996). The use of 20cm rather than 6 cm radio flux is corrected by assuming a spectral slope of 0.5 (where f) in the radio. This shifts the standard division between radio-loud (RL) and radio-quiet (RQ) from RL=10 to RL=19. Within our radio-detected subset, 74 sources have no detection at optical g′ but all of these are classifed as radio-loud based on the optical upper limit. The presence of beaming in the radio and/or the relative strength of the big blue bump, which is likely related to the accretion properties and/or Eddington ratio, effect radio-loudness so that a simple classification scheme does not ensure physically distinct sets of sources (Falcke et al. 1996). In addition, this X-ray selected sample includes a larger number of sources whose optical flux is faint in comparison to optically-selected, Type 1 AGN. To allow for the possible mis-classification of sources around the traditional boundary, we divide the radio-quiet sources into an intermediate class (RI): 1.9R19; and radio-quiet (RQ): R 1.0, as labelled in Figure 10, again following Kellermann et al. (1989) but noting that the division point is abritrary. The RL distribution for this sample is not bi-modal so there is no obvious division between radio-loud and radio-quiet sources. The distribution appears asymmetric, has a large radio-loud fraction using this traditional classification, and has a long tail towards radio-quiet sources. Of the 251 radio-detected X-ray sources in the VLA field, 174 are radio-loud, 60 radio-intermediate and 17 radio-quiet. Conservatively assuming that the non-radio-detected X-ray sources (317) are radio-quiet,777We note that this is unlikely. The upper limits for more than half these sources allow for them to be radio-loud. Since the radio flux limit is a strong function of position in the VLA field, those towards the field edge are even more likely to be radio-loud. 41% of this sample is classified as radio-loud using the traditional definition. This is much higher than the % of radio-loud, broad-lined AGN typically found in optical surveys (e.g. Peterson 1997). Few of the radio-loud objects are strong radio sources, such as would be found in radio catalogs. There are very few in the RL range of the radio-quiet AGN in e.g. the optically selected PG AGN (Kellermann et al. 1989).
5.5.1 Radio and X-ray properties
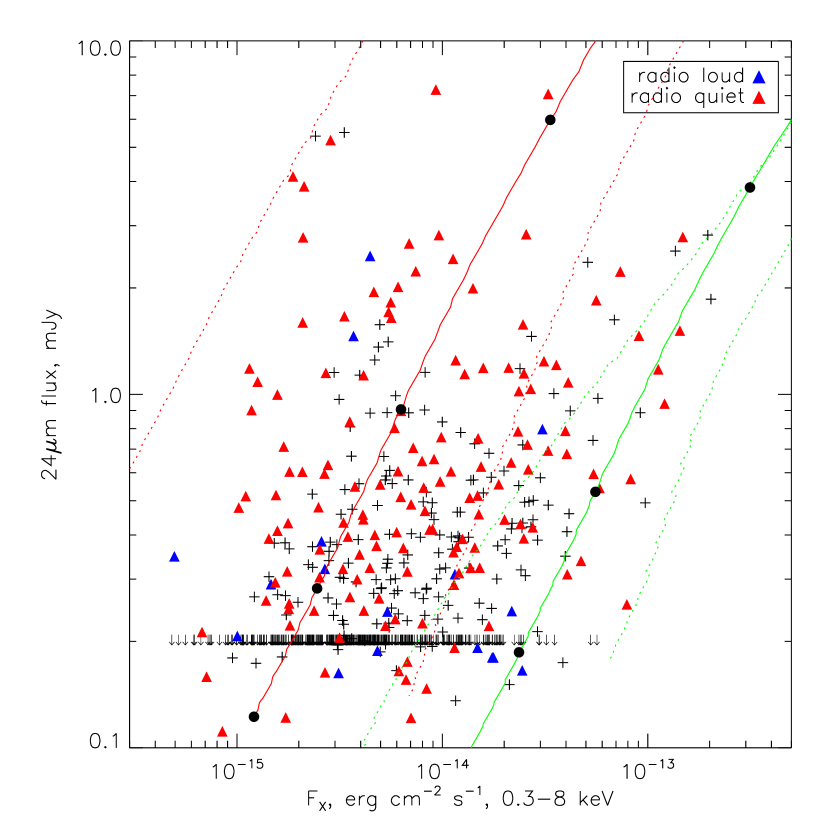
In Figure 11 (left) we repeat Figure 7 but with the radio classes indicated. The radio-loud sources lie preferentially within the AGN region, those sources with low optical and X-ray flux are almost exclusively radio-loud. This is partially due to the fact that all radio-detected sources with fluxes close to the optical and/or X-ray flux limits will be classified as radio-loud because the transition between radio-loud and radio-quiet classes falls below the faintest radio flux limit. Those which are radio-undetected cannot be classified.
However, we must also examine the meaning of radio-loud in this case. As discussed in Section 5.1, the red and green lines in Figure 11 indicate the regions in which AGN with red SEDs and those with SEDs typical of optically-selected, Type 1 AGN (respectively) lie as a function of redshift. The sources at the optical and X-ray faint end lie beyond the range of optically-selected, Type 1 AGN SEDs (green line) but within the range of the red SEDs (red line). We deduce that they are relatively optically faint (as shown in Kuraszkiewicz et al. 2009a). As noted above, if the optical emission is relatively faint while the radio is uneffected, the radio-loudness parameter, RL, breaks down as an indicator of bright radio emission. Thus an abnormally large fraction of the sample are incorrectly classified as radio-loud, as is clear in Figure 11. While RL works well for optically-selected, Type 1, blue AGN, an alternative radio-loudness indicator is needed for the remainder of the AGN population.
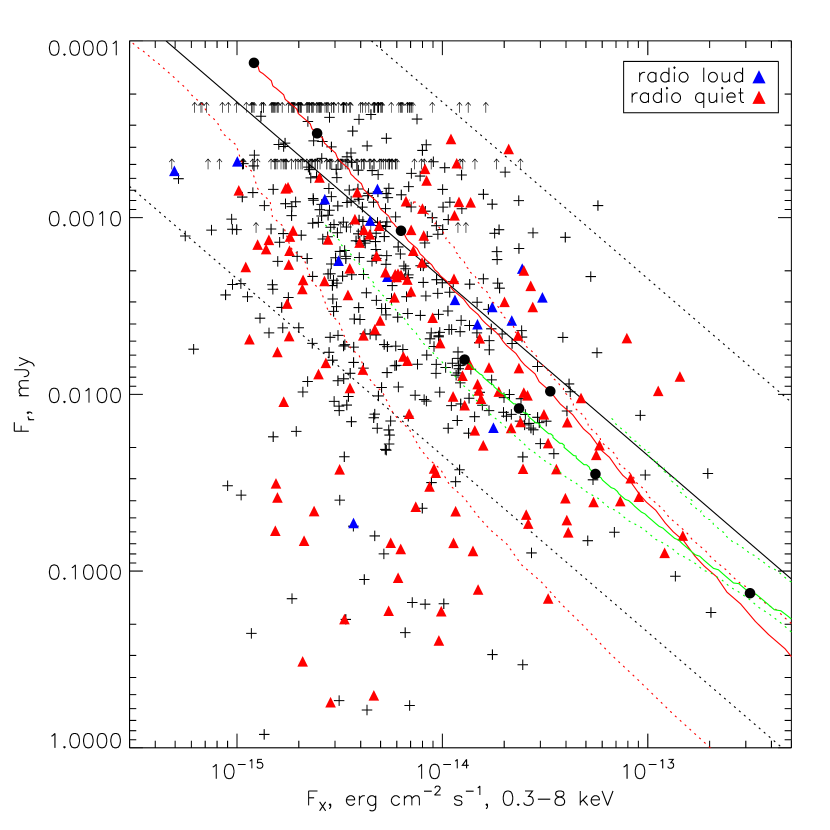
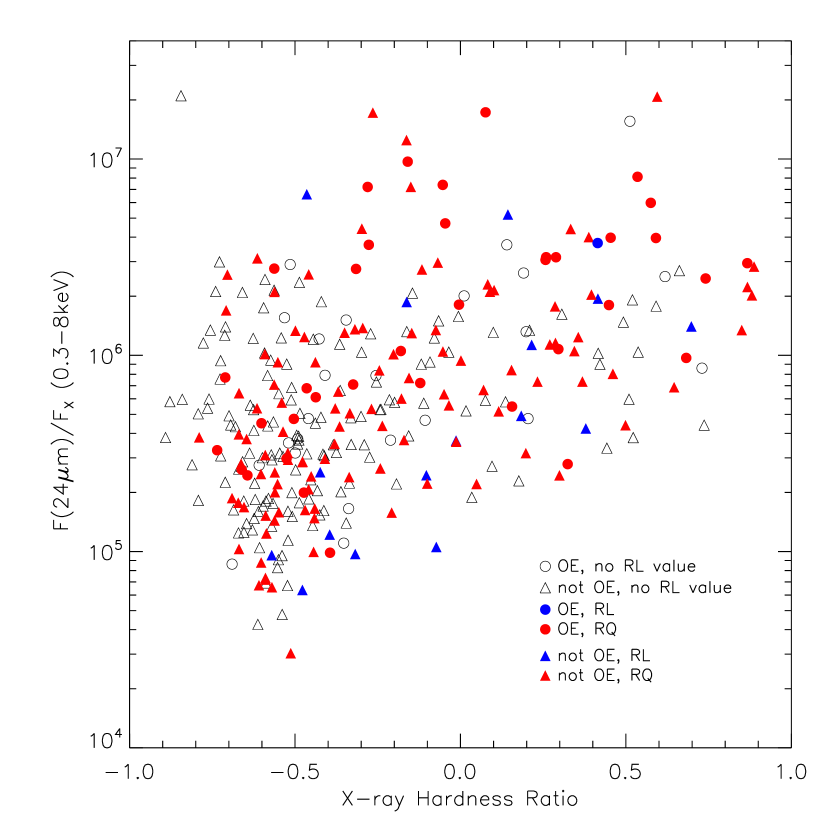
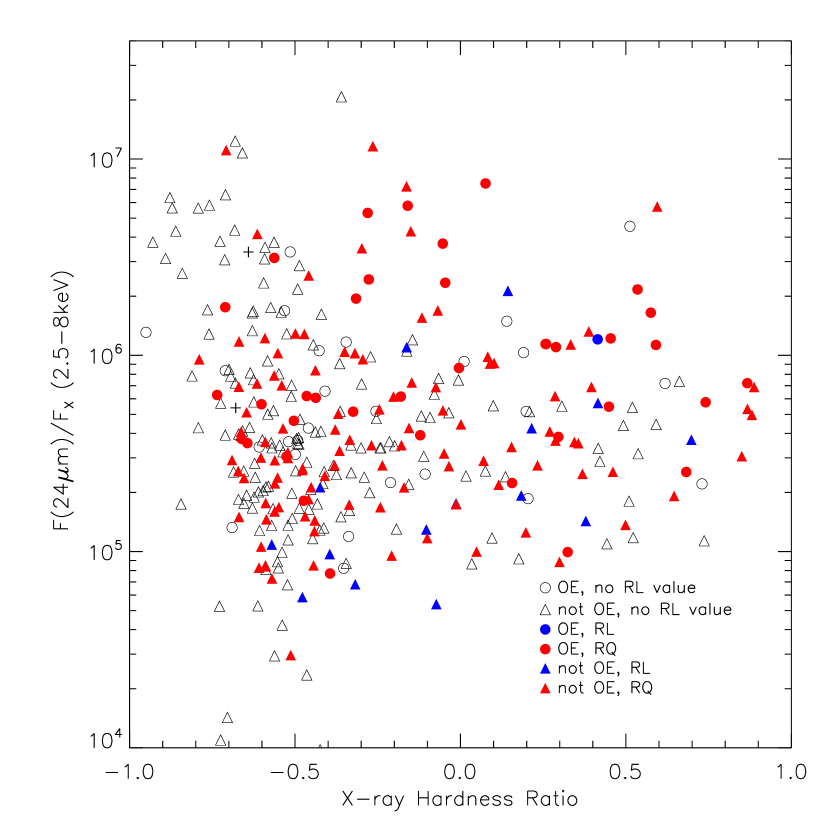
5.5.2 Radio-loudness determined using 24m flux, q24.
Given the limitations of RL, it has been suggested that IR fluxes provide a more stable measure of the radio-loudness. In particular q24 (=log(F24μm/F20cm), Appleton et al. 2004, Kuraszkiewicz et al. 2009c) is minimally effected by Eddington ratio, host galaxy contribution, redshift and/or reddening. The stability of the 24m flux to obscuration is shown in Figure 12 where the ratio of the 24m flux to the broad (left) and hard (right) band X-ray fluxes is plotted as a function of X-ray hardness ratio. The broad band X-ray flux shows that hard, low-redshift sources have higher 24m flux relative to the X-ray while the hard band X-ray flux does not. The effect is most likely due to absorption in the X-ray band and indicates that the 24m flux is not effected by the X-ray absorbing material.
In Figure 13 we show the relation between q24 and RL for the 147 sources in our sample for which data is available in all bands. The majority of the sources are distributed around q24 1, consistent with the IR-radio correlation for galaxies, on which radio-quiet AGN also lie (Appleton et al. 2004). Kuraszkiewicz et al. (2009c) make a systematic comparison of the two parameters for a large sample of blue, Type 1 quasars selected from the WSRT radio survey. The historically-used transition from radio-loud to radio-quiet, R for the current dataset, and the equivalent value for q24(=0.240.12) derived by Kuraszkiewicz et al. (2009c) are indicated by dotted lines. This figure dramatically shows the large number of cross-over sources, those in the top right-hand quadrant, which are radio-loud according to RL and radio-quiet according to q24. The conclusion that radio classification using RL is incorrect for these AGN is reinforced by the fact that they have q24, as expected for radio-quiet AGN and galaxies (Appleton et al. 2004). Using q24, 13 of the 147 sources are radio-loud, in excellent agreement with the expected 510% of radio-loud AGN based on optically-selected, Type 1 (unobscured, blue) AGN (Peterson 1997). Figure 11 (RHS) shows the same plot as the LHS but using q24 to define radio-loudness. A much smaller fraction of sources is radio-loud and they are not systematically placed in the figure.
Figure 14 shows the Spitzer IRAC fluxes as a function of X-ray flux (as in Figure 8) with q24-classified, radio-loud sources indicated. There is no visible relation between the radio class and the relative IR and X-ray fluxes.
We conclude that q24 is far superior to RL for classification of radio-loud vs radio-quiet AGN.
6 Conclusions
We present a list of 775 Chandra X-ray sources in the SWIRE/Chandra medium-depth, X-ray survey. Cross-correlation with Spitzer, optical and radio images of part/all of the field resulted in 771 (99%) identifications in at least one optical/IR band, 767 have IR counterparts visible in the Spitzer data in at least one (IRAC) band and 333 have 24m with MIPS detections. Four of the sources have no optical/IR counterpart down to our flux limits and 4 have an optical but no IR couterpart. We present multi-wavelength flux measurements for 744 X-ray sources, all those which are uncontaminated, unconfused and above the formal survey thresholds. The near-IRX-ray datasets are well-matched in flux limit and go deep into the AGN population, providing an excellent dataset for multi-wavelength studies of the full AGN population, which will be reported in a companion paper (Polletta et al., in prep.). As in earlier surveys (DK04), there is no correlation between X-ray hardness and hard X-ray flux in this sample, confirming that hardness is predominantly caused by obscuration in the X-rays.
The very deep (2.7 Jy at the field center) VLA data, covering part of the Chandra field (Figure 1), results in 251 () radio detections, % of the 568 X-ray sources in the VLA field. Even the very deepest radio data cannot detect all the X-ray sources. We demonstrate that the traditional radio-to-optical flux ratio, RL, used to define radio-loudness in AGN breaks down for a large proportion of the sources in this X-ray selected sample due to the weakness of the optical emission. Use of the 24m flux in place of the optical, the q24 parameter (Appleton et al. 2004), brings the radio-loud fraction down to expected levels (9%) and is strongly preferred as an indicator of radio-loudness for the full AGN population.
The wide range of optical/IR/X-ray SEDs in this X-ray selected sample is demonstrated by the lack of any correlation between the optical or IR flux and the X-ray flux. Comparison with tracks for optically-selected, Type 1, and red AGN SEDs demonstrates the predominance of red AGN in this sample. There is a continuous distribution rather than distinct classes of AGN, and the IR vs X-ray plots allow better discrimination than the optical as the effects of obscuration are much lower. Comparison of the source properties (X-ray hardness, flux ratios and radio loudness) with the predictions of the standard median SEDs allows us to broadly classify the source types as a function of position in flux-flux plots. A correlation between the 24m flux and the X-ray hardness disappears when the hard X-ray flux is used, demonstrating that it is due to absorption in the X-rays while the 24m flux remains uneffected. This reinforces the use of q24 to define radio-loudness due to its stability.
Acknowledgements
This work is based in part on observations made with the Spitzer Space Telescope, which is operated by the Jet Propulsion Laboratory, California Institute of Technology under a contract with NASA. We gratefully acknowledge the financial support of NASA Contract: NAS8-03060 (Chandra X-ray Center, BW) and Chandra GO grant: GO4-5158A (RK). MP acknowledges financial contribution from contracts ASI-INAF I/016/07/0 and ASI-INAF I/088/06/0.
References
- (1) Alexander, D.M., Vignali, C., Bauer, F.E., Brandt, W.N., Hornschemeier, A.E., Garmire, G.P. & Schneider, D.P., 2002, AJ, 123, 1149
- (2) Alexander, D.M., et al. 2003, AJ 123, 539
- (3) Antonucci, R.R.J., & Miller, J.S., 1985, ApJ, 297, 621
- (4) Appleton, P.N., et al., 2004, ApJS, 154, 147
- (5) Barmby, P., Alonso-Herrero, A., Donley, J.L., Egami, E., Fazio, G.G., Georgakakis, A., Huang, J.-S., Laird, E.S., Miyazaki, S., Nandra, K., Park, S.Q., Perez-Gonzalez, P.G., Rieke, G.H., Rigby, J.R., & Willner, S.P., 2006, ApJ, 642, 126
- Basilakos et al. (2005) Basilakos, S., Plionis, M., Georgakakis, A., & Georgantopoulos, I. 2005, MNRAS, 356, 183
- (7) Boroson, T.A., 2002, ApJ, 565, 78
- (8) Brusa, M., Comastri., A., Daddi, E., Pozzetti, L., Zamorani, G., Vignali, C., Cimatti., M., Fiore, F., Mignoli, M., Ciliegi, P., & Rottgering, H.J.A., 2005, A&A, 432, 69
- (9) Cardamone, C.N., Urry, C.M., Damen, M., van Dokkum, P., Treister, E., Labbe, I., Virani, S.N., Lira, P., & Gawiser, E., 2008, ApJ, 680, 130
- Chiappetti et al. (2005) Chiappetti, L., Tajer, M., Trinchieri, G., Maccagni, D., Maraschi, L., Paioro, L., Pierre, M., Surdej, J., Garcet, O., Gosset, E., Le Fevre, O., Bertin, E., McCracken, H. J., Mellier, Y., Foucaud, S., Radovich, M., Ripepi, V., Arnaboldi, M., 2005, A&A, 439, 413
- (11) Comastri, A., Mignoli, M., Ciliegi, P., Severgnini, P., Maiolino, R., Brusa, M., Fiore, F., Baldi, A., Molendi, S., Morganti, R., Vignali, C., La Franc, F., Matt, G., & Perola, G.C., 2002, ApJ, 571, 771
- (12) Cutri, R.M., Nelson, B.O., Francis, P.J., & Smith, P.S., 2002, APDC, 284, 127
- (13) Daddi, E., Alexander, D.M. et al. 2007, ApJ, 670, 173
- (14) Donley, J.L., Reike, G., Perez-Gonzalez, P.G., & Barro, G., 2008, ApJ, 687, 111
- (15) Elvis, M.S., Wilkes, B.J., McDowell, J.C., Green, R.F., Bechtold, J., Willner, S.P., Oey, M.S., Polomski, E., & Cutri, R., 1994, ApJ., 95, 1
- (16) Elvis, M.S., et al., 2009 (arXiv:0903.2062v3)
- (17) Falcke, H., Sherwood, W., Patnaik, A.R., 1996, ApJ, 471, 106
- (18) Feruglio, C., Fiore, F., La Franca, F., Sacchi, N., Puccetti, S., Comastri, A., Berta, S., Brusa, M., Franceschini, A., Gruppioni, C., Mathur, S., Matute, I., Mignoli, M., Pozzi, F., Vignali, C. & Zamorani, G., 2008, A&A, 488, 417
- (19) Fiore, F., et al., 2008, ApJ, 672, 94
- (20) Franceschini, A., et al., 2005, AJ, 129, 2074
- (21) Fukugita, M., Ichikawa, T., Gunn, J.E., Doi, M., Shimasaku, K. & Schneider, D.P., 1996, AJ, 111, 1748
- (22) Gilli, R, Comastri, A. & Hasinger, G., 2007, A&A, 463, 79
- (23) Gorjian, V., et al., 2008, ApJ, 679, 1040
- (24) Scoville, N., et al., 2007, ApJS, 172, 1
- (25) Hickox, R., Jones, C., Forman, W.R., Murray, S.S., Kochanek, C.S., Eisenstein, D., Jannuzi, B.T., Dey, A., Brown, M.J.I., Stern, D., Eisenhardt, P.R., Gorjian, V., Brodwin, M., Narayan, R., Cool, R.J., Kenter, A., Caldwell, N., & Anderson, M.E., 2009, ApJ, 696, 891
- (26) Hopkins, P.F., Hickox, R., Quartet, E., Hernquist, L., 2009, MNRAS, 398, 333
- (27) Irwin, M., & Lewis, J., 2001, “INT WFS pipeline processing”, NewAR, 45, 105
- (28) Kellermann, K.I., Sramek, R., Schmidt, M., Shaffer, D.B,. & Green, R., 1989, AJ, 98, 1195
- Kim, D.-W. and Fabbiano (2003) Kim, D.-W., & Fabbiano, G. 2003, ApJ, 586, 826
- (30) Kim, D.-W., Wilkes, B. J., Green, P. J., Cameron, R. A., Drake, J. J., Evans, N. R., Freeman, P., Gaetz, T. J., Ghosh, H., Harnden, F. R., Jr., Karokska, M., Kashyap, V., Maksym, P.W., Ratzlaff, P.W., Schlegel, E.M., Silverman, J.D., Tananbaum, H.D. & Vikhlinin, A.A., 2004, ApJS, 150, 19 [DK04]
- (31) Kim, M., Kim, D.-W., Wilkes, B. J., Green, P. J., Kim, E., Anderson, C. S., Barkhouse, W. A., Evans, N. R., Ivezi, ., Karovska, M., Kashyap, V. L., Lee, M. G., Maksym, P., Mossman, A. E., Silverman, J. D., & Tananbaum, H. D. 2007a, ApJS, 169, 401 [MK07]
- Kim, M. et al. (2007b) Kim, M., Wilkes, B. J., Kim, D.-W., Green, P. J., Barkhouse, W. A., Lee, M. G., Silverman, J. D., Tananbaum, H. D. 2007b, ApJ, 659, 29
- (33) Komossa, S., Voges, W., Dawei, A., Mathur, S., Adorf, H-M., Lemson, G., Duschl, W., & Grupe, D., 2006, AJ, 132, 531
- (34) Kuraszkiewicz, J., Wilkes, B.J., Schmidt, G., Ghosh, H., Smith, P.S., Cutri, R., Hines. D., McDowell, J.C. & Nelson, B., 2009a, ApJ, 692, 1143
- (35) Kuraszkiewicz, J., Wilkes, B.J., Schmidt, G., Smith, P.S., Cutri, R. & Czerny, B., 2009b, ApJ, 692, 1180
- (36) Kuraszkiewicz, J., Rieke, G.H., Beichman, C.A., Stern, D., Cool, R.J., Kochanek, C.S., Eisenstein, D.J., Jannuzi, B.T. & Higdon, J.L., 2009c, ApJ submitted
- (37) Lacy, M., Laurent-Muehleison, S.A., Ridgeway, S.E., Becker, R.H. & White, R.L., 2001, ApJ, 551, 17
- (38) Laird, E.S., Nandra, K., et al. 2009, ApJS, 180, 102
- (39) Lehmer, B.D., Brandt, W.N., et al. ApJS, 161, 21
- (40) Luo, B., Bauer, F.E., Brandt, W.N. et al. 2008, ApJS, 179, 19
- (41) Norman, C., Hasinger, G., Giacconi, R., Gilli, R., Kewley, L., Nonino, M., Rosati, P., Szokoly, G., Tozzi, P., Wang, J., Zheng, W., Zirm, A., Bergeron, J., Gilmozzi, R., Grogin, N., Koekemoer, A., Schreier, E., 2002, ApJ, 571, 218
- (42) Owen, F.N., & Morrison, G.E., 2008, ApJ, 136, 1889
- (43) Park, S.Q. et al., 2008, ApJ, 678, 744
- (44) Park, S.Q., Kashyap, V.L., Siemiginowska, A., van Dyk, D.A., Zezas, A., Heinke, C. & Wargelin, B., 2006, ApJ, 652, 610
- (45) Peterson, B.M., An Introduction to Active Galactic Nuclei, CUP, 1997
- (46) Polletta, M.C., Wilkes, B.J., Siana, B., Lonsdale, C., Kilgard, R.E., Smith, H.E., Kim, D.-W., Owen. F., Efstathiou, A., Jarrett, T., Stacey, G., Franceschini, A., Rowan-Robinson, M., Babedge, T.S.R., Berta, S, Fang, F., Farrah, D., Gonzalez-Solares, E., Morrison, G., Surace, J. & Shupe, D., 2006, ApJ, 642, 673
- (47) Polleta, M., et al., 2007, ApJ, 663, 81
- (48) Schlegel, D.J., Finkbeiner, D.P., & Davis, M., 1998, ApJ, 500, 525
- (49) Sambruna, R.M., Reeves, J.N. & Braito, V., 2007, ApJ, 665, 1030
- (50) Shupe, D.L. et al. 2008, AJ, 135, 1050
- (51) Smith, P.S., Schmidt, G.D., Hines, D.C. & Foltz, C.B., 2003, ApJ, 593, 676
- (52) Surace, J., SWIRE Data Delivery Document II, Tech. Rep., Spitzer Science Center, 2005
- Stark et al. (1992) Stark, A. A., Gammie, C. F., Wilson, R. W., Bally, J., Linke, R. A., Heiles, C., Hurwitz, M., 1992, ApJS, 79, 77
- (54) Stocke, John T., Morris, Simon L., Gioia, I. M., Maccacaro, T., Schild, R., Wolter, A., Fleming, Thomas A., Henry, J. Patrick, 1991, ApJS, 76, 813
- Tozzi et al. (2006) Tozzi, P., Gilli, R., Mainieri, V., Norman, C., Risaliti, G., Rosati, P., Bergeron, J., Borgani, S., Giacconi, R., Hasinger, G., Nonino, M., Streblyanska, A., Szokoly, G., Wang, J. X., & Zheng, W. 2006, A&A, 451, 457
- (56) Trouille, L., Barger, A.J., Cowie, L.L., Yang, Y. & Mushotzky, R.F., 2008, ApJS, 179, 1
- (57) Treister, E., Urry, C.M., et al., 2004, ApJ 616, 123
- (58) Treister, E., Urry, C.M. & Virani, S., 2009, ApJ, 696, 110
- (59) White, R.L., Becker, R.H., et al., 2000, ApJS, 126, 133
- (60) White, R.L., Helfand, D.J., Becker, R.H., Glikman, E., & de Vries, W., 2007, ApJ, 654, 99
- Vikhlinin et al. (1995) Vikhlinin, A., Forman, W., Jones, C., & Murray, S. S. 1995, ApJ, 451, 542
- (62) Wilkes, B.J. & Elvis, M.S., 1987, ApJ, 323, 243
- (63) Witt, H.J., Czerny, B., & Zycki, P.T., 1997, MNRAS, 286, 848
- Yang et al. (2004) Yang, Y., Mushotzky, R. F., Steffan, A. T., Barger, A. J., & Cowie, L. L. 2004, AJ, 128, 1501
- (65) Zamfir, S., Sulentic, J.W., & Marziani, P., 2008, MNRAS, 387, 856
| ObsID | Aimpoint | Date Obs. | Exp. time | Galactic | Roll Angle |
|---|---|---|---|---|---|
| J2000.0 | UT | sec | () | ||
| 5023 | 10:46:02.15 +59:00:58.42 | 2004-09-12, 21:31:59 | 67146.56 | 6.6 | 17.60 |
| 5024 | 10:44:48.27 +58:41:53.88 | 2004-09-16, 06:54:50 | 66297.89 | 6.4 | 17.60 |
| 5025 | 10:46:41.57 +58:46:49.66 | 2004-09-17, 20:31:07 | 69257.73 | 6.3 | 17.60 |
| 5026 | 10:48:34.91 +58:51:45.76 | 2004-09-18, 16:18:16 | 68863.14 | 6.4 | 17.60 |
| 5027 | 10:44:08.82 +58:56:04.42 | 2004-09-20, 14:41:38 | 67076.31 | 6.7 | 20.07 |
| 5028 | 10:47:55.60 +59:05:56.46 | 2004-09-23, 03:37:16 | 71145.48 | 6.5 | 21.20 |
| 5029 | 10:43:29.40 +59:10:14.55 | 2004-09-24, 03:44:19 | 71127.09 | 7.1 | 21.20 |
| 5030 | 10:45:22.74 +59:15:10.64 | 2004-09-25, 19:48:12 | 65748.49 | 6.9 | 21.20 |
| 5031 | 10:47:16.03 +59:20:06.44 | 2004-09-26, 14:48:04 | 65393.51 | 6.8 | 21.20 |
| Band | Definition |
|---|---|
| Broad (B) | keV |
| Soft (S) | keV |
| Hard (H) | keV |
| Soft1 (S1) | keV |
| Soft2 (S2) | keV |
| Conventional Broad (Bc) | keV |
| Conventional Soft (Sc) | keV |
| Conventional Hard (Hc) | keV |
| Hardness Ratio | (HcSc)(HcSc) |
| Name | RA | Dec | Pos. err 1 | X-ray counts | Count rate |
|---|---|---|---|---|---|
| J2000 | J2000 | arcsec | 0.3-8.0 keV | counts/sec | |
| CXOSWJ104629.3+585941 | 10:46:29.27 | 58:59:41.3 | 0.16 | 131.3 12.6 | 1.96E-03 1.88E-04 |
| CXOSWJ104616.4+585921 | 10:46:16.41 | 58:59:21.1 | 0.24 | 27.9 6.6 | 4.16E-04 9.76E-05 |
| CXOSWJ104613.5+585941 | 10:46:13.47 | 58:59:41.6 | 0.09 | 150.6 13.4 | 2.24E-03 2.00E-04 |
| CXOSWJ104647.0+585618 | 10:46:46.95 | 58:56:18.3 | 0.49 | 106.1 12.0 | 1.58E-03 1.79E-04 |
| CXOSWJ104638.5+585642 | 10:46:38.47 | 58:56:42.9 | 0.51 | 50.5 8.8 | 7.53E-04 1.30E-04 |
| CXOSWJ104633.2+585815 | 10:46:33.18 | 58:58:15.9 | 0.26 | 91.4 10.8 | 1.36E-03 1.61E-04 |
| CXOSWJ104622.4+590052 | 10:46:22.40 | 59:00:52.7 | 0.26 | 25.9 6.3 | 3.85E-04 9.35E-05 |
| CXOSWJ104622.0+585630 | 10:46:21.97 | 58:56:30.1 | 0.31 | 80.4 10.3 | 1.20E-03 1.53E-04 |
| CXOSWJ104658.9+585959 | 10:46:58.91 | 58:59:59.6 | 0.83 | 33.6 7.9 | 5.00E-04 1.17E-04 |
| CXOSWJ104649.5+585532 | 10:46:49.49 | 58:55:32.2 | 0.86 | 45.1 9.2 | 6.71E-04 1.37E-04 |
| CXOSWJ104647.3+590122 | 10:46:47.30 | 59:01:22.4 | 0.49 | 67.5 9.7 | 1.01E-03 1.44E-04 |
| CXOSWJ104644.1+590028 | 10:46:44.07 | 59:00:28.3 | 0.49 | 33.1 7.2 | 4.94E-04 1.07E-04 |
| CXOSWJ104637.5+585914 | 10:46:37.49 | 58:59:14.8 | 0.65 | 21.9 6.1 | 3.26E-04 9.07E-05 |
| CXOSWJ104707.3+590014 | 10:47:07.27 | 59:00:14.6 | 0.85 | 49.8 9.5 | 7.42E-04 1.41E-04 |
| CXOSWJ104654.6+585804 | 10:46:54.57 | 58:58:04.3 | 0.75 | 36.1 8.2 | 5.38E-04 1.22E-04 |
| CXOSWJ104653.3+585735 | 10:46:53.32 | 58:57:35.2 | 0.92 | 21.0 7.2 | 3.13E-04 1.07E-04 |
| CXOSWJ104651.0+585824 | 10:46:50.98 | 58:58:24.9 | 1.00 | 11.2 5.9 | 1.66E-04 8.83E-05 |
| CXOSWJ104648.1+590103 | 10:46:48.12 | 59:01:03.0 | 1.08 | 16.6 6.0 | 2.47E-04 8.95E-05 |
| CXOSWJ104705.3+585850 | 10:47:05.26 | 58:58:50.4 | 1.59 | 16.2 7.1 | 2.42E-04 1.06E-04 |
| CXOSWJ104703.1+585622 | 10:47:03.05 | 58:56:22.3 | 1.72 | 20.3 8.0 | 3.02E-04 1.19E-04 |
| CXOSWJ104658.4+585914 | 10:46:58.37 | 58:59:14.7 | 1.56 | 22.9 7.0 | 3.41E-04 1.05E-04 |
| CXOSWJ104632.7+585409 | 10:46:32.71 | 58:54:09.4 | 1.63 | 26.5 7.8 | 3.94E-04 1.15E-04 |
| CXOSWJ104611.1+585517 | 10:46:11.06 | 58:55:17.5 | 0.44 | 58.4 9.1 | 8.69E-04 1.36E-04 |
| CXOSWJ104607.6+585602 | 10:46:07.60 | 58:56:02.8 | 0.63 | 15.6 5.5 | 2.33E-04 8.13E-05 |
| CXOSWJ104557.0+590000 | 10:45:57.00 | 59:00:00.4 | 0.19 | 23.6 6.1 | 3.52E-04 9.06E-05 |
1: The position error was determined as described in MK07
| Name | Flux Density1 | Broad-band Flux1 | Soft Flux1 | Hard Flux1 | Hardness |
|---|---|---|---|---|---|
| 1 keV | 0.3-8 keV | 0.3-2.5 keV | 2.5-8 keV | Ratio2 | |
| CXOSW J104629.3+585941 | 5.76E-15 | 2.24E-14 | 1.33E-14 | 6.45E-15 | |
| CXOSW J104616.4+585921 | 1.23E-15 | 4.65E-15 | 2.92E-15 | 9.12E-16 | |
| CXOSW J104613.5+585941 | 6.61E-15 | 2.49E-14 | 1.19E-14 | 1.56E-14 | |
| CXOSW J104647.0+585618 | 4.65E-15 | 1.91E-14 | 1.00E-14 | 9.40E-15 | |
| CXOSW J104638.5+585642 | 2.22E-15 | 8.93E-15 | 4.50E-15 | 4.90E-15 | |
| CXOSW J104633.2+585815 | 4.01E-15 | 1.58E-14 | 8.67E-15 | 6.67E-15 | |
| CXOSW J104622.4+590052 | 1.13E-15 | 4.69E-15 | 1.71E-15 | 4.44E-15 | |
| CXOSW J104622.0+585630 | 3.53E-15 | 1.49E-14 | 7.88E-15 | 7.18E-15 | |
| CXOSW J104658.9+585959 | 1.47E-15 | 6.14E-15 | 3.40E-15 | 2.50E-15 | |
| CXOSW J104649.5+585532 | 1.98E-15 | 8.71E-15 | 5.24E-15 | 2.36E-15 | |
| CXOSW J104647.3+590122 | 2.96E-15 | 1.20E-14 | 2.91E-15 | 1.56E-14 | |
| CXOSW J104644.1+590028 | 1.45E-15 | 5.84E-15 | 2.35E-15 | 4.90E-15 | |
| CXOSW J104637.5+585914 | 9.60E-16 | 3.80E-15 | 1.68E-15 | 2.74E-15 | |
| CXOSW J104707.3+590014 | 2.19E-15 | 9.31E-15 | 2.18E-15 | 1.23E-14 | |
| CXOSW J104654.6+585804 | 1.58E-15 | 6.83E-15 | 4.81E-15 | - | |
| CXOSW J104653.3+585735 | 9.23E-16 | 3.89E-15 | 2.16E-15 | 1.59E-15 | |
| CXOSW J104651.0+585824 | 4.90E-16 | 2.05E-15 | 5.92E-16 | 2.39E-15 | |
| CXOSW J104648.1+590103 | 7.29E-16 | 2.96E-15 | 1.31E-15 | 2.15E-15 | |
| CXOSW J104705.3+585850 | 7.12E-16 | 3.06E-15 | 2.47E-15 | - | |
| CXOSW J104703.1+585622 | 8.91E-16 | 3.85E-15 | 9.86E-16 | 4.83E-15 | |
| CXOSW J104658.4+585914 | 1.01E-15 | 4.19E-15 | 2.41E-15 | 1.43E-15 | |
| CXOSW J104632.7+585409 | 1.16E-15 | 4.90E-15 | 1.89E-15 | 4.34E-15 | |
| CXOSW J104611.1+585517 | 2.56E-15 | 1.01E-14 | 5.53E-15 | 4.36E-15 | |
| CXOSW J104607.6+585602 | 6.85E-16 | 2.89E-15 | 1.22E-15 | 2.24E-15 | |
| CXOSW J104557.0+590000 | 1.04E-15 | 7.83E-15 | 4.02E-15 | 4.11E-15 |
1: Fluxes assume Galactic NH and = 1.7, in units of erg cm-2 s-1 (flux) and erg cm-2 s-1 keV-1 (flux density)
2: Hardness Ratio = (H-S)/(H+S), where H = counts in hard band (2.5-8keV), S = Counts in the soft band (0.3-2.5keV), determined using a Bayesian approach which is applicable for low count sources (see text)
| Source | / DOF | ||
|---|---|---|---|
| CXOSW J104655.5+590301 | 35.77/37 | ||
| CXOSW J104540.1+5842541 | 59.80/50 | ||
| CXOSW J104929.2+585338 3 | 89.79/70 | ||
| CXOSW J104803.4+585547 2 | 25.97/16 | ||
| CXOSW J104415.8+590101 | 24.71/26 | ||
| CXOSW J104404.0+5902414 | 19.58/25 | ||
| CXOSW J104343.2+585535 | 24.99/24 | ||
| CXOSW J104847.0+590455 | 20.17/18 | ||
| CXOSW J104811.7+591046 3 | 26.74/19 | ||
| CXOSW J104422.6+591304 | 53.39/65 | ||
| CXOSW J104321.3+590943 | 67.08/83 | ||
| CXOSW J104503.4+591242 3 | 37.06/25 | ||
| CXOSW J104511.2+591625 | 35.02/40 | ||
| CXOSW J104743.5+591849 | 15.49/23 | ||
| CXOSW J104713.6+591501 | 19.44/17 |
-
•
1. Fit with pl+nei ( = 2.13, kT = 0.065, reduced = 0.87), pl+bbody ( = 2.66, kT = 2.77, reduced = 0.97), or 2 power-laws ( = 5.00, = 1.89, reduced = 0.85).
-
•
2. Fit by a MEKAL model with .
-
•
3. No good fit was found
-
•
4. Shows evidence for a spectral line at 1.14 keV. It is not required for the fit, but is preferred at around the 1.5 level.
-
•
5. Hard parameter space minimum
| DATA | Band1 | |||||
|---|---|---|---|---|---|---|
| SWIRE | 1.4 | S | 1011 | 1.89 | 2.35 | 12.7 |
| H | 1263 | 1.65 | 2.49 | 7.5 | ||
| B | 1540 | 1.67 | 2.71 | 23.4 | ||
| 1.7 | S | 974 | 1.85 | 2.39 | 13.5 | |
| H | 1762 | 1.88 | 2.47 | 7.9 | ||
| B | 1489 | 1.68 | 2.70 | 22.2 | ||
| 1.4 | Sc | 560 | 1.65 | 2.42 | 7.1 | |
| Hc | 1722 | 1.84 | 2.81 | 14.9 | ||
| Bc | 1548 | 1.66 | 2.40 | 14.8 | ||
| 1.7 | Sc | 579 | 1.66 | 2.41 | 7.3 | |
| Hc | 1384 | 1.72 | 2.59 | 9.5 | ||
| Bc | 1384 | 1.66 | 2.41 | 13.4 | ||
| ChaMP6 | 1.4 | S | 769 | 1.57 | 2.41 | 9.9 |
| H | 1828 | 1.81 | 2.58 | 14.2 | ||
| B | 1614 | 1.65 | 2.44 | 25.0 | ||
| 1.7 | S | 783 | 1.58 | 2.42 | 10.5 | |
| H | 1774 | 1.80 | 2.58 | 13.5 | ||
| B | 1505 | 1.65 | 2.45 | 21.9 | ||
| 1.4 | Sc | 607 | 1.54 | 2.36 | 6.8 | |
| Hc | 2040 | 1.82 | 2.65 | 19.2 | ||
| Bc | 1557 | 1.64 | 2.48 | 22.9 | ||
| 1.7 | Sc | 612 | 1.53 | 2.36 | 6.7 | |
| Hc | 1932 | 1.82 | 2.64 | 17.8 | ||
| Bc | 1407 | 1.64 | 2.48 | 19.2 | ||
| ChaMP+ | 1.4 | Sc | 571 | 1.49 | 2.36 | 6.5 |
| CDFs1 | Hc | 1258 | 1.58 | 2.59 | 14.4 |
1: X-ray energy band (Table 2)
2: normalization constant
3: faint power index of a broken power law
4: bright power index of a broken power law
5: break flux in units of
6. from Kim et al., 2007b
| Name | SWIRE ID | pos.2 | r’ mag | g’ mag | 3.6 m flux | 8 m flux | 24 m flux | 20cm flux |
|---|---|---|---|---|---|---|---|---|
| arcsec | Jy | Jy | Jy | Jy | ||||
| CXOSW J104629.3+585941 | 561274 | 0.26 | 24.43 0.09 | 24.89 0.09 | 11.86 0.45 | 30.50 3.18 | -209.0 0.00 | 13.6 3.4 |
| CXOSW J104616.4+585921 | 559904 | 0.87 | 22.16 0.02 | 24.00 0.07 | 15.33 0.53 | -40.00 0.00 | -209.0 0.00 | 39.5 7.6 |
| CXOSW J104613.5+585941 | 559874 | 0.25 | 22.97 0.03 | 23.34 0.06 | 26.57 0.66 | 127.34 3.61 | 1147. 17.0 | 92.0 5.5 |
| CXOSW J104647.0+585618 | 560498 | 0.94 | 24.61 0.11 | 25.15 0.11 | 6.49 0.40 | 47.76 3.43 | -209.0 0.00 | 23.0 4.2 |
| CXOSW J104638.5+585642 | 560041 | 0.44 | -25.20 0.00 | -25.90 0.00 | 25.96 0.63 | 65.64 3.08 | 193.6 17.3 | -14.7 0.0 |
| CXOSW J104633.2+585815 | 560612 | 0.94 | 20.49 0.02 | 21.90 0.02 | 217.91 1.81 | 95.33 5.67 | 1188. 19.3 | 266.0 8.2 |
| CXOSW J104622.4+590052 | 561464 | 0.50 | -25.20 0.00 | -25.90 0.00 | 4.87 0.50 | -40.00 0.00 | -209.0 0.00 | 15.7 3.9 |
| CXOSW J104622.0+585630 | 558585 | 0.31 | 18.45 0.02 | 19.76 0.06 | 265.98 1.85 | 272.25 5.80 | 750.9 18.1 | 421.2 3.3 |
| CXOSW J104658.9+585959 | 564107 | 0.88 | -25.20 0.00 | -25.90 0.00 | 10.88 0.44 | -40.00 0.00 | 164.9 16.6 | 23.0 3.8 |
| CXOSW J104649.5+585532 | 560200 | 0.98 | 22.00 0.03 | 22.65 0.03 | 25.08 0.57 | 32.19 3.06 | -209.0 0.00 | -16.0 0.0 |
| CXOSW J104647.3+590122 | 564038 | 2.57 | 23.94 0.06 | 24.30 0.07 | 22.85 0.51 | 39.14 3.29 | 312.1 16.9 | 93.0 6.1 |
| CXOSW J104644.1+590028 | 563124 | 1.63 | 22.59 0.04 | 23.52 0.05 | 29.87 0.67 | 78.35 3.42 | 803.9 17.5 | 29.9 5.6 |
| CXOSW J104637.5+585914 | 561669 | 1.56 | 23.39 0.04 | 24.43 0.08 | 33.64 0.68 | -40.00 0.00 | 294.6 18.9 | -13.2 0.0 |
| CXOSW J104707.3+590014 | 564944 | 1.53 | 21.51 0.02 | 23.03 0.06 | 28.77 0.65 | 27.37 3.23 | -209.0 0.00 | -19.6 0.0 |
| CXOSW J104654.6+585804 | 562426 | 0.85 | 22.91 0.03 | 23.60 0.06 | 16.62 0.52 | -40.00 0.00 | -209.0 0.00 | -14.7 0.0 |
| CXOSW J104653.3+585735 | 561949 | 1.15 | 23.49 0.05 | 24.78 0.09 | 24.81 0.70 | -40.00 0.00 | -209.0 0.00 | -14.7 0.0 |
| CXOSW J104651.0+585824 | 562326 | 1.34 | 23.47 0.04 | 24.40 0.08 | 42.93 0.77 | 43.02 3.27 | -209.0 0.00 | -14.7 0.0 |
| CXOSW J104648.1+590103 | 563893 | 1.43 | -25.20 0.00 | 25.53 0.14 | 8.44 0.44 | -40.00 0.00 | -209.0 0.00 | 17.0 4.0 |
| CXOSW J104705.3+585850 | 563861 | 4.30 | 24.28 0.08 | 25.21 0.11 | 23.18 0.55 | 60.23 3.47 | 375.6 19.0 | -16.0 0.0 |
| CXOSW J104703.1+585622 | 561941 | 3.17 | 24.08 0.07 | 24.80 0.09 | 26.34 0.62 | 37.50 3.28 | 299.7 17.0 | 21.9 4.5 |
| CXOSW J104658.4+585914 | 563547 | 2.69 | 21.95 0.02 | 22.85 0.06 | 57.27 0.82 | -40.00 0.00 | -209.0 0.00 | 28.2 6.7 |
| CXOSW J104632.7+585409 | 557958 | 1.59 | -25.20 0.00 | -25.90 0.00 | 5.66 0.39 | -40.00 0.00 | -209.0 0.00 | 32.6 4.0 |
| CXOSW J104611.1+585517 | 556975 | 0.60 | 23.69 0.05 | 24.10 0.07 | 10.42 0.52 | -40.00 0.00 | -209.0 0.00 | 88.4 3.4 |
| CXOSW J104607.6+585602 | 557127 | 1.58 | -25.20 0.00 | -25.90 0.00 | 12.61 0.50 | -40.00 0.00 | -209.0 0.00 | 256.0 3.2 |
| CXOSW J104557.0+590000 | 558749 | 0.35 | 23.28 0.04 | 24.42 0.08 | 8.46 0.49 | 51.00 3.69 | -209.0 0.00 | 47.1 5.5 |
1: ve fluxes indicate a 4 upper limit for the radio and 5 for Spitzer and optical fluxes
2: Distance between X-ray and SWIRE source