Collapse of the hyperfine magnetic field at the Ru site in ferromagnetic rare earth intermetallics
Abstract
The Mössbauer Effect(ME) is frequently used to investigate magnetically ordered systems. One usually assumes that the magnetic order induces a hyperfine magnetic field, , at the ME active site. This is the case in the ruthenates, where the temperature dependence of at 99Ru sites tracks the temperature dependence of the ferromagnetic or antiferromagnetic order. However this does not happen in the rare-earth intermetallics, GdRu2 and HoRu2. Specific heat, magnetization, magnetic susceptibility, Mössbauer effect, and neutron diffraction have been used to study the nature of the magnetic order in these materials. Both materials are found to order ferromagnetically at 82.3 and 15.3 K, respectively. Despite the ferromagnetic order of the rare earth moments in both systems, there is no evidence of a correspondingly large in the Mössbauer spectrum at the Ru site. Instead the measured spectra consist of a narrow peak at all temperatures which points to the absence of magnetic order. To understand the surprising absence of a transferred hyperfine magnetic field, we carried out ab initio calculations which show that spin polarization is present only on the rare-earth site. The electron spin at the Ru sites is effectively unpolarized and, as a result, is very small at those sites. This occurs because the 4 Ru electrons form broad conduction bands rather than localized moments. These 4 conduction bands are polarized in the region of the Fermi energy and mediate the interaction between the localized rare earth moments.
pacs:
76.80.+y, 71.20.Lp, 28.20.Cz, 75.50.Cc, 75.60.Ej, 75.40.-sI Introduction
Compton and MatthiasCompton1959 found that superconductivity and ferromagnetism occur in Laves phase compounds containing lanthanide elements and Ru. This led to the suggestion that superconductivity and ferromagnetism could coexist in Ce1-xRxRu2 alloys, since superconductivity occurs below 6 K in CeRu2 and ferromagnetism is present in that temperature range in RRu2, where R is Gd or HoMatthias1958 . The phase diagram for Ce1-xRxRu2 was investigated by Wilhelm and HillebrandWilhelm1971 for R=Gd, Ho, Dy, Pr. Although no long range magnetic order was found in the superconducting region of the phase diagrams of these alloys, evidence for short-range order was found in the temperature dependence of the 155Gd ME and in nuclear quadrupole resonance measurements. This occurs in Ce1-xGdxRu2Ruebenbauer1977 ; Kumagai1978 for a narrow range of doping about . Fischer and PeterFischer1973 pointed out that the specific heat of Ce1-xGdxRu2 measured by Peter et al.Peter1971 also showed an anomalous temperature dependence. The specific heat divided by temperature, , for CeRu2 showed a sharp jump at the superconducting transition and a rapid fall off to zero as , as expected. However the jump becomes more rounded in Ce1-xGdxRu2 as increases and increases as . The value of as increases as increases from 0.05 to 0.11. This anomalous temperature dependence was taken as evidence of a ferromagnetic contribution to . The analysis of the data did not provide a microscopic model for the nature of this contribution or explain how it could coexist with superconductivity.
Evidence for the coexistence of superconductivity and short-range ferromagnetic correlations was also found in Ce0.73Ho0.27Ru2 from the temperature dependence of the 57Fe ME below 2 K and from neutron scattering dataLynn1979 ; Lynn1980 ; Willis1980 . Since the hyperfine coupling constant of Ru is twice that of FeWatson1977 it was expected that there would be a magnetic field at the Ru nucleus of about 15 T in this material. Hyperfine magnetic fields were reported at the Gd site in CexGd1-xRu2Ruebenbauer1977 for , whose temperature dependence was consistent with the Curie temperature. More recently, Andoh discussed the magnetic properties of a number of the RRu2Andoh1987 . CeRu2 has been assigned to have the cubic Laves structure(Fdm), although recently Huxley et al.Huxley1997 have shown that its symmetry is lowered due to a slight variation in the displacement of the Ru from their cubic Laves positions. GdRu2 and HoRu2 are in the hexagonal Laves phase structure (P63/mmc). GdRu2 has also been reported in the cubic Laves phase.Krip1963 The difference in structure does not determine whether the ground state is superconducting or ferromagnetic since NdRu2, a ferromagnet, has the Fdm structure. Here we concentrate on reconciling the ferromagnetism found in neutron scattering, transport, and thermodynamic measurements with Mössbauer spectroscopy. Mössbauer spectroscopy is a nuclear probe of the electronic properties of systems which has been used to investigate magnetic order in many systems. The evidence of magnetic order appears in the Mössbauer spectrum as a hyperfine magnetic field induced at the nucleus at which the Mössbauer Effect(ME) is measured. In this way the temperature dependence of magnetic order has been probed by the 99Ru ME in both ferromagnetic and antiferromagnetic ruthenatesDeMarco2000 ; Coffey2008 . The magnetic order has also been investigated using the 57Fe, 193Ir, and 155Gd ME in the intermetallic compounds of interest here. One can distinguish between two cases. In the first case the is found at a site on which there is an ordered electronic moment. This is the case of the ruthenates and a number of rare earth intermetallics. Using the 57Fe ME, Wertheim and WernickWertheim1962 measured values in RFe2(R=Ce, Sm, Gd, Dy, Ho, Er, Tm). is found to be 23T in spite of the wide range in the size of the localized moments on the R sites. By comparison, the value for in ferromagnetic Fe is 32 T. The 57Fe ME has also been used to investigate the magnetic structure in rare earth iron ternary intermetallics.Atzmony1973 De Graaf et al.Graaf1982 extracted a value for equal to 17.5T at the Gd site in GdCu2 using 155Gd ME from a structureless spectrum. In the second case, for a non-magnetic ion in a magnetically ordered lattice, the measured ME at this site is expected to show evidence of the magnetic order through a transferred hyperfine magnetic field. Transferred hyperfine fields at the non-magnetic Ir site were measured by Atzmony et al.Atzmony1967 in RIr2(R=Pr,Nd,Sm,Gd,Tb,Dy,Ho). They found a wide variation from 4 T in HoIr2 to 19 T in GdIr2. Transferred hyperfine fields have also been measured in a rare-earth matrix doped with 1 Sn and in R2Sn using the 119Sn MEBosch1966 . For Sn doped into a rare earth, these range from -5.3 T in a Tm matrix to 23.8 T in a Gd matrix. The values of are linear in the projection of the spin of the rare earth moment on its total angular momentum, . In R2Sn, these fields range from -5.5 T (Er2Sn) to 28.9 T (Gd2Sn). The fact that the sign of the transferred hyperfine field can change suggested that there is competition between different contributions which align or antialign the nuclear moment with the ordered electronic moment. A negative hyperfine magnetic field is antiparallel to the ordered electronic moment. Watson and Freeman were among the first to investigate the origin of the hyperfine magnetic field with large scale numerical calculations based on the Hartree-Fock approximationWatson1961a ; Watson1961b . Although these calculations were limited by the computational capabilities then available, they demonstrated a number of the qualitative features of the experimental data. In particular, they showed that the ordered moment in Gd polarizes the electron density in the opposite direction to the ordered moment very close to the nucleus and in the region beyond localized bands at the edge of the Gd ion. They showed that the largest contribution to the hyperfine magnetic field due to polarization of the spin density of electrons is the result of contributions of different signs from different -shells. Their calculations also showed that the polarization of the spin density on neighboring sites could be opposite to that of the ordered moments leading to the negative hyperfine magnetic field. The sign of the transferred hyperfine field can be modulated by varying the lattice constant, as we describe in the section on calculations of the electronic properties below. In the calculations of Watson and coworkers, it was assumed that the electrons formed the conduction band which turns out not to be the case in GdRu2, as we will also discuss below. In addition orbital contributions to transferred hyperfine magnetic field, based on the assumption that it arises from the coupling of electrons on the rare earth sites with -conduction electrons, were investigated by Dunlap et al.Dunlap1973 Local Spin Density Approximation(LSDA) calculations were first used to calculate hyperfine magnetic fields in ferromagnetic metals by Callaway and WangCallaway1977 ; Wang1977 . We use a more recent implementation of the LSDA to calculate hyperfine fields on Ru sites and compare with our measured values. We present magnetic, transport and thermodynamic data on GdRu2, and magnetic and neutron diffraction data on HoRu2, showing that these are ferromagnetically ordered at low temperatures. However, our ME measurements of GdRu2 and HoRu2 show that at the Ru site is so small that, without the evidence of other experiments, one would conclude that there is no magnetic order. The almost complete collapse of the value of is an unexpected result in materials whose Curie temperatures are 82.3 K and 15.3 K, respectively. Interestingly, the absence of at the Ru sites in GdRu2 was noted previously without commentKistner1966 .
We calculate the electronic properties of these materials using a spin polarized fully relativistic all-electron linearized augmented plane wave methodwien2k . ab initio bandstructure calculations have previously been used by other authors to determine hyperfine magnetic fields and electric field gradients (EFG).Lippens2000 ; Blaha2000 ; Cavor2004 ; Pav2006 We find good agreement between the EFG tensor and that found from the Mössbauer spectra of CeRu2. We also find that the calculated at the Ru sites in GdRu2 and HoRu2 are much smaller than those on Gd and Ho, consistent with the experimental results. First we present the experimental results.
II Experimental Results
II.1 Evidence of Ferromagnetism
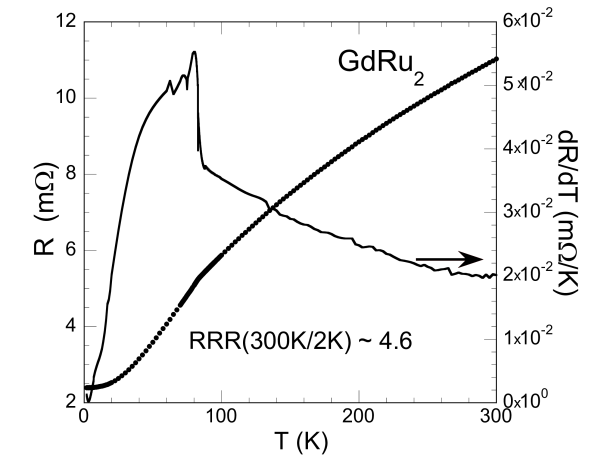
The transport and thermodynamic properties of GdRu2 were investigated with a number of probes. The temperature, , dependence of electrical resistance, , and the slope d/d of a polycrystalline sample of GdRu2 are plotted in Fig. 1. A breaking curvature in , accompanied by a sharp increase of d/d, occurs at K as temperature decreases, which is due to the development of an ordered state. The dc-magnetic susceptibility is measured from 1.9 K to 300 K at an applied magnetic field Oe in the zero field cooled (ZFC) and field cooled (FC) states and the data are displayed in Fig. 2. Hysteresis in appears at K.
A Curie-Weiss analysis was done on the molar magnetic susceptibility data given by
| (1) |
where is the Avogadro’s number, is the effective magnetic moment, is the Landé -factor, is the Boltzmann’s constant, and is the Curie-Weiss temperature. A positive K indicates a ferromagnetic order in GdRu2 and (Bohr magneton), which is close to the theoretical value 7.94 of the free ion moment of Gd3+. This value of is consistent with the temperature at which hysteresis first appears.

Arrott plots of magnetization with respect to the internal magnetic flux density divided by were constructed in an attempt to determine the Curie temperature TC more accurately. A conventional Arrott plot consisting of vs ( isotherms, is shown in Fig. 3(a). In the simplest mean-field analysis of ferromagnetism, vs () isotherms form a series of parallel straight lines near TC, and the isotherm passing through the origin corresponds to TC. However, the -() isotherms of GdRu2 are slightly curved. Therefore, we applied a modified Arrott plot vs (, where and are the critical exponents based on the Arrott-Noakes equation Arrott1967 , and the results are plotted in Fig. 3(b). The value of TC is K.
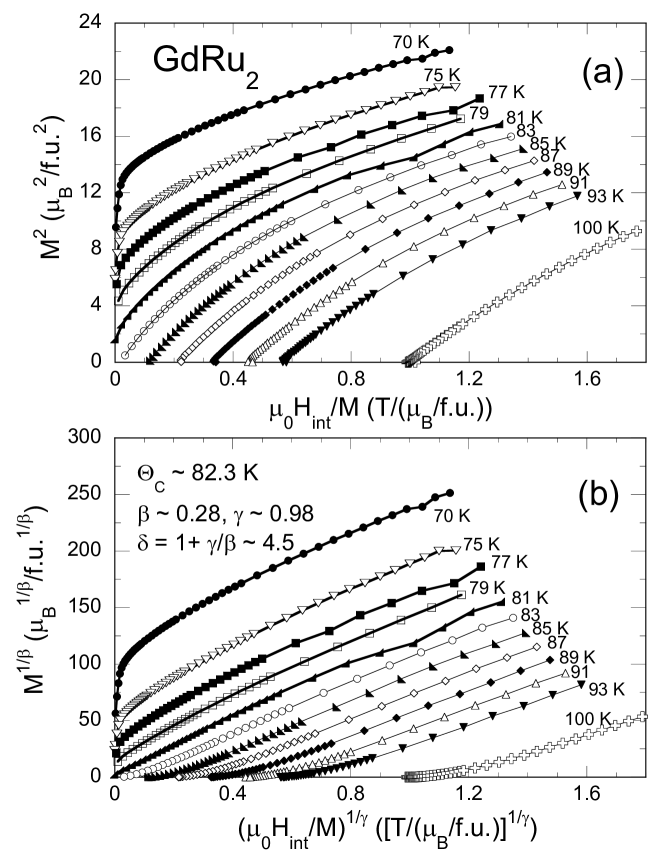

Figure 4(a) shows the specific heat of GdRu2 from 2 K to 300 K. As decreases to K, starts to rise and peaks at K, indicating the ferromagnetic second order phase transition. From the vs analysis between 7 K and 14 K (inset of Figure 4(b)), the values of the electronic specific coefficient and the Debye temperature of GdRu2 are estimated to be 29 mJ/mol-K, and 200 K, which seem reasonable in comparison with LaRu2’s mJ/mol-K and K. Gschneider1972 After subtraction of electron and phonon contributions from C(T) (Fig. 4(a)), the temperature dependence of the estimated magnetic entropy is displayed in Fig 4(b). Estimated reaches a saturated value of 1.5 R above TC which is lower than the expected value of Rln8 ( 2R). This could be due to a temperature dependent of GdRu2 or our overestimate for the phonon contribution to the specific heat.
A HoRu2 sample was synthesized so that magnetic order could also be investigated using neutron diffraction. Gd has a large cross-section for neutron capture which makes investigations of GdRu2 with neutron diffraction impractical.
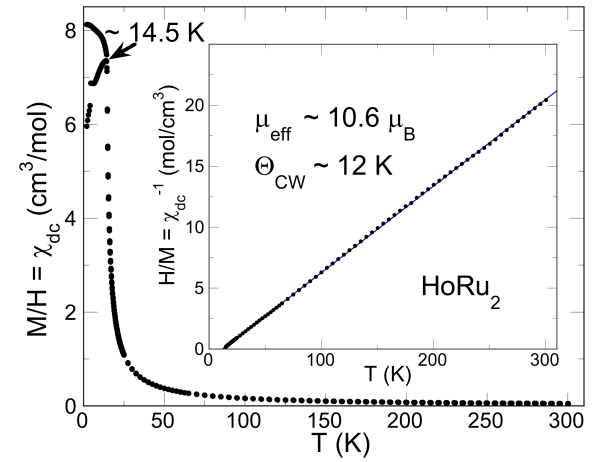
Measurements of , performed on HoRu2 at = 100 Oe and from 2 K to 300 K in the ZFC and FC conditions, are displayed in Fig. 5. Hysteresis in occurs at K. The Curie-Weiss analysis (shown in the inset of Fig. 5) indicates a ferromagnetic transition takes place near K in HoRu2 with a , which agrees with the theoretical value 10.6 of the free ion moment of Ho3+. An interesting feature in the ZFC data of HoRu2 is that there is a drop of the values at 2 K compared to the value at 14.5 K (similarly a drop in the ZFC of GdRu2, Fig. 2).
High resolution powder diffraction data were collected at the NCNR on the BT-1 high-resolution neutron powder diffractometer, using monochromatic neutrons of wavelength 1.5403Å produced by a Cu(311) monochromator. Söller collimations before and after the monochromator and after the sample were 15′, 20′, and 7′ full-width-at-half-maximum (FWHM), respectively. Data were collected in the range of 3o to 168o with a step size of 0.05o at 25K and 5K, above and below the magnetic phase transition. Structural refinements were carried out using the GSAS program.Larson1990
| Atom | x | y | z | B(Å2) | Mx() | Mz() | M() |
|---|---|---|---|---|---|---|---|
| Ho | 1/3 | 2/3 | 0.0664(2) | 0.36(3) | |||
| 1/3 | 2/3 | 0.0660(2) | 0.03(3) | 6.70(8) | 4.3(1) | 7.98(8) | |
| Ru1 | 0 | 0 | 0 | 0.39(3) | |||
| 0 | 0 | 0 | 0.22(3) | ||||
| Ru2 | 0.1704(2) | 0.3407(2) | 3/4 | 0.39(3) | |||
| 0.1711(2) | 0.3422(4) | 3/4 | 0.22(3) |
Rp=6.16%, wRp=7.34%, =0.8387
7.12 9.02 1.428
Detailed temperature dependent measurements of the magnetic order parameter were carried out on the BT9 triple axis spectrometer. A pyrolytic graphite (PG) (002) monochromator was employed to provide neutrons of wavelength 2.36 Å, and a PG filter was used to suppress higher-order wavelength contaminations. Coarse collimations of 40′, 48′, and 40′ FWHM on BT9 were employed to maximize the intensity. A PG(002) energy analyzer was used in these measurements. Inelastic measurements were taken with a fixed final energy of 14.7 meV.
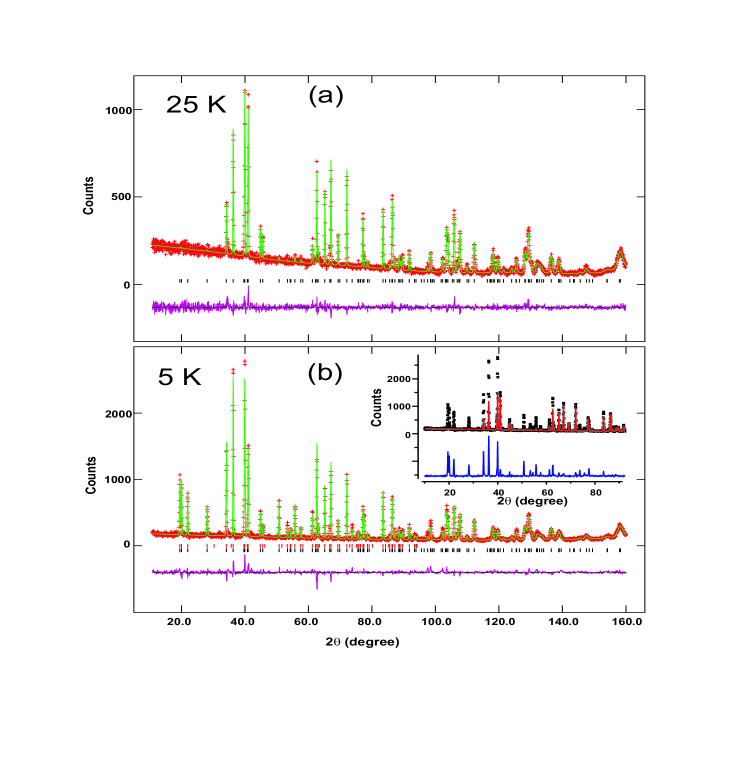
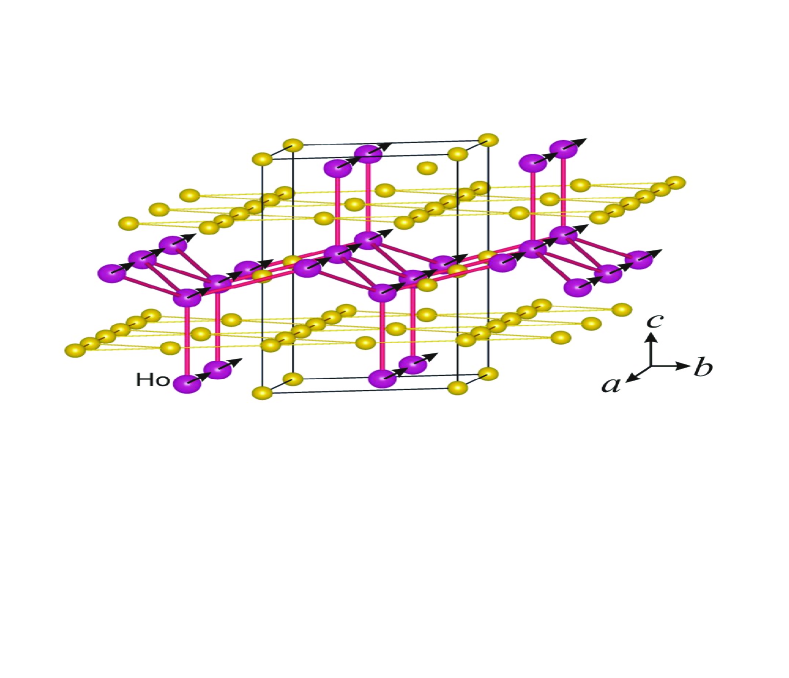
Fig. 6 shows the diffraction pattern obtained above (25K) and below (4 K) the magnetic transition. The diffuse “background” scattering in the magnetically disordered state is due to paramagnetic scattering of the uncorrelated Ho moments, which decreases with increasing angle due to the magnetic form factor. The overall refinement fits at both temperatures are excellent. The structure is found to deviate slightly from the ideal phase, and the refined values for the crystal structure are given in Table 1. In the ground state the Ho ions exhibit long range ferromagnetic order, with both in-plane and c-axis components of the ordered moment also given in Table 1. We find an ordered moment of 7.98(8), which is in good agreement with the low temperature magnetization data of AndohAndoh1987 and somewhat smaller than the Curie-Weiss value obtained from the magnetization measurements. No evidence was found for moments on the Ru sites. The crystal and magnetic structures are shown in Fig. 7.
.
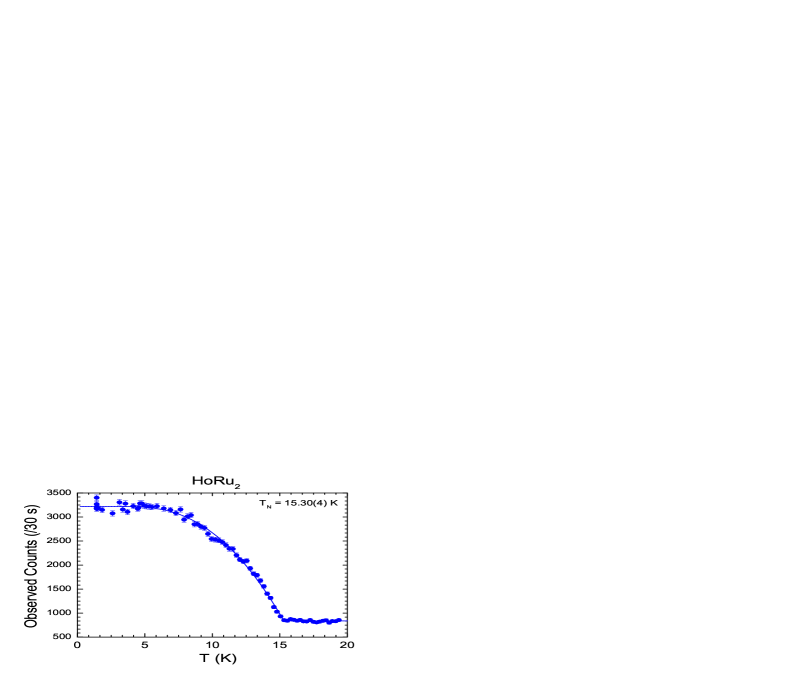
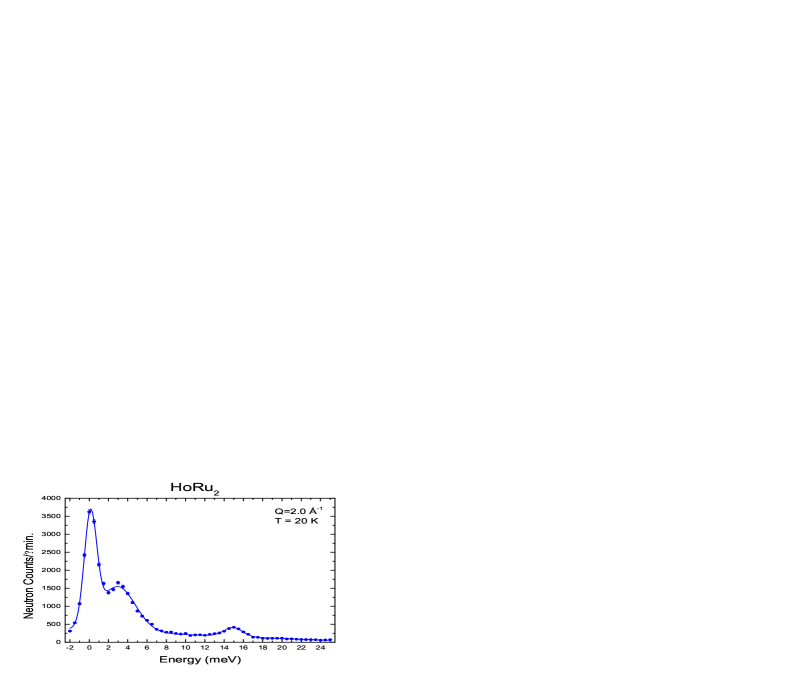
The temperature dependence of the magnetic Bragg intensity, which is proportional to the square of the ordered magnetic moment, is shown in Fig. 8. The temperature dependence is typical for magnetic ordering, and the solid curve is a least-squares fit of the intensity to a mean field order parameter, which provides a good fit to the data with a Curie temperature of 15.30(4) K. The diffraction data indicate that the ordered moment is reduced from the free-ion value of 10.0, which suggests that crystal field effects are important in this system. We therefore carried out inelastic neutron scattering measurements on BT-7 for several temperatures and wave vectors to search for crystal field excitations. Figure 9 shows a scan above the phase transition, at a temperature of 20 K. We see two clear excitations from the crystal field ground state, a strong one at 2.83(5) meV and a weaker excitation at 14.82(5) meV. The energies and intensities turn out to be quite similar to the Ho crystal field levels observed in the closely related Ce1-xHoxRu2 system for smaller Lynn1979 ; Lynn1980 , which has the cubic C-15 Laves structure. The rare earth site symmetry in the CeRu2 case is cubic, , and the crystal field level scheme has been worked out in detail. For hexagonal HoRu2 the site symmetry is lower, , but the crystal field levels look remarkably similar nevertheless. The width for the higher energy level is limited by the instrumental resolution, while the level at 2.83 meV has an observed full-width-at-half-maximum (FWHM) of 4.34(12) meV, which is much broader than the resolution of 1.5 meV. The width likely originates from exchange broadening. We note that both excitations are clearly magnetic in origin, as their intensity decreases with increasing wave vector, following the magnetic form factor dependence, and they decrease in intensity with increasing temperature as the ground state occupancy is depleted.
All the thermodynamic, transport, neutron diffraction measurements clearly demonstrate that ferromagnetic order develops in GdRu2 below 83 K and in HoRu2 below 15 K.
II.2 99Ru Mössbauer Spectra
Details of the source preparation of 99Rh(Ru), velocity calibration, and the experimental setup for transmission spectroscopy are discussed in previous papersDeMarco2000 ; Coffey2008 The sample of CeRu2 was made with natural Ru and contained 100mg/cm2 of Ru. Samples of GdRu2, HoRu2, and CexGd1-xRu2 were prepared with enriched 99Ru(95%). Typical samples contained about 65mg/cm2 of 99Ru. This made it possible to measure well-resolved spectra up to 150K. In the analysis of the spectra the number of inequivalent Ru sites is different in these materials. There is one type of Ru site in the unit cell of the cubic laves structure (CeRu2), whereas there are two inequivalent Ru sites whose relative abundance is 1 to 3, in the hexagonal Laves structure (GdRu2 and HoRu2).
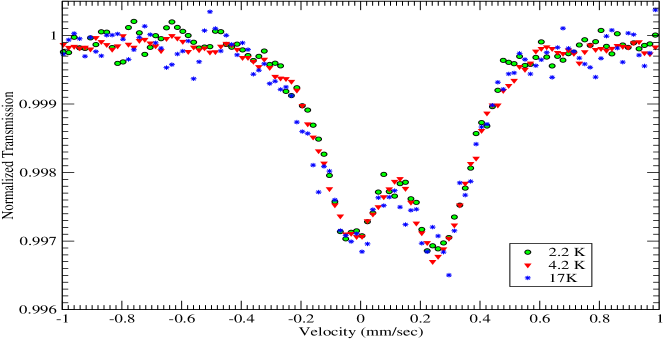
CeRu2 is a superconductor with a transition temperature, TSC, of 6K. As the Gd content of CexGd1-xRu2 increases with , TSC falls and goes to zero at . Previous authors have suggested that superconductivity and ferromagnetism could coexist close to this doping level. The spectrum of Ce0.88Gd0.12Ru2 at 2.2 K, 4.2 K and 17K is shown in Fig. 10. Extrapolating the data of Wilhelm and HillebrandWilhelm1971 gives values for TSC and TC both 4 K. There is no evidence in the temperature independent spectra for a hyperfine magnetic field, suggesting that ferromagnetism is ruled out at this doping. However, as doping with Gd increases, the low temperature phase is known to be ferromagnetically ordered and at one would expect to see an eighteen line magnetic spectrum at 4.2 K due to a large value of field at the Ru site. Instead Fig. 11 shows a quadrupole spectrum which is somewhat more asymmetric than at =0.88 due to the increased Gd content. The absence of hyperfine magnetic field even in this sample suggests that the spectra of Ce0.88Gd0.12Ru2 do not rule out the coexistence of magnetism and superconductivity.
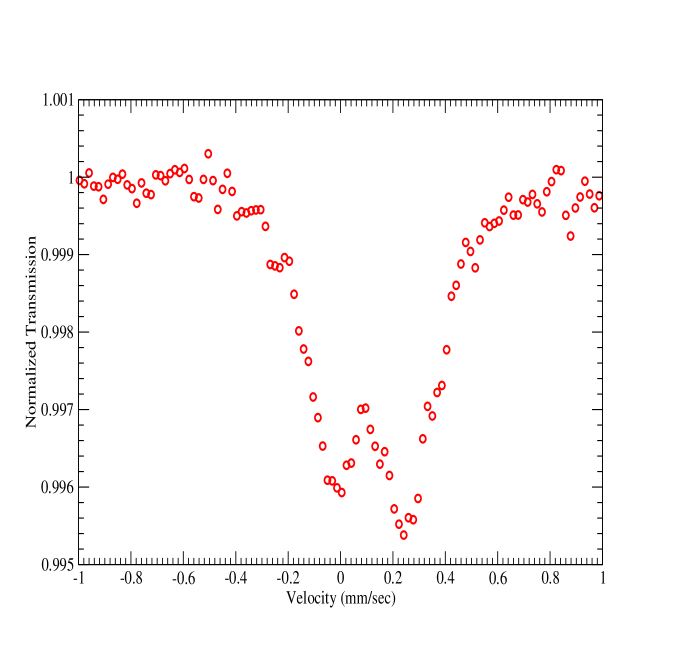
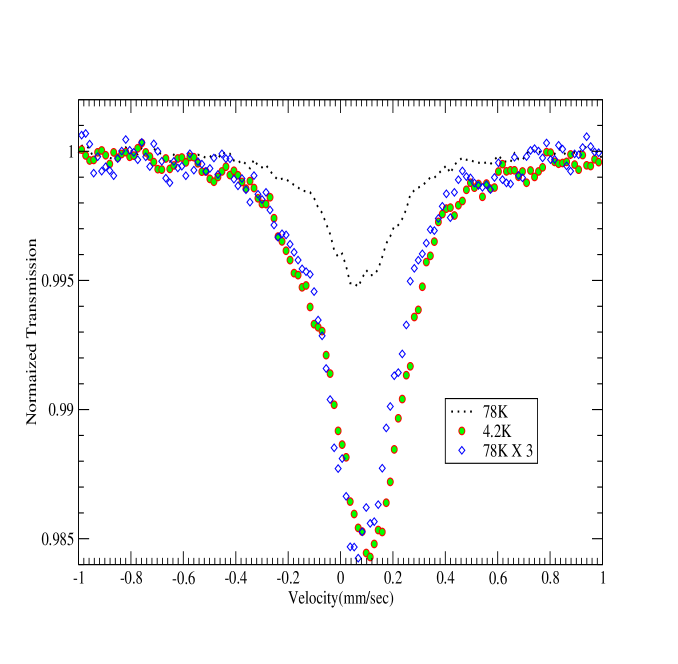
The Mössbauer spectrum for GdRu2 is an almost temperature independent single peak between 4.2 K and 101 K except for a shift toward more positive velocities. This is shown in Fig. 12 for 4.2 K and 78 K, where the 78K spectrum is scaled by 3 to compensate for the temperature dependence of the recoil free fraction so that a direct comparison can be made with the 4.2 K spectrum. The experimental FWHM of the spectrum is slightly broader than that of Ru powder (0.25 mm/s). The width of the spectrum is unchanged with temperature. This is also the case for the spectra at 89 K and 101 K (not shown). Contrary to the transport, magnetic, and thermodynamic data on the same sample presented in the previous section, there is no evidence of a transferred hyperfine field at the Ru sites due to magnetic order on the Gd sites.
The same apparent discrepancy between the Mössbauer spectrum and the experiments discussed above is seen in HoRu2. The spectrum of HoRu2 at 4.2 K is similar to that of GdRu2. It is a single peak with no evidence of splitting due to a hyperfine magnetic field even though the temperature is far below the sample’s Curie temperature, 15.3K. In order to get a more detailed picture of the properties of these materials we examined their electronic structure using ab initio calculations.
III Electronic Structure
The lattice parameters and structure used in the calculations are those given by Compton and MatthiasCompton1959 for CeRu2 and by the results of the neutron diffraction measurements of HoRu2 at 5 K discussed. The lattice parameters and structure were measured by Compton and MatthiasCompton1959 for GdRu2 at room temperature. However, the lattice frequently expands below a ferromagnetic transition in rare earth intermetallic compoundsOhta1995 . So we determined lattice constants for GdRu2 at low temperatures by scaling the lattice constants given by Compton and Matthias and found that the total energy was minimised when their values were increased by %.
III.1 Density of States and Magnetic Order
The absence of the expected large splitting in the Mössbauer spectra in GdRu2 and HoRu2 points to a very small values of given that the materials are ferromagnetically ordered. This is completely different from the ruthenates where the dependence of the Mössbauer spectra reflect the internal ordered field.DeMarco2000 ; Coffey2008 In particular, SrRuO3 orders ferromagnetically at 163 K and the value of is found to be 33 T at 4.2 K.
We have calculated the electronic structure and the values of at the Ru and lanthanide sites using the Wien2k software packagewien2k . These calculations use the LSDA, which is implemented using an extension of the augmented plane wave(APW) method. Up to 729 inequivalent points were used in the P63/mmc structure and RKMAX was set at 8 to ensure convergence. The energy and charge convergence variables were Rydbergs and . In each region a wavefunction basis set is chosen to optimize the calculation. The spin on each site, S, is the net electronic spin polarization in the sphere surrounding that site.
The calculated contributions to the densities of states in CeRu2, GdRu2, and HoRu2 show that the -bands are narrow in each case, pointing to predominantly localized states. In CeRu2 the calculated ground state is paramagnetic and the f-band is mostly above the Fermi energy, with small weight at EF so that the f electrons also contribute to the conduction band. This is in agreement with the earlier ab initio calculations of YanaseYanase1986 and Higuchi and HasegawaHiguchi1996 and with experiment.
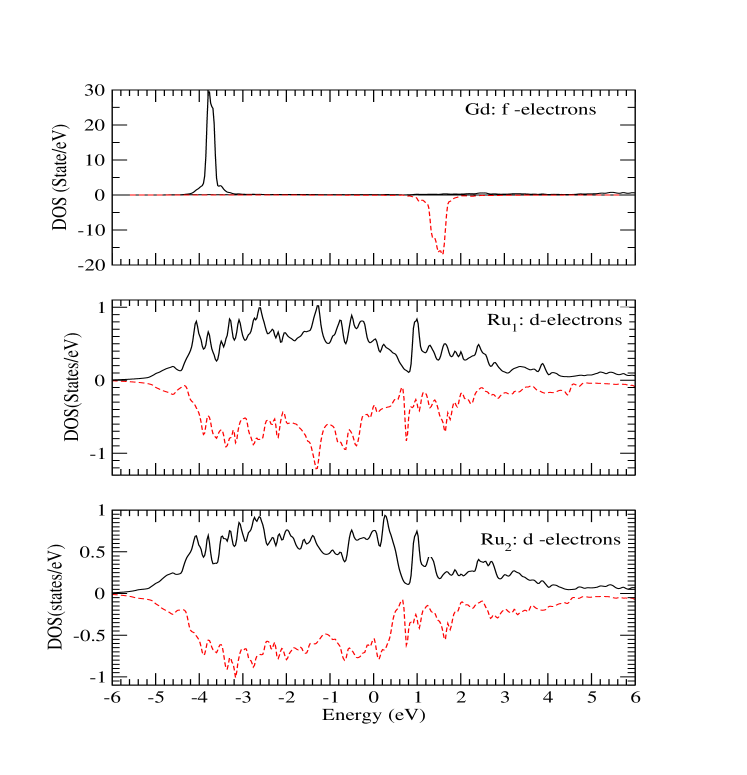
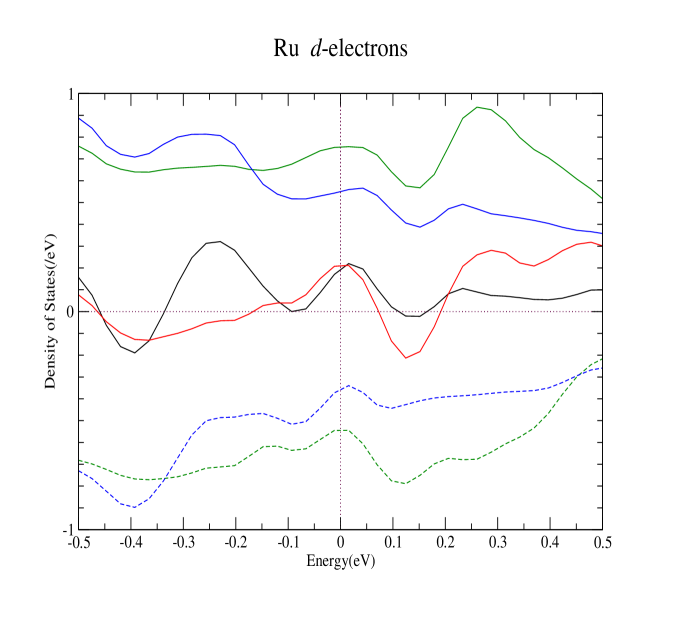
The calculated contributions to the density of states of GdRu2 from the Gd 4 band and from the 4 bands associated with the two inequivalent Ru sites sites are shown in Fig. 13. The Gd spin up f-band is 4 eV below the Fermi level and spin down f-band is 1.5 eV above. The calculated value of net spin, S, on the Gd sites is 3.46 which is very close to the Hund’s rule result for Gd, , and to the result of the Curie-Weiss fit to the magnetic susceptibility. The calculated values of S at the two inequivalent Ru sites in GdRu2 are very small, -0.06 and -0.09. The bottom two panels in Fig. 13 show the contributions to the density of states from Ru 4 electrons at the two inequivalent Ru sites. is the contribution for states with spin parallel to the moment of the Gd site and is positive, and the contribution from spin down, , is negative for each of the inequivalent Ru two sites. At the Fermi energy the density of states is dominated by the Ru 4 electrons, which form broad conduction bands. The contributions from Ru 4-electrons, and , and are plotted in Fig. 14 in the energy range which is 0.1 eV on either side of the Fermi energy, EF=0. It is seen that the -electrons from both Ru sites are polarized parallel to the Gd moment with 0.2 for each band arising from the two inequivalent Ru sites. The total Ru density of states 1.0 (eVRu)-1 at E=EF.
On the other hand the Gd -electrons have negligible weight at EF, 0.02 (eVGd)-1 and are unpolarized. This is also the case for Ru -electrons. This suggests that Ru -electrons mediate the interaction between localized Gd -moments. In HoRu2, the Ru 4 Ru electrons play the same role but the minority spin band is at the Fermi energy so that it is partially occupied.
In HoRu2, the value of S at the Ho site is 1.82. This value of S is slightly lower than 2, the value consistent with the effective moment given by the fit to magnetic susceptibility, as determined by Hund’s Rules. The absence of moments on the Ru sites in HoRu2, S0, is consistent with the neutron diffraction data.
According to these results, the magnetic properties can be described by a model in which localized Gd or Ho -moments couple to itinerant Ru -electrons, rather than to itinerant electronsDunlap1973 .
III.2 Hyperfine Magnetic Fields and Electric Field Gradients
Bhyperfine at a given site has a number of contributions which have been derived with relativistic corrections by Blügel et al.Blugel1987 and can be calculated directly using the Wien2k packageNovak2006 . These contributions are Bcon=Bcore+Bvalence, the Fermi contact term, Bdip, the dipolar field from the on-site spin density, Borb, the field associated with the on-site orbital moment, and Blat , the classical dipolar field from all other atoms in the system carrying moments. Bcore is the contribution due to polarization of core electrons and Bvalence is the contribution from the polarization of the valence or conduction band electrons. These are by far the largest contributions. Powder samples are used in the experiments with small crystallites so that each Ru nucleus sees the average of a collection of randomly orientated dipolar fields which presumably sum to zero. Therefore, we take Blat to be zero in the current analysis.
The calculated Bhyperfine and local moments at the Ce and Ru sites in CeRu2 are essentially zero, consistent with the absence of magnetic order. The calculated contributions to Bhyperfine are shown in Table 2 for GdRu2 and in Table 3 for HoRu2. The values of Bhyperfine at the Ru sites are surprisingly small compared to that at the rare earth sites in both compounds, consistent with the Mössbauer data. By comparison, the transferred hyperfine field at the Ir site in Ir0.01Fe0.99 is 14.3 T compared to 32 T at the Fe siteAtzmony1967 . The different contributions to Bhyperfine on the Ru sites are all small, leading to modest values for Bhyperfine. The values of Bhyperfine at the Ru nuclei are sensitive to the value of the lattice constants. In order to determine the lattice constants for GdRu2 at low temperature, the electronic properties were calculated for values of the lattice constants given by Compton and MatthiasCompton1959 scaled by a common factor, , from 0.995 to 1.05. Although the value of the net spin on the Gd site did not change for this range of lattice constants, the hyperfine magnetic fields at the Ru sites varied from -4.49 T at to 0.1 T at . The lowest total energy for a formula unit occurs at and the values for GdRu2 are calculated with this . From Table 2, Bhyperfine at both Ru sites is negative, as one would expect from transferred hyperfine fieldsWatson1961a ; Watson1961b .
| S | Bcore | Bvalence | Borb | Bdip | Bhyperfine | |
|---|---|---|---|---|---|---|
| Gd | 3.46 | 334.55 | -285.51 | -2.88 | -.29 | 49.05 |
| Ru1 | -0.06 | -4.83 | 0.63 | -.08 | 0.01 | -4.20 |
| Ru2 | -0.09 | -3.78 | 1.06 | -.0.20 | 0.05 | -2.72 |
| S | Bcore | Bvalence | Borb | Bdip | Bhyperfine | |
|---|---|---|---|---|---|---|
| Ho | 1.82 | 179.32 | -161.31 | 38.72 | -.41 | 56.34 |
| Ru1 | 0.028 | -1.63 | -0.26 | -0.02 | 0.01 | -1.90 |
| Ru2 | -0.009 | -2.61 | 0.69 | -0.75 | -0.070 | -2.74 |
| Ce | (0.,0.,0.) | Gd | (-1.40,-1.40,2.79) | Ho | (-1.34,-1.34,2.68) | ||
| Ru | (2.80,2.80,-5.60) | Ru1 | (3.42,3.42,-6.83) | Ru1 | (3.85,3.85,-7.71) | ||
| Ru2 | (1.86,0.90,-2.76) | Ru2 | (1.30,0.90,-2.19) |
Examining the contributions to Bhyperfine on the rare earth site one sees that and are large and of opposite sign. This is again consistent with the original discussion of Watson and FreemanWatson1961a ; Watson1961b . The other contributions are negligible by comparison in GdRu2. However, in the HoRu2 site 40 T, is a substantial fraction of Bhyperfine on the Ho site due to the almost complete cancellation of the and . This difference in the value of at the Gd and Ho sites is a reflection of the difference in the orbital angular momentum quantum number, , on the Gd and Ho sites. Whereas Hunds’ rules give on the Gd site because of the half-filled 4 shell, they give on the Ho site.
The calculated components of the EFG tensor for CeRu2, GdRu2, and HoRu2 are given in Table 3. Since the Ce site symmetry is cubic the electric field gradient is zero. The components of the EFG at the Ru site, Vxx=Vyy=2.801021Vm-2, are small compared to those in RuO2Kistner1966 , which also has a pure quadrupole spectrum, suggesting that the Ru sites have almost cubic symmetry. In GdRu2 and HoRu2, the EFG are different at the two inequivalent Ru sites. Again the magnitude of the components of the EFG suggests that there is almost cubic symmetry at these sites.
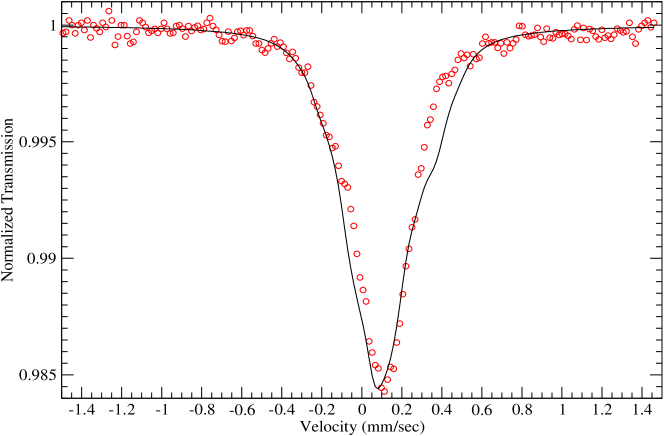
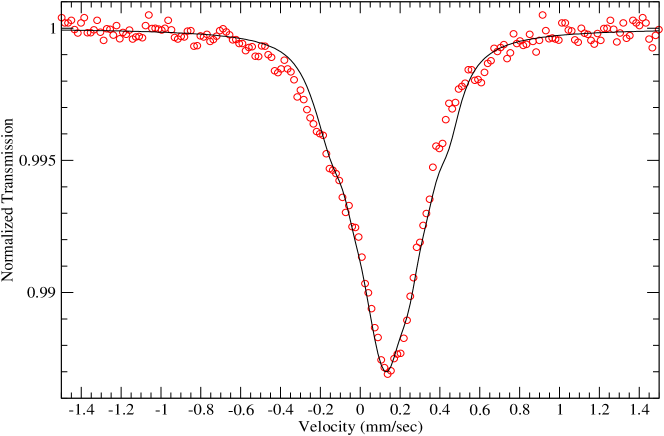
The Mössbauer spectra for these materials can now be almost completely determined with these calculated hyperfine magnetic fields and electric field gradients. The additional parameters are the half-width half-maximum, , of the absorption lines and the isomer shifts at the Ru sites. These are choosen to fit the data. The GdRu2 spectrum at 4.2 K is shown in Figure 15 and that of HoRu2 in Figure 16. The line through the spectrum is determined by the EFG tensor and values of at the two inequivalent Ru sites calculated with the parameters in Table 1, Table 2, and Table 3. The non-Lorenzian shape is due to the calculated difference in the EFG’s at the two sites.
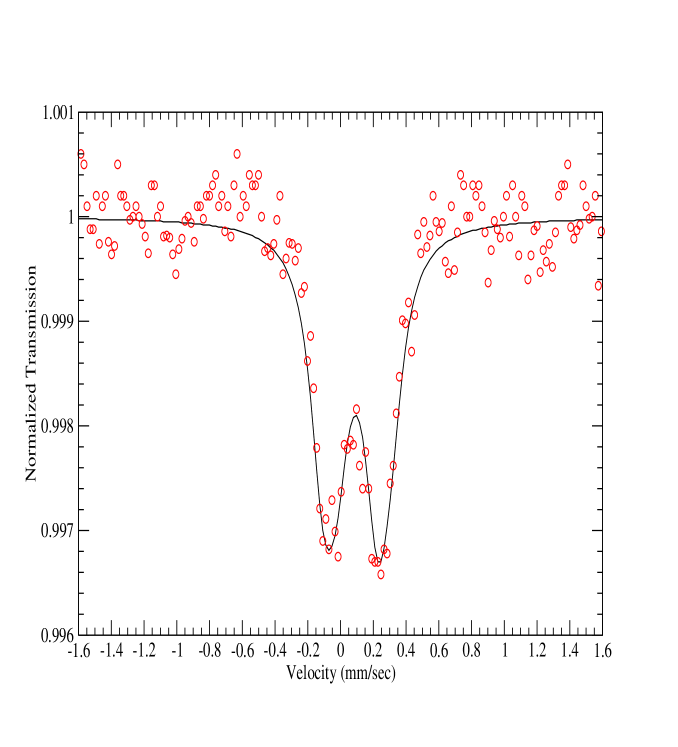
In Figure 17 we show the Mössbauer spectrum of CeRu2 at the Ru site at 4.2 K. The full line is the spectrum determined with values of the electric field gradient tensor (EFG) at the Ru site in Table 3. Other parameters in these spectra are the isomer shift, IS=0.12 mm/sec, and the half-width of lines, =0.11 mm/sec.
The calculations discussed here have demonstrated that it is possible for transferred hyperfine magnetic fields at the Ru sites to be very small in these ferromagnetic materials and allow us to reconcile the apparent contradiction between the results of the 99Ru ME measurements and those of the transport, magnetic susceptibility, magnetization, and neutron diffraction experiments on GdRu2 and HoRu2.
IV Discussion
A basic assumption of using the 99Ru ME is that the spectrum reflects the electronic environment in the material and that magnetic order is reflected in an induced hyperfine field. However the transferred hyperfine magnetic fields in ferromagnetic GdRu2 and HoRu2 are so small that one would conclude that these materials do not have magnetic order. The calculated properties of these materials have shown how this apparent discrepancy between Mössbauer, the collapse of the hyperfine magnetic field, and results of neutron diffraction, magnetization, transport and specific measurements on the same samples arise. Analyzing the calculated contributions to , the net electronic spin, S, on the Gd and Ho in Tables 1 and 2 is roughly proportional to the magnitude of the largest contributions, and . This suggests that is on the Ru sites because S is on these sites. This arises because 4 Ru electrons form polarized conduction bands rather than localized moments. Consequently the 99Ru ME is misleading regarding magnetic order in the RRu2 intermetallics.
In contrast, moments in the magnetically ordered ruthenates are shared between Ru and O sitesSingh1996 ; Mazin1997 and the temperature dependence of magnetic order is reflected in determined from the Mössbauer spectra. The 2 orbitals of the six neighboring oxygen atoms in the RuO octahedra are strongly hybridized with Ru 4 electrons. A possibile explanation for the different behavior of Ru in the ruthenates and intermetallics lies in the difference in the electronegativities between Ru and O compared to that between Ru and rare earth atoms. The Pauling electronegativity of oxygen atoms is 3.44, which is larger than that of Ru(2.2)Mullally . In GdRu2 and HoRu2, the opposite is the case. For Gd and Ho, the electronegativity values are 1.1 to 1.25. As a result the rare-earth atoms lose their 5 and two 6 electrons which take on the character of Ru electrons. Competition for electrons between Ru atoms leads to the wide -bands seen in the bandstucture. The structure can be pictured as a lattice of positive Gd and Ru ions, with the 4 moments tightly-bound on the rare-earth sites as in the rare-earth metalsCoqblin1977 . The 4 derived conduction bands mediate the coupling between the rare earth moments rather than forming localized moments on the Ru sites.
There seem to be few other examples where hyperfine magnetic fields have not been induced by magnetic order. There is evidence for a collapse of in hexagonal close-packed (hcp) Fe, which is the stable phase at high pressures. Whereas there is evidence that this phase is antiferromagnetically ordered from Raman scattering, the six-line 57Fe Mössbauer spectrum disappears at the transition from bcc Fe to hcp Fe with increasing pressureCort1982 . was calculated by Seinle-Neumann et al.Neumann2004 also using the wien2k software. They found that there was almost complete cancellation of the large core and valence contributions to Bcon as the atomic volume was reduced, simulating increasing pressure. In determining the lattice constants for GdRu2 at low temperature, we also found that the sign of changed as the lattice constants were varied, although not at the values of interest. However, the contributions to Bhyperfine in GdRu2 and HoRu2 are less than 6 T due to the itinerant nature of the 4 electrons.
The results of this investigation point to the unsuspected sensitivity of a nuclear probe, such as the Mössbauer Effect, to the details of the electronic structure in magnetically ordered materials. The ab initio calculations provide a quantitative description of how the collapse of the hyperfine magnetic field at the Ru site arises. In doing so, it was shown that the Mössbauer spectrum can be a probe of bandstructure, as well as the local electronic environment.
V Acknowledgments
Work was supported by the USDOE(DE-FG02-03ER46064), by CCSA7669 at CSU-Fresno, and by USDOE(DE-GF02-04ER46105), and NSF(DMR0802478), at UCSD. D. C. wishes to thank Dr. M. D. Jones of the Center for Computational Research at the University of Buffalo for his help in using the Wien2k package.
References
- (1) V. B. Compton, and B. T. Matthias, Acta Cryst. 12, 651 (1959).
- (2) B. T. Matthias, H. Suhl, and E. Corenzwit, Phys. Rev. Lett. 1, 449 (1958).
- (3) M. Wilhelm and B. Hillebrand, Physica 55, 608 (1971).
- (4) K. Ruebenbauer, J. Fink, H. Schmidt, G. Czjek, and K. Tomala, Phys. Stat. Sol. 84, 611 (1977).
- (5) K. Kumagai, T. Matsuhira, and K. Asayama, J. Phys. Soc. Jpn 45, 422 (1978).
- (6) Ø. Fischer and M. Peter in Magnetism: A Treatise on Modern Theory and Materials, volume V, edited by H. Suhl (Academic Press, New York and London, 1973), page 327.
- (7) M. Peter, P. Donzé, Ø. Fischer, A. Junod, J. Ortelli, A. Treyvaud, E. Walker, M. Wilhelm and B. Hillenbrand, Helv. Phys. Acta 44, 345 (1971).
- (8) J. W. Lynn and C. J. Glinka, J. Mag. and Mag. Materials 14, 179 (1979).
- (9) J.W. Lynn, D. E. Moncton, L. Passell, and W. Thomlinson, Phys. Rev. B 21, 70 (1980).
- (10) J. O. Willis, D. J. Erickson, C. E. Olsen, and R. D. Taylor, Phys. Rev. 21, 79 (1980).
- (11) R. E. Watson and L. H. Bennett, Phys.Rev. B 15, 502 (1977).
- (12) Y. Andoh, J. Phys. Soc. Jpn 56, 4075 (1987).
- (13) A. Huxley, J. X. Boucherle, M. Bonnet, F. Bourdarot, I. Schustler, D. Caplan, E. Lelievre, N. Bernhoeft, P. Lejay, and B. Gillon, J. Phys. Condens. Matter 9, 4185 (1997).
- (14) P. I. Kripyakevich, V. F. Terekhova, O. S. Zarechnyuk, and I. V. Burov, Soviet-Crystallography 8, 268 (1963).
- (15) M. DeMarco, G. Cao, J. E. Crow, D. Coffey, S. Toorongian, M. Haka and J. Fridmann, Phys. Rev. B 62, 14297 (2000).
- (16) D. Coffey, M. DeMarco, B. Dabrowski, S. Kolesnik, S. Toorongian, and M. Haka, Phys. Rev. B 77, 214412 (2008).
- (17) G. K. Wertheim and J. H. Wernick, Phys. Rev. 125, 1937 (1962).
- (18) U. Atzmony, M. P. Dariel, E. R. Bauminger, D. Lebenbaum, I. Nowik, and S. Ofer, Phys. Rev. B 7, 4220 (1973).
- (19) H. de Graaf, R. C. Thiel, and K. H. J. Buschow, J. Phys. f: Met. Phys. 12 1239 (1982).
- (20) U. Atzmony, E. R. Bauminger, D. Lebenbaum, A. Mustchi, and S. Ofer, Phys. Rev. 163, 314 (1967).
- (21) D. Bosch, F. Pobell, and P. Kienle, Physics Letters 22, 262 (1966).
- (22) R. E. Watson and A. J. Freeman, Phys. Rev. Lett. 6, 277 (1961).
- (23) R. E. Watson and A. J. Freeman, Phys. Rev. 123, 2027 (1961).
- (24) B. D. Dunlap, I. Nowik, and P. M. Levy, Phys. Rev. B 7, 4232 (1973).
- (25) J. Callaway and C. S. Wang, Phys. Rev. B 16, 2095 (1977).
- (26) C. S. Wang and J. Callaway, Phys. Rev. B 15, 298 (1977).
- (27) O. C. Kistner, Phys. Rev. 144, 1022 (1966).
- (28) P. Blaha, K. Schwarz, G. K. H. Madsen, Kvasicka and J. Lutz, wien2k:Augmented Plane Wave + Local orbitals Program for Calculating Crystal Properties, (2001), (Technische Universität Wien, Wien, Austria).
- (29) P. E. Lippens, J. Olivier-Fourcade, and J. C. Jumas, Hyperfine Interactions 126, 137 (2000).
- (30) P. Blaha, K. Schwarz, W. Faber, and J. Luitz, Hyperfine Interactions 126, 389 (2000).
- (31) J. Belos̆ević-C̆avor, N. Novaković, B. Cekić, N. Ivanović, and M. Manasijević, J. Mag. Mag. Mat. 272-276, 762 (2004).
- (32) E. Pavarini and I. I. Mazin, Phys. Rev. B 74, 035115 (2006); Phys. Rev. B 76, 079901(E) (2007).
- (33) A. Arrott and J. E. Noakes, Phys. Rev. Lett. 19, 786 (1967).
- (34) R. R. Joseph, K. A. Gschneider, Jr., and D. C. Koskimaki, Phys. Rev. B 6, 3286 (1972).
- (35) A. C. Larson and R. B. Van Dreele, Los Alamos National Laboratory Report No. LAUR086-748, 1990 (unpublished).
- (36) S. Ohta, T. Kitai, and T. Kaneko, J. Phys.: Condens. Matter 7, 6809 (1995).
- (37) A. Yanase, J. Phys. f: Met. Phys. 16, 1501 (1986).
- (38) M. Higuchi and A. Hasegawa, J. Phys. Soc. Jpn, 65, 1302 (1996).
- (39) S. Blügel, H. Akai, R. Zeller, and P. H. Dederichs, Phys. Rev. B 35, 3271 (1987).
- (40) P. Novák, ”New Notes about Hyperfine Calculations”, www.wien2k.at/reg-user/textbooks.
- (41) D. J. Singh, J. Appl. Phys. 79, 4818 (1996).
- (42) I. I. Mazin and D. J. Singh, Phys. Rev. B 56, 2556 (1997).
- (43) J. Mullally, Struct. Bond. 66, 1 (1987): CRC Handbook of Chemistry and Physics, ed. D. R. Lide, (Taylor and Francis, London, 2005), 9-77.
- (44) B. Coqblin, ”The Electronic Structure of Rare-Earth Metals and Alloys: the Magnetic Heavy Rare-Earths”, (Academic Press, London, New York, San Francisco, 1977).
- (45) G. Cort, R. D. Taylor, and J. O. Willis, J. Appl. Phys. 53, 2064 (1982).
- (46) G. Steinle-Neumann, L. Stixrude and R. E. Cohen, PNAS 101, 33 (2004).