Diffusion and Velocity Auto-Correlation in Shearing Granular Media
Abstract
We perform numerical simulations to examine particle diffusion at steady shear in a model granular material in two dimensions at the jamming density and zero temperature. We confirm findings by others that the diffusion constant depends on shear rate as with , and set out to determine a relation between and other exponents that characterize the jamming transition. We then examine the the velocity auto-correlation function, note that it is governed by two processes with different time scales, and identify a new fundamental exponent, , that characterizes an algebraic decay of correlations with time.
pacs:
45.70.-n, 64.60.-iAs the volume fraction increases in zero-temperature collections of spherical particles with repulsive contact interaction, there is a transition from a liquid to an amorphous solid state—the jamming transition. It has been suggested that this transition is a critical phenomenon with universal critical exponents Liu and Nagel (1998) and the properties of this transition continues to be a very active field of research. Simulations at steady shearing have provided strong evidence that the behavior at the jamming density actually is a critical phenomenon Olsson and Teitel (2007); Hatano (2008), but questions still remain to what extent results and ideas from ordinary critical phenomena may be taken over to the study of jamming as well as the fundamental reason for the observered critical behavior.
In critical phenomena the behavior is governed by a diverging length scale and one expects that this should also be reflected in the time dependence of various quantities. One way to probe the time dependence is to measure the particle displacements and thereby the diffusion constant. Experiments suggest that the diffusion depends algebraic on the shear rate, , with Besseling et al. (2007); Möbius et al. (2009). Since this appears to be one more critical exponent, and one usually expects relations between different critical exponents, the existence of such a relation between and other exponents that characterize the jamming transition is an interesting question.
In this Letter we examine the velocity auto-correlation function in an attempt to understand the behavior of the diffusion constant. A careful study of this function at very low shear rates reveals that it has both an algebraic decay and an exponential cutoff. It futhermore turns out that these two processes are governed by two different time scales, with the exponential decay being related to the externally applied time scale whereas the remaining part—which we identify with an internal relaxation—is governed by a time scale .
Following O’Hern et al. O’Hern et al. (2003) we simulate frictionless soft disks in two dimensions using a Bi-dispersive mixture with equal numbers of disks with two different radii of ratio 1.4. Length is measured in units of the small particles (). With for the distance between the centers of two particles and the sum of their radii, the interaction between overlapping particles is
We use Lees-Edwards boundary conditions Evans and Morriss (1990) to introduce a time-dependent shear strain . With periodic boundary conditions on the coordinates and in an system, the position of particle in a box with strain is defined as . We simulate overdamped dynamics at zero temperature with the equation of motion Durian (1995),
The unit of time is . We take and . We integrate the equations of motion with the Heuns method, using a time step . As this must be considered rather large, we have checked carefully that simulations with half that time step gives the same results to a very high accuracy. The possibility to use such large time steps is linked to the simple dynamics, zero temperature, and our low shear rates.
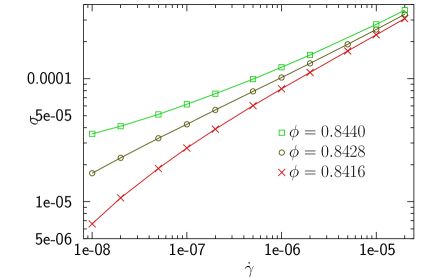
We study a system with many particles, , at , since the correlation length in the system should only depend on the finite shear rate and one therefore expects a simpler behavior. We have checked that our results are not affected by finite size effects. The behavior of the shear stress at three densities at and around is shown in Fig. 1. At , which is our candidate for , the shear stress is algebraic in the shear rate, with , whereas the data away from have clear curvatures. In the notation of Ref. Olsson and Teitel (2007), . We remark that the fit is not entirely perfect, in spite of the nice algebraic behavior in Fig. 1. This is the reason why the present estimate is somewhat higher than the estimate in Ref. Olsson and Teitel (2007). Our new data (which extends down to lower shear rates) also show that a high-precision determination of and the related exponents is a difficult task. This is due to some corrections to the expected scaling behavior, as will be discussed elsewhere. For the purpose of the present Letter the approximate value is, however, entirely sufficient.
We determine the diffusion constant from the transverse displacements, i.e. the displacements in the direction, and the velocity auto-correlation function from the component of the velocity,
where the average is over all particles and a large number of initial times, . Here and in the following, is the difference between two absolute times. The velocity auto-correlation function has been examined before Ono et al. (2003), but the present data with higher precision at lower shear rates makes it possible to do a more thorough analysis of its properties. The relation to the diffusion constant is given by the fundamental relation
| (1) |
where we introduce the normalized . It is convenient to write the expression in terms of both since it is the quantity that will be examined below and since the prefactor, , has a known behavior, , which follows from Ono et al. (2003).
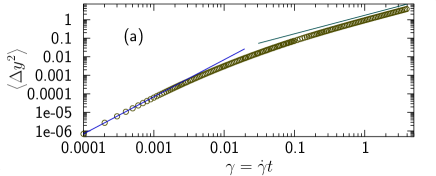
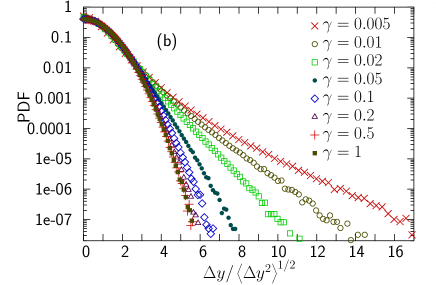
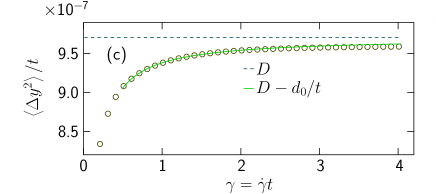
Some quantities related to the particle displacements are shown in Figs. 2. To make it easier to interpret the figures these quantities are plotted against (the strain increment), though we discuss the behavior in terms of . Panel (a) which shows against , illustrates the crossover from ballistic motion at short times to diffusion, . The probability distribution function (PDF) of (normalized by the width of the distribution), for several different strain increments, is shown in panel (b). The PDF crosses over from exponential behavior at short times (small ) to a Gaussian at longer times, as found by others Chaudhuri et al. (2007); Möbius et al. (2009). Our determination of the diffusion constant is illustrated in Fig. 2(c). As the figure shows it is difficult to determine from the long time limit of since this quantity approaches the constant value very slowly. The reason for this is a remainder of the short time behavior. For , where is the range of the velocity correlations (such that may be neglected for ; we choose , ), it is easy to show that the expression for the mean square distance is
| (2) |
with from Eq. (1) and . The solid line in Fig. 2(b) is from a fit to Eq. (2) with data from the interval . The dashed line is the estimated value of .
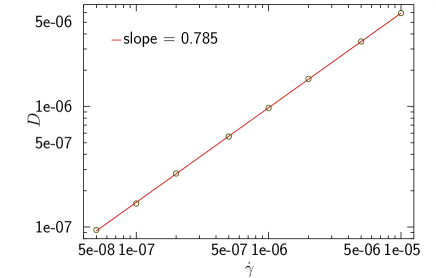
Figure 3 shows diffusion constant versus shear rate, determined with the same kind of fits. The behavior is , with . This implies that the distance moved per unit strain decreases with increasing shear rate Malandro and Lacks (1998). The corresponding exponents from experiments are from three dimensional colloids Besseling et al. (2007) and from bubble rafts Möbius et al. (2009). We note that the experiments on the colloids were performed at a density close to the jamming density whereas the bubble raft was studied well above . This is a possible reason why the value of in the colloids agrees well with our value obtained at .
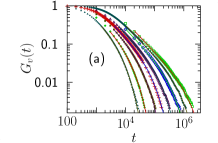
To examine this behavior we turn to the velocity auto-correlation function which is shown in Fig. 4(a) for a range of shear rates. The same data is shown also in panel (b), but now plotted against with a linear scale on the axis. From this figure it seems that at large behaves linearly with similar slopes for different , which suggests an exponential decay, . We take this to suggest that may be written
| (3) |
which means that is a product of an exponential decay governed by the externally imposed time scale and a function , which captures the internal relaxational dynamics.
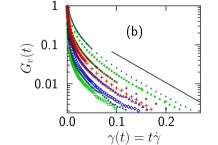
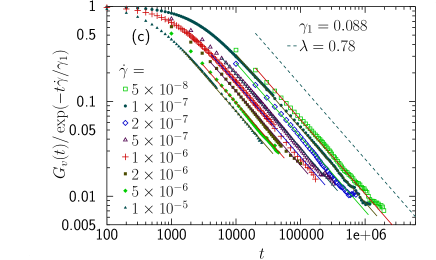
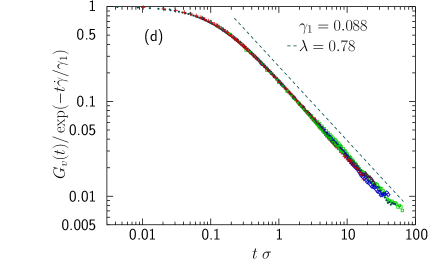
In the attempt to make sense of this data we found that a certain choice of in Eq. (3) leads to a great simplification. It turns out that is then a function of the combination ,
and, furthermore, that this function at large values of its argument behaves algebraically, , see Fig. 4(c). This defines a new fundamental exponent that characterizes the relaxation dynamics, , though—for the accessible shear rates—it is to some extent masked by the exponential decay. To get unbiased values for these parameters, we fitted all data in the range to
| (4) |
with , , , and as free parameters. We find , , and . The solid lines in Fig. 4(c) show for different .
In this expression, assumes the role of a characteristic time for the internal relaxation. The observation that has the dimension of inverse time together with the good numerical agreement between and (recall that ) suggests that can be substituted with such that the scaling function may be written . Panel (d) shows the collapse when plotting against the scaling variable . Note that is the only adjustable parameter in this plot.
We now like to determine the relation between and the exponents and that characterize the scaling of . In the first approximation we neglect the saturation of at small , and, in effect, assume that Eq. (4) holds down to . This gives
which leads to . This is the expected behavior as , but since it is derived from a simplified and the result is well above from Fig. 3, we next try to take the saturation of at small into account and write
Assuming that at (which holds to a good approximation up to our highest shear rate, ) the function is continuous at if . We then get
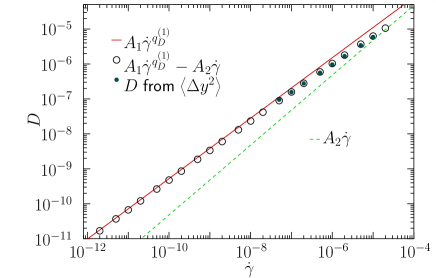
| (5) |
with and . As shown in Fig. 5 this expression (open circles) approaches (solid line) at small whereas there is an appreciable difference with a smaller slope at larger . The diffusion constant from Fig. 3 is shown as solid dots. Note that it agrees well with the open circles from Eq. (5). It therefore seems that the measured exponent is not the true asymptotic behavior.
A central conclusion from our analysis is that the full is approaching an algebraic behavior as . We now speculate that the algebraic behavior is related to the finding from quasistatic simulations that individual plastic events often are avalanches of elementary flips Maloney and Lemaître (2006); Lemaître and Caroli (2009); Goyon et al. (2008); Lerner and Procaccia (2009). The reason for making this connection is ideas from self-organized criticality—with the paradigmatic sandpile model—that a driven system can automatically adjust itself such that there are avalanches on all length and time scales, which would be seen through power laws. With a sufficiently low shear rate (say or ) there would be time for the avalanches to occur one at a time and evolve according to their own dynamics. At higher shear rates other effects appear that kill off the avalanches. One possible mechanism is that a new avalanche interferes with an existing one and thereby destroys its internal dynamics. Another possibility is that it is simply the shearing of the simulation box that destroys the correlations.
To conclude, we have found that the velocity auto-correlation function is governed by two different time scales. With from the externally applied shear rate and for the internal relaxation, the velocity auto-correlation function is , where for large and is a new fundamental exponent. This also leads to the desired expression for in terms of two fundamental exponents, . We speculate that this algebraic decay is related to avalanches of elementary flips, and could be a manifestation of self-organized criticality.
I thank P. Minnhagen and S. Teitel for helpful discussions. This work was supported by the Swedish Research Council and the High Performance Computer Center North.
References
- Liu and Nagel (1998) A. J. Liu and S. R. Nagel, Nature (London) 396, 21 (1998).
- Olsson and Teitel (2007) P. Olsson and S. Teitel, Phys. Rev. Lett. 99, 178001 (2007).
- Hatano (2008) T. Hatano, J. Phys. Soc. Japan 77, 132002 (2008).
- Besseling et al. (2007) R. Besseling, E. R. Weeks, A. B. Schofield, and W. C. K. Poon, Phys. Rev. Lett. 99, 028301 (2007).
- Möbius et al. (2009) M. E. Möbius, G. Katgert, and M. van Hecke (2009), arXiv:0810.4211.
- O’Hern et al. (2003) C. S. O’Hern, L. E. Silbert, A. J. Liu, and S. R. Nagel, Phys. Rev. E 68, 011306 (2003).
- Evans and Morriss (1990) D. J. Evans and G. P. Morriss, Statistical Mechanics of NonEquilibrium Liquids (Academic Press, London, 1990).
- Durian (1995) D. J. Durian, Phys. Rev. Lett. 75, 4780 (1995).
- Ono et al. (2003) I. K. Ono, S. Tewari, S. A. Langer, and A. J. Liu, Phys. Rev. E 67, 061503 (2003).
- Chaudhuri et al. (2007) P. Chaudhuri, L. Berthier, and W. Kob, Phys. Rev. Lett. 99, 060604 (2007).
- Malandro and Lacks (1998) D. L. Malandro and D. J. Lacks, Phys. Rev. Lett. 81, 5576 (1998).
- Maloney and Lemaître (2006) C. E. Maloney and A. Lemaître, Phys. Rev. E 74, 016118 (2006).
- Lemaître and Caroli (2009) A. Lemaître and C. Caroli, Phys. Rev. Lett. 103, 065501 (2009).
- Goyon et al. (2008) J. Goyon, A. Colin, G. Ovarlez, A. Ajdari, and L. Bocquet, Nature 454, 84 (2008).
- Lerner and Procaccia (2009) E. Lerner and I. Procaccia, Phys. Rev. E 79, 066109 (2009).