RE L3 X-ray absorption study of REO1-xFxFeAs (RE=La, Pr, Nd, Sm) oxypnictides
Abstract
Rare-earth L3-edge X-ray absorption near edge structure (XANES) spectroscopy has been used to study REOFeAs (RE=La, Pr, Nd, Sm) oxypnictides. The Nd L3 XANES due to 2p5d transition shows a substantial change in both white line (WL) spectral weight and the higher energy multiple scattering resonances with the partial substitution of O by F. A systematic change in the XANES features is seen due to varying lattice parameters with ionic radius of the rare earth. On the other hand, we hardly see any change across the structural phase transition. The results provide timely information on the local atomic correlations showing importance of local structural chemistry of the REO spacer layer and interlayer coupling in the competing superconductivity and itinerant striped magnetic phase of the oxypnictides.
pacs:
61.05 Cj;74.62 Bf;74.81 -g1 Introduction
Recently, the discovery of high temperature superconductivity in the Fe-based oxypnictides [1] has attracted wide attention from the condensed-matter community. The rare-earth (RE) oxypnictides (REOFeAs) have a layered structure, similar to the copper oxide superconductors and diborides, with electronically active (FeAs)δ- layers separated by the (REO)δ+ reservoirs. Both the charge transfer and the lattice misfit between the two sub-layers [2, 3] are important for the superconducting function of these materials similar to the case of cuprates [4, 5] and diborides [6]. The REOFeAs get superconducting with maximum transition temperature T 55 K [7, 8] when the active layers are doped through atomic substitutions or oxygen vacancies in the REO spacers. One of the interesting aspects of these materials is the competing spin density wave (SDW) and superconductivity [8, 9, 10, 11]. Indeed, the undoped compound REOFeAs is antiferromagnetically ordered (albeit a poor metal), however at the same time showing a structural phase transition from the tetragonal to the orthorhombic phase [12, 3, 13]. With doping the system gets superconducting and the structural transition as well as the SDW transition disappear [8, 14, 15, 16]. In addition, while the maximum Tc of the doped system increases with reducing the RE ion size [7, 17], the structural transition temperature (Ts) decreases for the undoped system [3]. This further underlines importance of local chemistry of the REO layers in the correlating itinerant magnetism and superconducting function of these materials.
It has been well known that RE L3 X-ray absorption near-edge structure (L3-XANES) spectroscopy is a direct probe of the local structure around a selected absorbing atom and distribution of the valence electrons, with the final states in the continuum being due to multiple scattering resonances of the photoelectron in a finite cluster [18]. Moreover, in an ordered structure, the focusing effects of atoms in collinear geometry determines multiple scattering resonances also in a large cluster of near neighbor atoms.Therefore the RE L3-XANES is an ideal tool to study local geometry around the RE and has often been applied to study the rare earth containing materials [19, 20, 21]. The added advantage of this technique lies in the fact that, unlike the photoemission experiments, there are negligible surface effects (and multiplet effects), making it a very useful finger print probe of unoccupied valence states and local chemistry of the absorbing atom.
Here we have exploited the RE L3-XANES spectroscopy to make a systematic study of the local geometry around the RE atom and the related electronic structure, measuring a series of REOFeAs (RE=La, Pr, Nd and Sm) with the varying rare earth size. We have also studied effect of tetragonal to orthorhombic structural phase transition as well the superconductivity on the RE L3 XANES. We find a systematic change in the L3-XANES spectra reflecting varying electronic and local geometrical structure of the title system. Incidentally the L3-XANES white lines hardly show any change across the tetragonal to orthorhombic structural phase transition temperature, however, a clear change is observed with the electron insertion by F-substitution. The results suggest that, in addition to the FeAs layers, structural coupling with the spacer layer should be important for the high Tc, recalling the recent debate on misfit strain [5, 4, 6] and out of plane disorder [22, 23, 24] controlling superconductivity in the copper oxide perovskites.
2 Experimental Details
RE L3-edge X-ray absorption near edge structure (L3-XANES) measurements were performed on powder samples of REOFeAs (RE=La, Pr, Nd, Sm) prepared using solid state reaction method [25]. Prior to the absorption measurements, the samples were characterized by x-ray diffraction for their structural properties [3]. The structural phase transition temperatures were measured to be 165 K, 155 K, 135 K and 130 K respectively for the La, Pr, Nd and Sm containing REOFeAs samples. The superconducting transition temperature for the F-doped NdO1-xFxFeAs is found to be 49 K [26]. The X-ray absorption measurements were made at the XAFS beamline of the Elettra Synchrotron Radiation Facility, Trieste, where the synchrotron radiation emitted by a bending magnet source was monochromatized using a double crystal Si(111) monochromator. The L3-XANES measurements were made at two temperatures (room temperature and 80 K) in the transmission mode using three ionization chambers mounted in series for simultaneous measurements on the sample and a reference. For the low temperature measurements, the samples were mounted on the liquid nitrogen cryostat cold finger enclosed in an Al shroud with a Be window. The sample temperature was measured to be 801 K for the low temperature measurements. As a routine experimental approach, several absorption scans were collected to ensure the reproducibility of the spectra, in addition to the high signal to noise ratio.
3 Results and Discussion
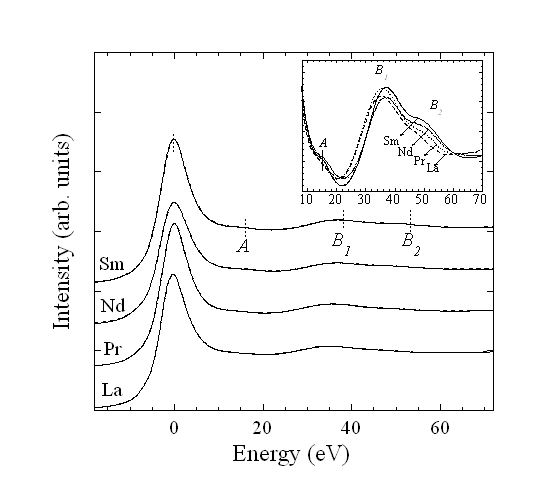
Figure 1 shows normalized RE-L3 spectra of REOFeAs (La, Pr, Nd, Sm) measured at room temperature showing an intense peak, the characteristic white line (WL) of RE3+. Here, the zero of the energy scale is fixed to the WL peak position for a proper comparison between the different spectra. It is worth recalling that the L3 absorption process is a 2p5d (or 2p6s) transition governed by the dipole selection rules (l = 1) and hence empty states with d or s symmetries (and admixed states) can be reached in the final state. Since the probability for a 2p6s transition is about two orders of magnitude lower than for a 2p5d transition, the earlier can be ignored for describing the L3 WL. The one-electron picture (i.e., all the orbitals not directly involved in the absorption process are passive in the final state) works well for the L3 WL unless or otherwise the materials of interest show phenomena as the mixed valence. In the present case, the WL appears to be a typical of RE3+ and hence the one electron picture could be fairly used to describe the spectra.
In addition to the intense WL, we can see different near edge features, a weak structure around 15 eV above the WL (feature A), and the continuum resonances appearing as a two peak structure (the broad features denoted by B1 and B2 appearing respectively around 35 eV and around 50 eV) due to the photoelectron scattering with the nearest neighbors. The RE atoms have 4 near neighbors O sitting at a distance 2.3 and 4 As atoms occupying a site at 3.3 , and hence the two peak structure of the continuum resonance is expected with the low and high energy peaks due to As and O scatterings respectively. The energy separation between the two is consistent with the E1/d2 relation for a continuum resonance [27]. Here it is worth referring Ignatov et al [28] reporting the La L3 -XANES on LaOFeAs with a typical La3+ WL and the continuum peak, however, with a limited discussion they have incorrectly assigned the continuum resonance Peak B1 to the La-O distance.
The feature A is very weak or absent for the La and Pr L3 -XANES while clearly visible for the Nd and Sm L3 cases (see e.g., the inset). The feature A has been frequently observed in the L3-XANES of the rare earths and discussed to be due to a particular local structural geometry of the RE [29]. Here the feature A is found to be absent (or very weak) in the La and Pr L3 spectra while clearly seen in the Nd and Sm L3 edges. The feature A is found to appear at the same energy. Indeed, the observation is consistent with the earlier [29, 30], albeit with dubious interpretation relating it to the local structure. Considering the fact that, the basic geometry of the RE is the same, it is difficult to rule out the feature A to have electronic origin or be related with disorder in the REO layer, however, detailed multiple scattering calculations should be performed for further clarification.
On the other hand, the continuum resonance Peak B1 and Peak B2 show a systematic change with the rare earth ion size (see e.g. the inset) indicating a clear evolution of local geometry around the RE. The Peak B1 and Peak B2 shift towards higher energy due to decreasing RE-As and RE-O distances with decreased rare earth size, consistent with the E1/d2 empirical rule [27]. It is interesting to note that, neither the WL nor the XANES features show any appreciable change across the tetragonal to orthorhombic structural transition temperature (dotted and solid lines in Fig. 1). Therefore, while the average symmetry measured by diffraction (long range ordered structure) changes, local atomic structure measured by the XANES hardly show any change except a thermal shrinkage of the lattice (Figure 2). On the other hand, negligible change in the WL intensity suggests that electronic structure of the unoccupied RE d-states (and admixed electronic states) remains the same in the two structural phases. This observation is consistent with the Fe K-edge XANES [31] study revealing hardly any change in the local structure across the structural phase transition in these materials. However, the Fe K-edge study has revealed a clear change in the 1s3d quadrupole transition (albeit small) across the structural phase transition. Thus, it is possible that the tetragonal-to-orthorhombic structure phase transition being induced by the electronic part due to the fact that the electronic sates near the Fermi surface are mainly of Fe 3d nature. However, more work is necessary to discuss the structural phase transition versus local structure by XANES, decorated by polarized data.
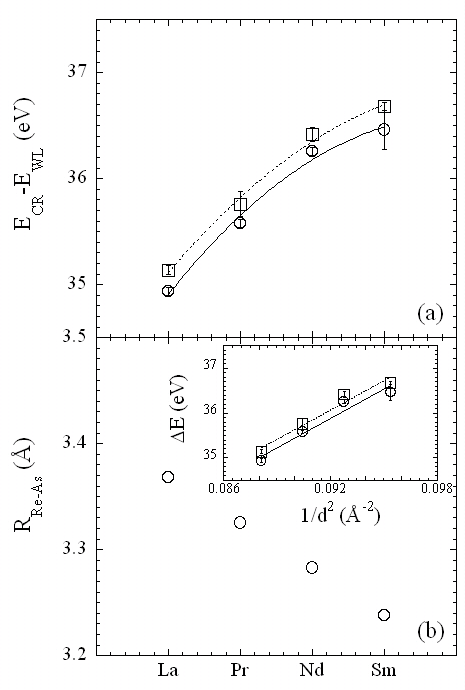
Figure 2 shows energy positions of the Peak B1 with respect to the WL (E) at two temperatures, showing a continuous increase with decreasing rare earth size due to decreased RE-As distance. The E at low temperature is slightly higher almost by same amount, suggesting an average but similar unit cell shrinkage for all the samples by lowering the temperature. We have also plotted the crystallographic RE-As distance at room temperature for a comparison (lower panel). The inset displays the E as a function 1/d2, showing an expected linear behavior [27].
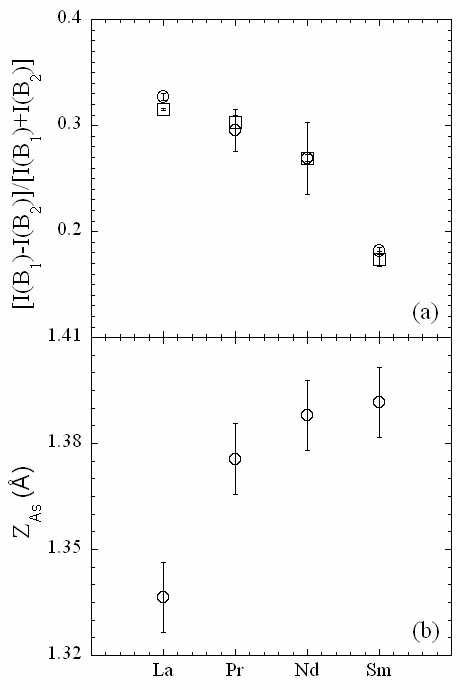
To get further information from the L3-XANES, we have extracted the line shape parameters for the WL as well as the Peak B1 and Peak B2. In the one-electron approximation the L3-XANES WL could be deconvoluted in a Lorentzian (core hole life time) convoluted by the experimental broadening providing 5d (and admixed) density of empty states weighted by the matrix element and the arctan curve to take into account the transition into the continuum. The energy positions are similar to what have been obtained by second derivative of the spectra (Fig. 2). All efforts were made to take care of experimental aspects influencing the L3-line shapes (thickness and homogeneity of the samples), however, it is not correct to consider equal transition matrix elements for all rare earths, therefore the absolute intensities can not be compared quantitatively as a function of the RE. Moreover, the absolute intensity of the WL does not show any appreciable or systematic change with the rare earth. On the other hand, the continuum resonance Peak B1 and Peak B2 intensities, probing the local geometry around the rare earth atom change systematically. The relative change in the intensity of the Peak B1 and Peak B2, defined as I=[I(B1)-I(B2)]/[I(B1)+I(B2)], is displayed in Figure 3 as a function of rare earth, showing a decrease with decreasing rare-earth size, revealing a systematic change of local geometry around the RE involving the As and O atoms (Peak B1 is due to RE-As while the Peak B2 is due to RE-O distance). Since the RE-As represents out of plane atomic correlation while the RE-O describes in-plane correlation, the decreasing I should reflect increased correlation between the RE-O layer and the Fe-As layer (i.e., increased interlayer coupling) with decreasing rare earth size. Although, it is difficult to quantify the atomic displacement pattern around the RE, the results seems to be consistent with the higher perpendicular position of the As atom with respect to the Fe-Fe plane (Fig. 3b) and decreased RE-As distance (Fig. 2b) with the decreasing rare earth size.
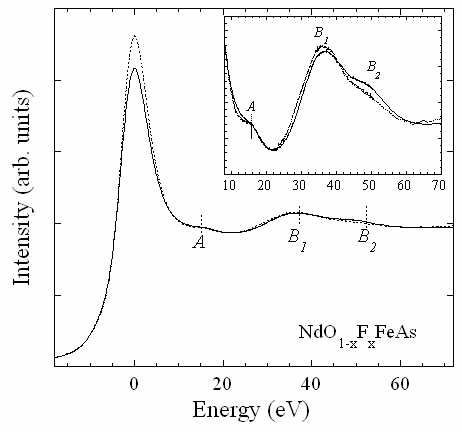
Let us tune to the effect of doping on the L3-XANES. To explore this, we have used NdOFeAs as a representative and measured Nd L3-XANES on the undoped and F-substituted system. Figure 4 shows the measured Nd L3-XANES at room temperature on the NdOFeAs and the superconducting NdO1-xFxFeAs system (T49 K). Both samples are in their tetragonal phase and hence the differences reflect the effect of F-substitution. The L3-edge WL intensity shows a significant increase with the F-doping, suggesting an increase of a localization of the RE empty d density of states [33]. In addition, a substantial change in the Peak B1 and Peak B2 can be seen (inset of Fig 4).
Recently Sun et al [34] have studied CeO1-xFxFeAs by Ce L3-XANES system as a function of external pressure revealing a drastic decrease of the WL intensity while the Tc decreases with increasing hydrostatic pressure. Incidentally, the results reported here show more intense Nd L3 WL for the superconducting system, and hence increased intensity (more atomic like character) of the L3 WL may be somehow related with the superconductivity. It is possible that the F-substitution in the NdOFeAs causes reduced hybridization between the Nd 5d and admixed 4f orbitals, similar to the 4f-supercondutors [35] in which the superconductivity gets suppressed with increased hybridization.
On the other hand, the Peak B1 seems to show different effect of F-doping. Indeed, Peak B1 and Peak B2 tend to merge (Peak B1 hardly show any shift while the Peak B2 appears at lower energy) The doping of F-induces an increase of Nd-O/F distance and hence the shift of the Peak B2 towards lower energy is reasonable. On the other hand, the diffraction data reveal shrinkage of the RE-As bonds, and hence a shift of the Peak B1 towards higher energy is expected, inconsistent with the present results. This may be due to the fact that diffraction tend to average local distortions and is less sensitive to localized structural distortions and possible nanoscale inhomogeneities[36, 37].
In summary, we have studied RE L3-XANES of the oxypnictides REOFeAs with variable rare-earth ion to explore the valence electronic structure as well as the local geometry of the RE-O slab. While the L3 white lines hardly show any change across the tetragonal to orthorhombic structural phase transition temperature, a clear change is observed in the spectral weight with the electron doping. In addition, the XANES features above the WL show a systematic change due to varying local geometry with the rare-earth size. The energy separation between the WL and the continuum resonances change consistently with a change of RE-As and RE-O distance due to changing misfit between the FeAs and REO sub-layers. A systematic change of the relative intensities of the continuum resonance features is also observed. Since the vertical position of the As atom change systematically with the rare earth size (As atom moves away from the Fe-Fe plane due to decreased Fe-As-Fe angle with decreasing rare earth size [32]), this has a direct influence on the local geometry of the REO slabs, as demonstrated by the XANES spectra. The results suggest that the inter-layer coupling between the Fe-As and the spacer (REO) layer may play a role also in the superconductivity mechanism of the REOFeAs. Thus, the outcome of this work recalls recent debate on the misfit strain [5, 4] and out of plane disorder controlled superconductivity in the copper oxide high Tc superconductors [22, 23, 24], bringing the two families on the same platform for the discussion. Although, it is difficult to argue on the cause or consequence of the local structural changes, and quantitative role of intra and interlayer coupling in the correlating itinerant magnetism and superconductivity, the present results certainly add a new experimental feed-back to understand the role of structure and local chemistry in fundamental properties of REOFeAs oxypnictides.
Acknowledgments
The authors thank the Elettra staff for the help and cooperation during the experimental run (proposal no. 20085317). We also acknowledge Zhong-Xian Zhao and Z.A. Ren (Beijing) for providing high quality samples for the present study. This research has been partially supported by the COMEPHS (FP6-STREP Controlling mesoscopic phase separation). One of us (BJ) would like to acknowledge the MIUR (Italy) for a fellowship under the Italy-India bilateral programme.
References
References
- [1] Y. Kamihara, T. Watanabe, M. Hirano, and H. Hosono, J. Am. Chem. Soc., 130, 3296 (2008).
- [2] A.Ricci, N. Poccia, G. Ciasca, M. Fratini, A. Bianconi, J. Supercond. Nov. Magn. 22, 589 (2009).
- [3] M. Fratini, R. Caivano, A. Puri, A. Ricci, Z.A. Ren, X.L Dong, J. Yang, W. Lu, Z.X. Zhao, L. Barba, G. Arrighetti, M. Polentarutti, A. Bianconi, Supercond. Sci. Technol. 21, 092002 (2008).
- [4] A. Bianconi, G. Bianconi, S. Caprara, D. Di Castro, H Oyanagi, N. L. Saini, J. Phys. : Condens. Matter, 12 10655 (2000); A. Bianconi, S. Agrestini, G. Bianconi, D. Di Castro, N.L. Saini, J. Alloys Compds., 317, 537 (2001); S. Agrestini, N. L. Saini, G. Bianconi, and A. Bianconi, Journal of Physics A: Mathematical and General 36, 9133 (2003).
- [5] N. Poccia and M. Fratini, J.Supercond. Nov. Magn. 22, 599 (2009).
- [6] S. Agrestini, D. D. Castro, M. Sansone, N. L. Saini, A. Saccone, S. D. Negri, M. Giovannini, M. Colapietro, and A. Bianconi, Journal of Physics: Condensed Matter 13, 11689 (2001),
- [7] Z.A. Ren, G.C. Che, X.L. Dong, J. Yang, W. Lu, W. Yi, X.L. Shen, Z.C. Li, L.L. Sun, F. Zhou and Z. X. Zhao, Europhys. Lett. 83 17002 (2008).
- [8] K. Ishida, Y. Nakai, and H. Hosono, J. Phys. Soc.Jpn. 78, 062001 (2009).
- [9] J. Zhao, Q. Huang, C. de la Cruz, S. Li, J. W. Lynn, Y. Chen, M. A. Green, G. F. Chen, G. Li, Z. Li, J. L. Luo, N. L. Wang and P. Dai, Nature Materials 7, 953 (2008).
- [10] Q. Huang, Jun Zhao, J. W. Lynn, G. F. Chen, J. L. Luo, N. L. Wang, P. Dai, Phys. Rev. B 78 054529 (2008)
- [11] Jun Zhao, Q. Huang, C. de la Cruz, J. W. Lynn, M. D. Lumsden, Z. A. Ren, Jie Yang, X. Shen, X. Dong, Z.X. Zhao, P. Dai, Phys. Rev. B 78 132504 (2008)
- [12] C. De la Cruz, Q. Huang, J.W. Lynn, J. Li, W. Ratcliff II, J.L. Zarestky, H.A. Mook, G.F. Chen, J.L. Luo, N.L. Wang, P. Dai, Nature 453, 899 (2008).
- [13] S. Margadonna, Y. Takabayashi, M. T. McDonald, M. Brunelli, G. Wu, R. H. Liu, X. H. Chen, K. Prassides, Phys. Rev. B 79, 014503 (2009); K. Kasperkiewicz, J.W. G. Bos, A. N. Fitch, K. Prassides, S. Margadonna, Chem. Commun., 707 (2009).
- [14] see e.g. special issue of J. Phys. Soc. Jpn. Suppl. 77 SC (2008).
- [15] see e.g., focus issue on iron based superconductors, New J Phys 11, 025003 (2009).
- [16] see e.g., a short review by Yu A Izyumov, E.Z. Kurmaev, Phys. Usp. 51 1261 (2008).
- [17] C.-H. Lee, A. Iyo, H. Eisaki, H. Kito, M.T. Fernanadez-Diaz, T. Ito, K. Kihou, H. Matsuhata, M. Braden, K. Yamada, J. Phys. Soc. of Japan 77, 083704 (2008); K. Miyazawa, K. Kihou, P. M. Shirage, C-H. Lee, H. Kito, H. Eisaki, and A. Iyo, J. Phys. Soc. of Japan, 78, 034712 (2009);C.-H. Lee, A. Iyo, H. Eisaki, H. Kito, M.T. Fernandez-diaz, R. Kumai, K. Miyazawa, K. Kihou, H. Matsuhata, M. Braden and K. Yamada, J. Phys. Soc. of Japan, 77, 44-46 (2008).
- [18] A. Bianconi, M. Dell’Ariccia, P. J. Durham and J. B. Pendry, Phys. Rev. B 26, 6502 (1982); EXAFS and Near Edge Structure edited by A. Bianconi, L. Incoccia, and S. Stipcich (Springer-Verlag, Berlin, 1982); A. Bianconi in X-ray Absorption: Principles, Applications, Techniques of EXAFS, SEXAFS, XANES, edited by R. Prinz and D. Koningsberger (Wiley, New York, 1988).
- [19] L. Journel, J.-M. Mariot, J.-P. Rueff, C. F. Hague, G. Krill, M. Nakazawa, A. Kotani, A. Rogalev, F. Wilhelm, J.-P. Kappler, and G. Schmerber, Phys. Rev. B 66, 045106 (2002) and references therein.
- [20] A. Bianconi, A. Marcelli, R. Karnatak, H. Dexpert, A. Kotani, T. Jo and J. Petiau, Phys. Rev. B 35, 806 (1987); J. Chaboy, J. Garcia and A. Marcelli, J. Magn. Magn. Mat. 166, 149 (1997).
- [21] L. Liu, B. Gao, W. Chu, D. Chen, T. Hu, C. Wang, L. Dunsch, A. Marcelli, Y. Luo and Z. Wu, Chem. Comm. 4, 474-476 (2008); K. Fukui, H. Ogasawara, A. Kotani, I. Harada, H. Maruyama, N. Kawamura, K. Kobayashi, J. Chaboy, A. Marcelli, Phys. Rev. B 64, 104405 (2001).
- [22] H. Eisaki, N. Kaneko, D. L. Feng, A. Damascelli, P. K. Mang, K. M. Shen, Z.-X. Shen, and M. Greven, Phys. Rev. B 69, 064512 (2004); K. Fujita, T. Noda, K. M. Kojima, H. Eisaki, and S. Uchida: Phys. Rev. Lett. 95, 097006 (2005).
- [23] C. Sun, H. Yang, Lu Cheng, J. Wang, X. Xu, S. Ke, and L. Cao Phys. Rev. B 78 104518 (2008)
- [24] H. Hobou, S. Ishida, K. Fujita, M. Ishikado, K. M. Kojima, H. Eisaki, and S. Uchida Phys. Rev. B 79 064507 (2009).
- [25] Z-A. Ren, J. Yang, W. Lu, W. Yi, X-L. Shen, Z-C. Li, G-C. Che, X-L. Dong, L.L. Sun, F. Zhou, and Z.X. Zhao, Europhys. Lett. 82, 57002 (2008).
- [26] D. Di Gioacchino, A. Marcelli, S. Zhang, M. Fratini, N. Poccia, A. Ricci, and A. Bianconi, J. Supercond. Nov. Mag. 22, 549-552 (2009).
- [27] A. Bianconi, M. Dell’Ariccia, A. Gargano and C.R. Natoli in EXAFS and Near Edge Structure, Editors. A. Bianconi, L. Incoccia, S. Stipcich, Springer-Verlag (Berlin, 1983) pp. 57; A. Bianconi, E. Fritsch, G. Calas, and J. Petiau, Phys. Rev. B 32, 4292 (1985).
- [28] A.Ignatov, C. L. Zhang, M. Vannucci, M. Croft, T. A. Tyson, D. Kwok, Z. Qin, S.-W. Cheong, arXiv:0808.2134.
- [29] Z. Tan, M. E. Filipkowski, J. I. Budnick, E. K. Heller, D. L. Brewe, B. L. Chamberland, C. E. Bouldin, J. C. Woicik, and D. Shi, Phys. Rev. Lett., 64, 2715 (1990); Z. Tan, J. I. Budnick, W. Q. Chen, D. L. Brewe, S-W. Cheong, A. S. Cooper, and L. W. Rupp, Phys. Rev. B 42, 4808 (1990); Z. Tan, J. I. Budnick, Sheng Luo, W. Q. Chen, S-W. Cheong, A. S. Cooper, P. C. Canfield, and Z. Fisk, Phys. Rev. B 44, 7008 (1991); Z. Tan, S. M. Heald, S-W. Cheong, A. S. Cooper, and J. I. Budnick, Phys. Rev. B 45, 2593 (1992)
- [30] Z.Y. Wu, M. Benfatto, and C.R. Natoli, Phys. Rev. B45, 531(1992); Z.Y. Wu, M. Benfatto, and C.R. Natoli, Phys. Rev. B57, 10336 (1998).
- [31] J. Mustre de Leon, J. Lezama-Pacheco, A. Bianconi and N.L. Saini, J. Supercond. Nov. Mag. 22, 579-583 (2009).
- [32] A. Iadecola, S. Agrestini, M. Filippi, L. Simonelli, M. Fratini, B. Joseph, D. Mahajan and N. L. Saini EPL 87, 26005 (2009).
- [33] J. Chaboy, A. Marcelli, M. Marziali, O. Gzowski, S. Stizza and K. Szaniawska, Jap. J. Appl. Phys. 32, 797 (1993).
- [34] L.Sun, X. Dai, C. Zhang, W. Yi, L. Zheng, Z. Jiang, X. Wei, Y. Huang, J. Yang, Z. ren, W. Lu, X. Dong, G. Che, Q. Wu, H. Ding, J. Liu, T. Hu, Z.X. Zhao, arXiv:0907.4212v1.
- [35] Frontiers of Novel Superconductivity in Heavy Fermion Compounds, eds. Y. Onuki and Y. Kitaoka, special issue of J. Phys. Soc. Jpn. 76(5), 051001 (2007); see also, a brief review by F. Steglich, J. Phys. Soc. Jpn. 74, 167 177 (2005); ibid, 222 (2005).
- [36] C. J. Zhang, H. Oyanagi, Z. H. Sun, Y. Kamihara, H. Hosono, Phys. Rev. B 78, 214513 (2008).
- [37] M. Sato, Y. Kobayashi, S.-C. Lee, H. Takahashi, Y. Miura, arXiv:0907.3007v1.