Abstract
We compare the luminosity function and rate inferred from the GBM long bursts peak flux distribution with those inferred from the Swift and BATSE peak flux distribution. We find that the GBM, BATSE and the Swift peak fluxes can be fitted by the same luminosity function implying the consistency of these three samples. Using the trigger algorithm of the LAT instrument we derive important information on the flux at 100 MeV compared to lower energy detected by the GBM. We find that the simple extension of the synchrotron emission to high energy cannot justify the low rate of GRBs detected by LAT and for several GRBs detected by the GBM, the flux at MeV should be suppressed. Two bursts, GRB090217 and GRB 090202b, detected by LAT have very soft spectra in the GBM and therefore their high energy emission cannot be due to an extension of the synchrotron.
1 Introduction
Gamma ray bursts (GRBs) are the most powerful events in the universe, their total emitted energy outputs exceeding sometime ergs, owing to relativistic aberration. In GRBs in fact, the most extreme relativistic regimes are attained among all high energy sources of macroscopic size. Most of the energy is radiated in gamma-rays of 100 to 1000 keV, with tails up to the GeV domain, as detected formerly by CGRO/EGRET (Dingus 1995, Hurley et al. 1994, Gonzalez et al. 1994) and more recently and with much better detail by the AGILE/GRID and Fermi/LAT instruments (Marisaldi et al. 2009, Giuliani et al. 2008, Giuliani et al. 2009, Abdo et al. 2009, Abdo et al. 2009, Bissaldi et al. 2009, Granot 2009).
Long GRBs (s) are thought to trace the history of massive star formation of the Universe and are detected all the way from locally (40 Mpc) to the edge of the Universe (, Salvaterra et al. 2009; Tanvir et al. 2009), so that they are ideal targets for the unbiased study of cosmological effects on the propagation of high energy photons and on the evolution of star formation.
However the number of GRBs with a measured redshift is still limited and at present we cannot derive directly the GRB luminosity function and rate evolution that are fundamental to understand the nature of these objects. We can constrain the luminosity function and rate distribution by fitting their peak flux distributions to those expected for a given luminosity function and GRB rate, as done for CGRO/BATSE and Swift/BAT GRBs (Piran 1992, Cohen & Piran 1995, Fenimore & Bloom 1995, Loredo & Wasserman 1995, Horack & Hakkila 1997, Loredo & Wasserman 1998, Schmidt 1999, Schmidt 2001, Sethi & Bhargavi 2001, Guetta, Piran & Waxman 2005, Guetta & Piran 2005, 2006, 2007). Since the observed flux distribution is a convolution of these two unknown functions we must assume one and find a best fit for the other.
Here we concentrate on the 250 long GRBs detected so far by the Gamma Ray Burst Monitor (GBM) onboard the Fermi GST (Table 1). We assume that the rate of long bursts follows the star formation rate and we search for the parameters of the luminosity function. In the first part of this paper, we show that one can obtain a fully consistent fit for the GBM, BATSE and the Swift peak flux populations, implying that the GBM sample has properties similar to those of BATSE and Swift.
Only 10 long bursts have been detected above 30 MeV by the LAT. Considering only the ratio between the LAT and GBM field of view (2.5 sr and more than 8 sr, respectively) and assuming comparable sensitivity of the 2 instruments in their energy ranges to the level of emission expected from GRBs, we would have expected that of the GBM bursts has a MeV counterpart and not only 5%, as detected. There could be 2 effects at play: the LAT sensitivity and the fact that the intrinsic brightness of the very high energy tails of GRBs can be lower than predicted with a simple extrapolation of the soft gamma-ray spectrum or based on synchrotron and inverse Compton flux estimates (see e.g. Ando, Nakar & Sari 2008, who have predicted a LAT detection rate of about 20 GRB/yr and see Fan 2009). Another possible explanation not related to instrumental or intrinsic GRB physics reasons is that in very distant GRBs with highly collimated jets, the intrinsic strong high energy emission is suppressed by the diffuse extragalactic infrared background (Gilmore, Prada, & Primack 2009).
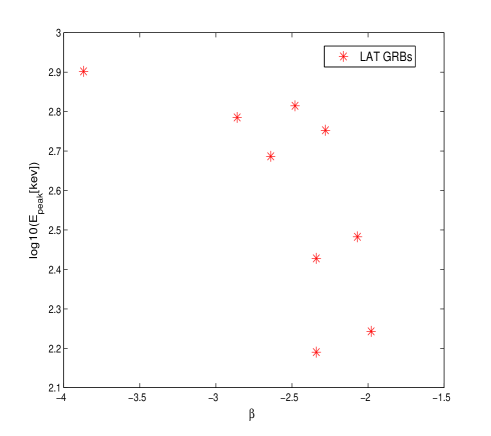
The statistics of the LAT detection with respect to GBM detection is not dissimilar from that of the GRO instruments EGRET vs BATSE: if the detection were only related to the FOV extension, EGRET should have detected about 50 GRBs out of the nearly 3000 detected by BATSE (BATSE covered virtually all sky, while the EGRET FOV was 30 deg in diameter). The fact that EGRET detected only about 20 GRBs above 20 MeV, of which about 5 with the spark chamber at the higher energies (i.e. higher than 200 MeV), reflects broadly the LAT-vs-GBM statistics and indicates an intrinsic paucity of detected very high energy tails. Similar to the LAT-detected GRBs, the EGRET-detected ones were among the brightest BATSE GRBs (Dingus et al. 1995). Recently, Kaneko et al. (2008) analyzed the spectral shapes of the BATSE GRBs observed by the TASC calorimeter, i.e. with MeV emission, and found that the spectra of these bursts are quite hard (i.e. have fairly high Epeak or small high energy spectral index). This is similar to what we find for the bursts detected by LAT (see Fig. 1).
A proper understanding of the link between the GRB spectral maximum emission (100 keV - 1 MeV) and its countepart above few MeV is the key to get insight into the inner mechanism of power generation and into the jet formation and collimation (see Kumar & Barniol Duran 2009, Zhang & Pe’er 2009, Zou, Fan, Piran 2009, Li 2009), and ultimately will explain how the GRB emission at the highest energies correlates with the fundamental GRB parameters (Amati, Frontera, Guidorzi 2009, Ghirlanda, Nava, & Ghisellini 2009).
In this paper, after having verified that the properties of the GBM GRB population do not differ from those of the previous GRB missions BATSE and Swift-BAT (Section 2), we analyze the sensitivity properties of the LAT and we estimate (following Band et al. 2009) the LAT detection rate of the high energy (100 MeV - 10 GeV) counterparts of GBM GRBs, under the hypothesis of a simple extrapolation of the GRB spectrum to energies larger than 1 MeV.
2 The luminosity function from the GBM sample
2.1 The GBM, BATSE and Swift-BAT samples
Our methodology follows Guetta et al. (2005) and Guetta & Piran (2006). We consider all the long ( seconds) bursts detected by the GBM until September 2009 and compare their peak fluxes (when measured) with the peak fluxes of the long GRBs detected by BATSE and Swift. The comparison is done in the energy band 50-300 keV, which is the band where BATSE detects GRBs. Note that for this comparison we have to convert GBM peak fluxes reported in different bands to fluxes in the 50-300 keV band. We have done this conversion by assuming that the spectrum around the maximum is fitted by the same spectral model that has been adopted to fit the average spectrum with identical fit parameters.
The average spectrum parameters of the GBM bursts are and keV (only for GRBs fitted with the Band law). Using these average parameters, we estimate, from Band (2003), a GBM sensitivity in the 50-300 keV of 0.5 ph cm-2 s-1. Hereafter, we consider for our analysis only the long ( s) GBM bursts with peak flux higher than that threshold, consisting in a sample of 125 bursts.
In the BATSE sample we have included all the long GRBs detected while the BATSE onboard trigger was set to a significance of 5.5 over background in at least two detectors, in the energy range 50-300 keV. Among those we selected the bursts for which the peak flux in a 1024 ms timescale is higher than the BATSE threshold for long bursts reported by Band (2003), 0.25 ph cm-2 s-1. This yields a sample of 1425 bursts.
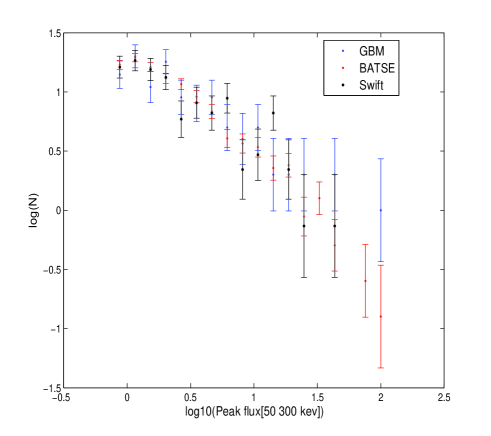
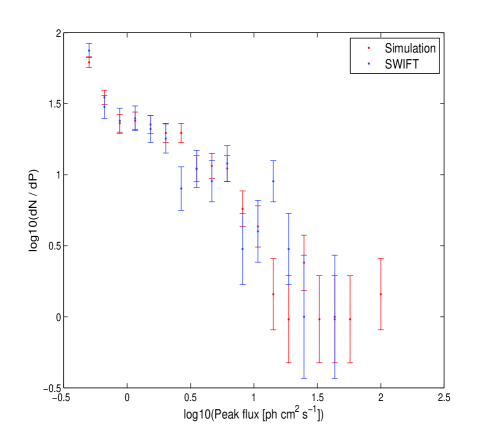
For Swift we consider all long bursts detected until September 2009 in the energy range 15-150 keV. We convert the BAT 15-150 keV peak fluxes to fluxes in the 50-300 keV band using the BAT peak fluxes and spectral parameters provided by the Swift team111See Swift information page http://swift.gsfc.nasa.gov/docs/swift/archive/grb_table.html. We consider only the bursts with peak fluxes above the threshold of ph cm-2 s-1 (Band 2003), which is equivalent to a sample of 259 GRBs. The fluxes of the three instruments are shown in Fig. 2, where we have normalized to the number of GRBs in our GBM sample.
2.2 Luminosity function and comoving rate
We now construct a luminosity function that we will normalize to our GBM GRB distribution. The method used to derive the luminosity function is essentially the one used by Schmidt (1999), Guetta et al. (2005) and Guetta and Piran (2007). We consider a broken power law between lower and upper limits which are factors of and respectively times the break luminosity . The luminosity function (of the peak luminosity ) in the interval to is:
| (1) |
where is a normalization constant so that the integral over the luminosity function equals unity. We stress that the luminosity considered here is the “isotropic” equivalent luminosity, which is the one relevant for detection. It does not include a correction factor due to beaming.
Assuming that long GRBs follow the star formation rate we employ four parametrizations of the star formation rate: (i) Model SF2 of Porciani & Madau (2001):
| (2) |
where is the GRB rate at .
An important factor is the cosmological k correction. We approximate the typical effective spectral index in the observed range of 50 keV to 300 keV as (). The use of this average correction is justified when we compare estimates of the luminosity based on this average value and on the real spectrum (see Guetta and Piran 2007).
2.3 Monte Carlo simulations
In our Monte Carlo simulations, each generated GRB is given a redshift, a luminosity and a spectrum according to the specific intrinsic distributions that have been described above. For each burst we compute the observed peak flux and compare the peak flux distribution with the observed one. We find the best-fitting LF parameters and their dispersion by minimization. We vary the luminosity function parameters , , and keeping and and inspect the quality of the fit to the observed GBM peak flux distribution. Once we obtain the best fit parameters for the GBM sample we test the quality of the fit with both the observed BATSE and the Swift peak flux distributions. We then repeat the same procedure and look for the luminosity function parameters that best fit the Swift sample and the BATSE sample. Then we check the quality of the fit with these parameters with the observed GBM, BATSE and the Swift peak flux distributions. The results of the fit are reported in Table 2. These show that the best fit parameters and are rather robust and the values of and found for these different samples are all consistent within the error bars.
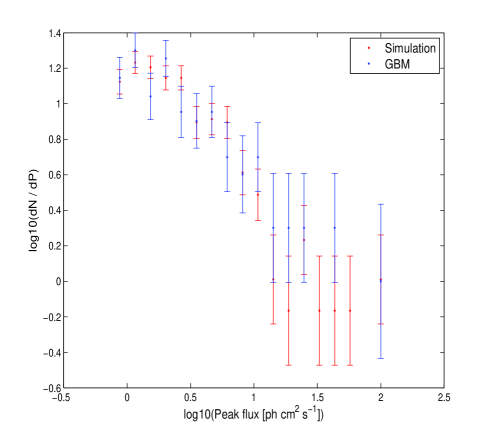
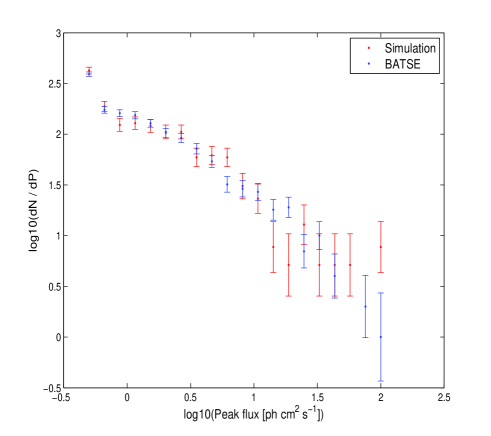
We consider a LF that fit quite well all the samples (we call it LFb), this has , and erg cm-2 s-1. Fig. 3, 4 and 5 depict a comparison of the peak flux distributions of GBM, BATSE and Swift with the predicted distribution obtained with the LF given above.
3 Estimation of the LAT Detection Sensitivity to GRBs
Following Band et al. 2009 we compute the LAT’s burst detection sensitivity using a semi-analytical approach based on the likelihood ratio test introduced by Neyman & Pearson (1928). This test is applied extensively to photon-counting experiments (Cash 1979) and has been used to analyze the gamma-ray data from COS-B (Pollock 1981, 1985) and EGRET, (Mattox 1996). The statistic for this test is the likelihood for the null hypothesis for the data divided by the likelihood for the alternative hypothesis, here that burst flux is present. This methodology is the basis of the likelihood tool used to analyze LAT observations; here we perform a semi-analytic calculation for the simple case of a point source on a uniform background.
The important quantity to write is the
| (3) | |||||
where we have defined a signal-to-noise ratio , MeV and GeV. Here we assume between 100 MeV and 10 GeV, where is determined from the flux at 100 MeV. is the effective area given in Atwood et al. 2009. This area decreases very rapidly with increasing boresight angle and we take this into account.
We have estimated the flux at 1 MeV for all our GRBs that have a measured fluence222Some GRBs with no reported peakflux have a fluence measurement. While these GRBs are excluded from the peak flux analysis described above, they have been included in our estimate of the MeV flux., a measured boresight angle and reliable spectral fit parameters. For these bursts we extrapolate the flux at 1 MeV using the spectrum, normalized with the fluence. For GRBs with multi-peak structure, for which the spectral fit parameters and relevant observed quantities are reported individually for each pulse, we have estimated the 1 MeV flux using the spectrum of the last pulse (GRBs 081009, 090509, 090516A, and 090610B).
We applied one caveat for GRBs with spectra fitted in the GBM band with single power-laws: in this case, the spectrum cannot be extrapolated straightforwardly to 1 MeV if the energy range used for the fit is much softer. Thus, for the 1-MeV flux estimate we have retained the GRBs fitted with single power-laws over a range whose upper energy is larger than 800 keV, i.e. close enough to 1 MeV to guarantee that the extrapolation will not dramatically overestimate the flux at 1 MeV if there is a spectral break beyond the spectral fitting range. Following this criterion, we excluded GRBs 080818A, 080928, 081206C, 081225, for which the 1-MeV flux has been automatically set to zero. In total, we could reliably estimate the flux at 1 MeV for 167 GRBs.
Analogously, we have estimated by extrapolation the flux at 100 MeV. However, the GRBs for which this extrapolation results in a non-zero flux are only those fitted with the Band law. In fact, when the flux at 100 MeV is extrapolated from spectra fitted with power-law plus exponential high energy cutoff, the result is generally null, because of the high suppression caused by the exponential at MeV energies. On the other hand, the extrapolation of spectra fitted by single power-law in the GBM range to 100 MeV is very likely to overestimate the flux at 100 MeV by many orders of magnitude. The 100 MeV fluxes of GRBs fitted with single power-laws have been arbitrarily set to zero. Twelve (number may change) GRBs fitted with the Band law have , which translates in a spectrum that rises with energy. The spectral fit for these GRBs extends to 1 MeV, so that the flux estimate at this energy is reliable. However, it is likely that the spectrum curves at higher energies, starting well below 100 MeV, so that the flux estimate at 100 MeV with the index of the formal Band-law fit may overestimate the real flux by orders of mangitude. For these GRBs, we have estimated the 100-MeV flux under the assumption that the spectrum above 1 MeV steepens333Note that a spectral steepening at an energy comprised between 1 and 100 MeV may occur in all our GRBs, and not only in those whose GBM high energy spectrum is fitted with . However, for GRBs with , ignoring this possible steepening leads to a less dramatic discrepancy. to (the average value of the whole sample of Band-fitted GRBs). In the tests we will implement in the following, we will both include and exclude those 12 GRBs and will provide the results in both cases.
The Point Spread Function (PSF), , is taken from Burnett 2007 (private comunication):
| (4) |
with where (in radiant) with a=58e-3 e b=377e-6 (on-ground analysis). The parameter depends very weakly on the energy and vary between 2-2.5. We can consider for our analysis (Burnett 2007).
Like Band 2009, we assume a spatially uniform background with a power law spectrum
| (5) |
where the value of the normalization constant is set to mimic the expected background rate. For modeling the on-ground trigger the background rate above 100 MeV is set to 4 Hz. The spectral index is set to be . In our modeling we assume that the GRB flux is constant over a duration . Since we seek the optimal detection sensitivity, we calculate for . We also consider the effect of the boresight angle, i.e. the effective area drops of a factor of between and of boresight angle.
The expected number of counts from a burst flux S(E) is
| (6) |
We require and at least 10 source counts in the LAT detector, corresponding to a threshold significance of 5 and a minimum number of GRB counts.
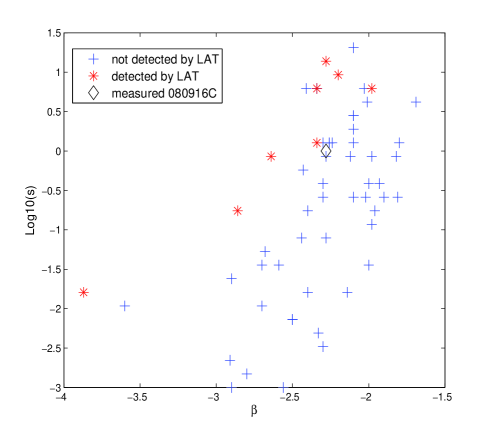
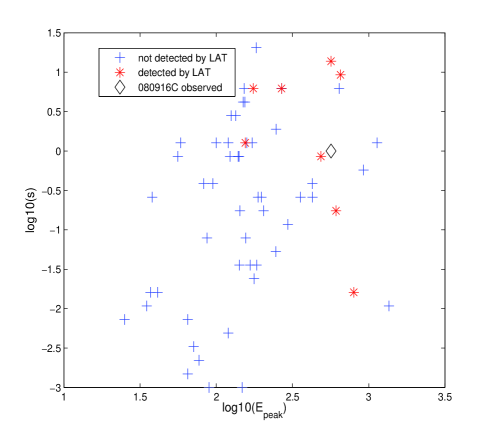
In the sample there are 84 bursts that can be fitted with a Band spectra and have a determined boresight angle, 34 GRBs have and therefore cannot be detected by LAT. We are left with 50 bursts and 28 of them were not detected by LAT. For these 28 bursts the flux S(E) in the eq.3 and 6 between 100 MeV-and 10 GeV is given by where is determined from the flux at 100 MeV obtained by extrapolating the Band spectra used to fit the GBM data at high energy, using the spectral index from the data (or -2.3 if ) . An interesting quantity that can be defined for these bursts is the ratio, s, between the flux at 100 MeV obtained by simply extending the synchrotron emission at high energies, and the flux at 100 MeV that one needs in order to be at the threshold of the LAT detection. In Fig. 6 we plot this ratio as a function of the spectral index and in Fig.7 we plot this ratio as a function of the peak energy. As it is clear from these figures, the softer the spectrum, the smaller the value of s, implying that the LAT does not detect any signal, as expected. It is interesting to note that there are bursts that could have been detected by LAT (have ) but were not detected. This implies that there is a suppression in the flux at high energy and the spectrum is not simply the extension of the Band law. In the same figures we also plot s vs () for the bursts detected by LAT. We see that for two bursts GRB 090217 and GRB 090902B that have very soft spectra, the value of is and therefore the emission cannot be an extrapolation of the synchrotron emission but another component is needed to justify the emission at high energy. Recently Bissaldi et al. (astro-ph/0909.2470) have shown that in the GRB 090202b a distinct extra component is needed to explain the observed results in agreement with what we find. In the figures we also report the ratio between the measured flux at 100 MeV and the flux extrapolated from the synchrotron emission for 080916c (the diamond mark).
4 Discussion
We have shown that the simple extension of the synchrotron emission cannot justify the lack of detection of high energy emission from GRBs. The emission is suppressed at high energy by some mechanism (Fan 2009): i.e. the electrons are not accelerated to such an high energy, the high energy photons pair produce with low energy photons in the source and cannot escape the source or pair produce with external photons.
On the other hand for the bursts detected by LAT there are two GRBs that have very soft synchrotron emission and their high energy emission cannot be explained by simple extrapolation of the low energy emission. There is evidence of another component at least in one GRB 090902b.
: GBM parameters for the bursts detected by Fermi. The first column report the GRB name, the second column the duration of the GRB, the third one the GRB fluence (set to -1 when not available), the fourth the peak flux (taken in 1 sec for long bursts and set to -1 when not available), the fifth column report the method used to fit the spectra, the sixth the peak energy (set to -1 when not available), the seventh and eight the and spectral indexes (set to 1000 when not available). The ninth column report the angle, , from the LAT boresight, in deg (set to -1 when not available). The last column indicates LAT detection (1 = YES, 0 = NO)
| GRB | T90 | Fluence (erg/cm2) | PF(ph/s/cm2) | Function | LAT | ||||
|---|---|---|---|---|---|---|---|---|---|
| sec | erg/cm2 | ph/cm2/sec | keV | ||||||
| 080810 | 122.0 | 6.90e+00 | 1.85e+00 | PL+HEC | 313.5 | -0.91 | -1000.00 | 61 | 0 |
| 080812 | 15.0 | -1.00e+00 | -1.00e+00 | PL+HEC | 140.0 | 0.17 | -1000.00 | 71 | 0 |
| 080816A | 70.0 | 1.86e+01 | 3.48e+00 | PL+HEC | 146.7 | -0.57 | -1000.00 | 55 | 0 |
| 080816B | 5.0 | -1.00e+00 | 1.38e+00 | PL+HEC | 1230.0 | -0.37 | -1000.00 | 70 | 0 |
| 080817A | 70.0 | -1.00e+00 | -1.00e+00 | * | -1.0 | 1000.00 | -1000.00 | 80 | 0 |
| 080817B | 6.0 | 2.60e+00 | -1.00e+00 | SPL | -1.0 | -1.07 | -1000.00 | 68 | 0 |
| 080818A | 50.0 | 2.26e+00 | -1.00e+00 | SPL | -1.0 | -1.57 | -1000.00 | 68 | 0 |
| 080818B | 10.0 | 1.00e+00 | -1.00e+00 | PL+HEC | 80.0 | -1.30 | -1000.00 | 68 | 0 |
| 080823 | 46.0 | 4.10e+00 | -1.00e+00 | PL+HEC | 164.7 | -1.20 | -1000.00 | 77 | 0 |
| 080824 | 28.0 | 2.30e+00 | -1.00e+00 | Band | 100.0 | -0.40 | -2.10 | 17 | 0 |
| 080825C | 22.0 | 2.40e+01 | -1.00e+00 | Band | 155.0 | -0.39 | -2.34 | 60 | 1 |
| 080830 | 45.0 | 4.60e+00 | -1.00e+00 | Band | 154.0 | -0.59 | -1.69 | 23 | 0 |
| 080904 | 22.0 | 2.25e+00 | 3.50e+00 | Band | 35.0 | 0.00 | -2.70 | 23 | 0 |
| 080905A | 1.0 | 2.80e-01 | 6.10e+00 | SPL | -1.0 | -0.96 | -1000.00 | 28 | 0 |
| 080905B | 159.0 | 4.10e-02 | 2.10e-01 | SPL | -1.0 | -1.75 | -1000.00 | 82 | 0 |
| 080905C | 28.0 | 4.60e+00 | 4.40e+00 | PL+HEC | 78.8 | -0.90 | -1000.00 | 108 | 0 |
| 080906B | 5.0 | 1.09e+01 | 2.20e+01 | Band | 125.3 | -0.07 | -2.10 | 32 | 0 |
| 080912 | 17.0 | 3.30e+00 | 4.10e+00 | SPL | -1.0 | -1.74 | -1000.00 | 56 | 0 |
| 080913B | 140.0 | 2.20e+00 | -1.00e+00 | PL+HEC | 114.0 | -0.69 | -1000.00 | 71 | 0 |
| 080916A | 60.0 | 1.50e+01 | 4.50e+00 | PL+HEC | 109.0 | -0.90 | -1000.00 | 76 | 0 |
| 080916C | 100.9 | 2.40e+02 | 6.87e+00 | Band | 566.0 | -0.92 | -2.28 | 48 | 1 |
| 080920 | 85.0 | 2.40e+00 | 1.29e+00 | SPL | -1.0 | -1.42 | -1000.00 | 16 | 0 |
| 080925 | 29.0 | 9.70e+00 | -1.00e+00 | Band | 120.0 | -0.53 | -2.26 | 38 | 0 |
| 080927 | 25.0 | 5.70e+00 | 2.00e+00 | SPL | -1.0 | -1.50 | -1000.00 | 75 | 0 |
| 080928 | 87.0 | 1.50e+00 | -1.00e+00 | SPL | -1.0 | -1.80 | -1000.00 | -1 | 0 |
| 081003C | 67.0 | 5.40e+00 | -1.00e+00 | SPL | -1.0 | -1.41 | -1000.00 | 48 | 0 |
| 081006A | 7.0 | 7.10e-01 | -1.00e+00 | Band | 1135.0 | -0.77 | -1.80 | 16 | 0 |
| 081006B | 9.0 | 7.30e-01 | -1.00e+00 | SPL | -1.0 | -1.30 | -1000.00 | 3 | 0 |
| 081007A | 12.0 | 1.20e+00 | 2.20e+00 | SPL | -1.0 | -2.10 | -1000.00 | 116 | 0 |
| 081007B | 0.5 | -1.00e+00 | -1.00e+00 | * | -1.0 | 1000.00 | -1000.00 | -1 | 0 |
| 081009 | 9.0 | 3.50e+01 | -1.00e+00 | Band | 47.4 | 0.10 | -3.42 | 67 | 0 |
| 081012 | 30.0 | 3.80e+00 | 2.00e+00 | PL+HEC | 360.0 | -0.31 | -1000.00 | 61 | 0 |
| 081021 | 25.0 | 5.30e+00 | 4.20e+00 | Band | 117.0 | 0.11 | -2.80 | 125 | 0 |
| 081024B | 0.8 | 3.40e-01 | 4.20e+00 | PL+HEC | 1583.0 | -0.70 | -1000.00 | -1 | 1 |
| 081024C | 65.0 | 4.00e+00 | 1.00e+00 | Band | 65.0 | -0.60 | -2.50 | 78 | 0 |
| 081025 | 45.0 | 7.10e+00 | 4.50e+00 | Band | 200.0 | 0.15 | -2.05 | -1 | 0 |
| 081028B | 20.0 | 2.00e+00 | 6.90e+00 | PL+HEC | 70.0 | -0.55 | -1000.00 | 107 | 0 |
| 081101A | 0.2 | 1.60e-01 | -1.00e+00 | SPL | -1.0 | -1.14 | -1000.00 | -1 | 0 |
| 081101B | 8.0 | 1.60e+01 | 1.03e+01 | PL+HEC | 550.0 | -0.62 | -1000.00 | 116 | 0 |
| GRB name | t90 | fluence | peakflux | Function | Epeak | LAT | |||
|---|---|---|---|---|---|---|---|---|---|
| sec | erg/cm2 | ph/cm2/sec | keV | ||||||
| 081102A | 88.0 | 2.10e+00 | -1.00e+00 | Band | 72.0 | 0.44 | -2.36 | -1 | 0 |
| 081102B | 2.2 | 1.12e+00 | 3.68e+00 | SPL | -1.0 | -1.07 | -1000.00 | 53 | 0 |
| 081105B | 0.2 | 2.28e-01 | 2.00e+01 | SPL | -1.0 | -1.17 | -1000.00 | 87 | 0 |
| 081107 | 2.2 | 1.64e+00 | 1.10e+01 | Band | 65.0 | 0.25 | -2.80 | 52 | 0 |
| 081109A | 45.0 | 6.53e+00 | 3.20e+00 | PL+HEC | 240.0 | -1.28 | -1000.00 | -1 | 0 |
| 081110 | 20.0 | -1.00e+00 | -1.00e+00 | * | -1.0 | 1000.00 | -1000.00 | 67 | 0 |
| 081113 | 0.5 | 1.07e+00 | 2.00e+01 | SPL | -1.0 | -1.28 | -1000.00 | 60 | 0 |
| 081118B | 20.0 | 1.12e-01 | 6.70e-01 | Band | 41.2 | 0.80 | -2.14 | 41 | 0 |
| 081119 | 0.8 | 4.10e-01 | 7.20e+00 | SPL | -1.0 | 1.30 | -1000.00 | 86 | 0 |
| 081120 | 12.0 | 2.70e+00 | 5.10e+00 | Band | 44.0 | 0.40 | -2.18 | 84 | 0 |
| 081121 | -1.0 | -1.00e+00 | -1.00e+00 | * | -1.0 | 1000.00 | -1000.00 | -1 | 0 |
| 081122A | 26.0 | 9.60e+00 | 3.00e+01 | Band | 158.6 | -0.63 | -2.24 | 21 | 0 |
| 081122B | 0.3 | 7.90e-02 | 1.60e+00 | SPL | -1.0 | -1.50 | -1000.00 | 52 | 0 |
| 081124 | 35.0 | 9.50e-02 | 6.70e-01 | Band | 22.8 | -0.60 | -2.83 | 86 | 0 |
| 081125 | 15.0 | 4.91e+01 | 2.70e+01 | Band | 221.0 | 0.14 | -2.34 | 126 | 0 |
| 081129 | 59.0 | 2.00e+01 | 1.40e+01 | Band | 150.0 | -0.50 | -1.84 | 118 | 0 |
| 081130A | -1.0 | -1.00e+00 | -1.00e+00 | * | -1.0 | 1000.00 | -1000.00 | 90 | 0 |
| 081130B | 12.0 | 1.30e+00 | 1.80e+00 | PL+HEC | 152.0 | -0.77 | -1000.00 | 66 | 0 |
| 081204B | 0.3 | 4.88e-01 | 1.63e+01 | SPL | -1.0 | -1.18 | -1000.00 | 46 | 0 |
| 081204C | 4.7 | 1.48e+00 | 7.20e+00 | SPL | -1.0 | -1.40 | -1000.00 | 56 | 0 |
| 081206A | 24.0 | 4.00e+00 | 2.40e+00 | Band | 151.0 | 0.13 | -2.20 | 102 | 0 |
| 081206B | 10.0 | -1.00e+00 | -1.00e+00 | * | -1.0 | 1000.00 | -1000.00 | 82 | 0 |
| 081206C | 20.0 | 1.19e+00 | 7.60e-01 | SPL | -1.0 | -1.35 | -1000.00 | 71 | 0 |
| 081207 | 153.0 | 1.06e+02 | -1.00e+00 | Band | 639.0 | -0.65 | -2.41 | 56 | 0 |
| 081209 | 0.4 | 5.90e-01 | 7.80e+00 | Band | 808.0 | -0.50 | -2.00 | 109 | 0 |
| 081213 | 0.0 | -1.00e+00 | -1.00e+00 | * | -1.0 | 1000.00 | -1000.00 | 51 | 0 |
| 081215A | 7.7 | 5.44e+01 | 6.89e+01 | Band | 304.0 | -0.58 | -2.07 | 86 | 1 |
| 081215B | 90.0 | 2.80e+00 | -1.00e+00 | PL+HEC | 139.0 | -0.14 | -1000.00 | 112 | 0 |
| 081216 | 1.0 | 3.60e+00 | 5.50e+01 | Band | 1235.0 | -0.70 | -2.17 | 95 | 0 |
| 081217 | 39.0 | 1.00e+01 | 4.00e+00 | Band | 167.0 | -0.61 | -2.70 | 54 | 0 |
| 081221 | 40.0 | 3.70e+01 | 3.30e+01 | Band | 77.0 | -0.42 | -2.91 | 78 | 0 |
| 081222 | 30.0 | 1.35e+01 | 1.48e+01 | Band | 134.0 | -0.55 | -2.10 | 50 | 0 |
| 081223 | 0.9 | 1.20e+00 | 2.20e+01 | PL+HEC | 280.0 | -0.63 | -1000.00 | 28 | 0 |
| 081224 | 50.0 | -1.00e+00 | -1.00e+00 | * | -1.0 | 1000.00 | -1000.00 | 16 | 0 |
| 081225 | 42.0 | 2.45e+00 | 6.00e-01 | SPL | -1.0 | -1.51 | -1000.00 | 55 | 0 |
| 081226A | 1.7 | 2.10e-01 | 3.20e+00 | SPL | -1.0 | 1.17 | -1000.00 | 110 | 0 |
| 081226B | 0.4 | 6.10e-01 | 1.77e+01 | Band | 300.0 | -0.20 | -1.82 | 22 | 0 |
| 081226C | 60.0 | 2.32e+00 | 4.50e+00 | PL+HEC | 82.0 | -1.04 | -1000.00 | 54 | 0 |
| 081229 | 0.5 | 8.70e-01 | 1.07e+01 | Band | 585.0 | -0.27 | -2.00 | 44 | 0 |
| GRB name | t90 | fluence | peakflux | Function | Epeak | LAT | |||
|---|---|---|---|---|---|---|---|---|---|
| sec | erg/cm2 | ph/cm2/sec | keV | ||||||
| 081231 | 29.0 | 1.20e+01 | 1.53e+00 | Band | 152.3 | -0.80 | -2.03 | 20 | 0 |
| 090107B | 24.1 | 1.75e+00 | 3.68e+00 | PL+HEC | 106.1 | -0.68 | -1000.00 | -1 | 0 |
| 090108A | 0.9 | 1.28e+00 | 3.97e+01 | Band | 104.8 | -0.47 | -1.97 | 60 | 0 |
| 090108B | 0.8 | 7.90e-01 | 1.90e+01 | SPL | -1.0 | -0.99 | -1000.00 | 72 | 0 |
| 090109 | 5.0 | 1.21e+00 | 2.76e+00 | SPL | -1.0 | -1.50 | -1000.00 | 62 | 0 |
| 090112A | 65.0 | 5.20e+00 | 7.00e+00 | Band | 150.0 | -0.94 | -2.01 | 4 | 0 |
| 090112B | 12.0 | 5.40e+00 | 1.40e+01 | Band | 139.0 | -0.75 | -2.43 | 95 | 0 |
| 090117A | 21.0 | 1.80e+00 | 9.60e+00 | Band | 25.0 | -0.40 | -2.50 | 51 | 0 |
| 090117B | 27.0 | 2.10e+00 | 4.60e+00 | SPL | -1.0 | -1.55 | -1000.00 | 49 | 0 |
| 090117C | 86.0 | 1.10e+01 | 4.20e+00 | Band | 247.0 | -1.00 | -2.10 | 54 | 0 |
| 090126B | 10.8 | 1.25e+00 | 4.90e+00 | PL+HEC | 47.5 | -0.99 | -1000.00 | 18 | 0 |
| 090126C | -1.0 | -1.00e+00 | -1.00e+00 | * | -1.0 | 1000.00 | -1000.00 | 68 | 0 |
| 090129 | 17.2 | 5.60e+00 | 8.00e+00 | Band | 123.2 | -1.39 | -1.98 | 22 | 0 |
| 090131 | 36.4 | 2.23e+01 | 4.79e+01 | Band | 58.4 | -1.27 | -2.26 | 40 | 0 |
| 090202 | 66.0 | 8.65e+00 | 7.77e+00 | PL+HEC | 570.0 | -1.31 | -1000.00 | 55 | 0 |
| 090206 | 0.8 | 1.04e+00 | 1.90e+01 | PL+HEC | 710.0 | -0.65 | -1000.00 | 72 | 0 |
| 090207 | 10.0 | 4.01e+00 | 1.88e+00 | SPL | -1.0 | -1.59 | -1000.00 | 45 | 0 |
| 090213 | -1.0 | -1.00e+00 | -1.00e+00 | * | -1.0 | 1000.00 | -1000.00 | 17 | 0 |
| 090217 | 32.8 | 3.08e+01 | 1.12e+01 | Band | 610.0 | -0.85 | -2.86 | 34 | 1 |
| 090219 | 0.5 | 8.00e-01 | 7.70e+00 | SPL | -1.0 | -1.43 | -1000.00 | 137 | 0 |
| 090222 | 18.0 | 2.19e+00 | 1.10e+00 | Band | 147.9 | -0.97 | -2.56 | 80 | 0 |
| 090227A | 50.0 | 9.00e+00 | 4.57e+00 | Band | 1357.0 | -0.92 | -3.60 | 21 | 0 |
| 090227B | 0.9 | 8.70e+00 | 3.46e+01 | Band | 2255.0 | -0.53 | -3.04 | 72 | 0 |
| 090228A | 0.8 | 6.10e+00 | 1.33e+02 | Band | 849.0 | -0.35 | -2.98 | 16 | 0 |
| 090228B | 7.2 | 9.96e-01 | 2.53e+00 | PL+HEC | 147.8 | -0.70 | -1000.00 | 20 | 0 |
| 090301B | 28.0 | 2.69e+00 | 4.40e+00 | Band | 427.0 | -0.98 | -1.93 | 56 | 0 |
| 090303 | -1.0 | -1.00e+00 | -1.00e+00 | * | -1.0 | 1000.00 | -1000.00 | -1 | 0 |
| 090304 | -1.0 | -1.00e+00 | -1.00e+00 | * | -1.0 | 1000.00 | -1000.00 | 31 | 0 |
| 090305B | 2.0 | 2.70e+00 | 1.10e+01 | Band | 770.0 | -0.50 | -1.90 | 40 | 0 |
| 090306C | 38.8 | 9.00e-01 | 2.40e+00 | Band | 87.0 | -0.32 | -2.28 | 14 | 0 |
| 090307B | 30.0 | 1.70e+00 | 1.80e+00 | PL+HEC | 212.0 | -0.70 | -1000.00 | 83 | 0 |
| 090308B | 2.1 | 3.46e+00 | 1.42e+01 | PL+HEC | 710.3 | -0.54 | -1000.00 | 50 | 0 |
| 090309B | 60.0 | 4.70e+00 | 4.43e+00 | PL+HEC | 197.0 | -1.52 | -1000.00 | 26 | 0 |
| 090310 | 125.2 | 2.15e+00 | 4.40e+00 | PL+HEC | 279.0 | -0.65 | -1000.00 | 77 | 0 |
| 090319 | 67.7 | 7.47e+00 | 3.85e+00 | PL+HEC | 187.3 | 0.90 | -1000.00 | 27 | 0 |
| 090320A | 10.0 | -1.00e+00 | -1.00e+00 | * | -1.0 | 1000.00 | -1000.00 | 60 | 0 |
| 090320B | 52.0 | 1.10e+00 | 1.20e-01 | PL+HEC | 72.0 | -1.10 | -1000.00 | 101 | 0 |
| 090320C | 4.0 | -1.00e+00 | -1.00e+00 | * | -1.0 | 1000.00 | -1000.00 | 40 | 0 |
| 090323 | 70.0 | 1.00e+02 | 1.23e+01 | PL+HEC | 697.0 | -0.89 | -1000.00 | -1 | 1 |
| GRB name | t90 | fluence | peakflux | Function | Epeak | LAT | |||
|---|---|---|---|---|---|---|---|---|---|
| sec | erg/cm2 | ph/cm2/sec | keV | ||||||
| 090326 | 11.2 | 8.60e-01 | -1.00e+00 | PL+HEC | 75.0 | -0.86 | -1000.00 | 103 | 0 |
| 090327 | 24.0 | 3.00e+00 | 3.50e+00 | Band | 89.7 | -0.39 | -2.90 | 66 | 0 |
| 090328A | 100.0 | 8.09e+01 | 1.85e+01 | Band | 653.0 | -0.93 | -2.20 | -1 | 1 |
| 090328B | 0.3 | 9.61e-01 | 2.98e+01 | Band | 1967.0 | -0.92 | -2.48 | 74 | 0 |
| 090330 | 80.0 | 1.14e+01 | 6.80e+00 | Band | 246.0 | -0.99 | -2.68 | 50 | 0 |
| 090331 | -1.0 | -1.00e+00 | -1.00e+00 | * | -1.0 | 1000.00 | -1000.00 | 40 | 0 |
| 090403 | 16.0 | -1.00e+00 | -1.00e+00 | * | -1.0 | 1000.00 | -1000.00 | 42 | 0 |
| 090405 | 1.2 | -1.00e+00 | -1.00e+00 | * | -1.0 | 1000.00 | -1000.00 | 70 | 0 |
| 090409 | 20.0 | 6.14e-01 | 1.36e+00 | PL+HEC | 137.0 | 1.20 | -1000.00 | 90 | 0 |
| 090411A | 24.6 | 8.60e+00 | 3.25e+00 | Band | 141.0 | -0.88 | -1.82 | 59 | 0 |
| 090411B | 18.7 | 8.00e+00 | 7.40e+00 | Band | 189.0 | -0.80 | -2.00 | 111 | 0 |
| 090412 | 0.5 | -1.00e+00 | -1.00e+00 | * | -1.0 | 1000.00 | -1000.00 | 71 | 0 |
| 090418C | 0.6 | 6.00e-01 | 8.50e+00 | PL+HEC | 1000.0 | -0.94 | -1000.00 | 58 | 0 |
| 090422 | 10.0 | 1.00e+00 | 7.80e+00 | SPL | -1.0 | 1.81 | -1000.00 | 29 | 0 |
| 090423 | 12.0 | 1.10e+00 | 3.30e+00 | PL+HEC | 82.0 | -0.77 | -1000.00 | 75.6 | 0 |
| 090424 | 52.0 | 5.20e+01 | 1.37e+02 | Band | 177.0 | 0.90 | -2.90 | 71 | 0 |
| 090425 | 72.0 | 1.30e+01 | 1.40e+01 | Band | 69.0 | -1.29 | -2.03 | 105 | 0 |
| 090426B | 3.8 | 5.20e-01 | -1.00e+00 | SPL | -1.0 | -1.60 | -1000.00 | 56 | 0 |
| 090426C | 12.0 | 3.10e+00 | 6.80e+00 | Band | 295.0 | -1.29 | -1.98 | 69 | 0 |
| 090427B | 7.0 | 8.00e-01 | -1.00e+00 | SPL | -1.0 | -1.10 | -1000.00 | 14 | 0 |
| 090427C | 12.5 | 1.60e+00 | -1.00e+00 | PL+HEC | 75.0 | 0.35 | -1000.00 | 81 | 0 |
| 090428A | 8.0 | 9.90e-01 | 1.23e+01 | Band | 85.0 | -0.40 | -2.70 | 96 | 0 |
| 090428B | 30.0 | 5.20e+00 | 1.01e+01 | Band | 53.0 | -1.81 | -2.17 | 101 | 0 |
| 090429C | 13.0 | 3.70e+00 | 6.70e+00 | SPL | -1.0 | -1.43 | -1000.00 | 112 | 0 |
| 090429D | 11.0 | 1.60e+00 | 8.60e-01 | SPL | 223.0 | -0.87 | -1000.00 | 33 | 0 |
| 090502 | 66.2 | 3.50e-02 | 6.20e+00 | PL+HEC | 63.2 | -1.10 | -1000.00 | 77 | 0 |
| 090509 | 295.0 | 8.40e+00 | 3.10e+00 | PL+HEC | 343.0 | -0.90 | -1000.00 | 75 | 0 |
| 090510A | 1.4 | 3.00e+01 | 8.00e+01 | Band | 4400.0 | -0.80 | -2.60 | -1 | 1 |
| 090510B | 7.0 | -1.00e+00 | -1.00e+00 | * | -1.0 | 1000.00 | -1000.00 | 100 | 0 |
| 090511 | 14.0 | 1.80e+00 | 2.50e+00 | PL+HEC | 391.0 | -0.95 | -1000.00 | 67 | 0 |
| 090513A | 23.0 | 6.80e+00 | 2.70e+00 | PL+HEC | 850.0 | -0.90 | -1000.00 | 89 | 0 |
| 090513B | -1.0 | -1.00e+00 | -1.00e+00 | * | -1.0 | 1000.00 | -1000.00 | 119 | 0 |
| 090514 | 49.0 | 8.10e+00 | 7.60e+00 | SPL | -1.0 | -1.92 | -1000.00 | 19 | 0 |
| 090516A | 350.0 | 2.30e+01 | 5.30e+00 | Band | 51.4 | -1.03 | -2.10 | 20 | 0 |
| 090516B | 350.0 | 3.00e+01 | 4.00e+00 | PL+HEC | 327.0 | -1.01 | -1000.00 | 45 | 0 |
| 090516C | 15.0 | 4.00e+00 | 7.70e+00 | Band | 38.0 | -0.44 | -1.81 | 69 | 0 |
| 090518A | 9.0 | 1.60e+00 | 4.70e+00 | SPL | -1.0 | -1.59 | -1000.00 | 53 | 0 |
| 090518B | 12.0 | 2.20e+00 | 5.60e+00 | PL+HEC | 127.0 | -0.74 | -1000.00 | 90 | 0 |
| 090519B | 87.0 | 1.40e+00 | 5.02e+00 | SPL | -1.0 | -1.63 | -1000.00 | 18 | 0 |
| 090520B | 1.5 | 4.50e-01 | 4.10e+00 | SPL | -1.0 | -1.40 | -1000.00 | 10 | 0 |
| 090520C | 4.9 | 3.54e+00 | 4.47e+00 | Band | 204.2 | -0.73 | -1.96 | 71 | 0 |
| 090520D | 12.0 | 4.00e+00 | 4.10e+00 | Band | 46.3 | -0.99 | -3.25 | 66 | 0 |
| 090522 | 22.0 | 1.20e+00 | 3.50e+00 | PL+HEC | 75.8 | -1.03 | -1000.00 | 53 | 0 |
| 090524 | 72.0 | 1.85e+01 | 1.41e+01 | Band | 82.6 | -1.00 | -2.30 | 63 | 0 |
| 090528A | 68.0 | 9.30e+00 | 7.60e+00 | PL+HEC | 99.0 | -1.70 | -1000.00 | 81 | 0 |
| 090528B | 102.0 | 4.65e+01 | 1.47e+01 | Band | 172.0 | -1.10 | -2.30 | 65 | 0 |
| GRB name | t90 | fluence | peakflux | Function | Epeak | LAT | |||
|---|---|---|---|---|---|---|---|---|---|
| sec | erg/cm2 | ph/cm2/sec | keV | ||||||
| 090529B | 5.1 | 3.40e-01 | 4.10e+00 | Band | 142.0 | -0.70 | -2.00 | 36 | 0 |
| 090529C | 10.4 | 3.10e+00 | 2.50e+01 | Band | 188.0 | -0.84 | -2.10 | 69 | 0 |
| 090530B | 194.0 | 5.90e+01 | 1.08e+01 | Band | 67.0 | -0.71 | -2.42 | 84 | 0 |
| 090531B | 2.0 | 6.20e-01 | 1.49e+00 | Band | 2166.0 | -0.71 | -2.47 | 25 | 0 |
| 090602 | 16.0 | 5.70e+00 | 3.62e+00 | PL+HEC | 503.0 | -0.56 | -1000.00 | 112 | 0 |
| 090606 | 60.0 | 3.19e+00 | 2.41e+00 | SPL | -1.0 | -1.63 | -1000.00 | 128 | 0 |
| 090608 | 61.0 | 3.20e+00 | 2.70e+00 | SPL | -1.0 | -1.83 | -1000.00 | 93 | 0 |
| 090610A | 6.5 | 7.32e-01 | 9.40e-01 | SPL | -1.0 | -1.30 | -1000.00 | 70 | 0 |
| 090610B | 202.5 | 4.13e+00 | 1.54e+00 | PL+HEC | 104.9 | -0.46 | -1000.00 | 91 | 0 |
| 090610C | 18.1 | 8.54e-01 | 1.12e+00 | SPL | -1.0 | -1.62 | -1000.00 | 104 | 0 |
| 090612 | 58.0 | 2.37e+00 | 1.63e+00 | Band | 357.0 | -0.60 | -1.90 | 56 | 0 |
| 090616 | 2.7 | 2.23e-01 | 2.08e+00 | SPL | -1.0 | -1.27 | -1000.00 | 68 | 0 |
| 090617 | 0.4 | 4.68e-01 | 1.00e+01 | Band | 684.0 | -0.45 | -2.00 | 45 | 0 |
| 090618 | 155.0 | 2.70e+02 | 7.34e+01 | Band | 155.5 | -1.26 | -2.50 | 133 | 0 |
| 090620 | 16.5 | 6.60e+00 | 7.00e+00 | Band | 156.0 | -0.40 | -2.44 | 60 | 0 |
| 090621A | 294.0 | 4.40e+00 | 1.92e+00 | Band | 56.0 | -1.10 | -2.12 | 12 | 0 |
| 090621B | 0.1 | 3.71e-01 | 6.40e+00 | Band | 321.6 | -0.13 | -1.57 | 108 | 0 |
| 090621C | 59.9 | 1.80e+00 | 2.29e+00 | PL+HEC | 148.0 | -1.40 | -1000.00 | 52 | 0 |
| 090621D | 39.9 | 1.34e+00 | 1.74e+00 | SPL | -1.0 | -1.66 | -1000.00 | 79 | 0 |
| 090623 | 72.2 | 9.60e+00 | 3.30e+00 | Band | 428.0 | -0.69 | -2.30 | 73 | 0 |
| 090625A | 51.0 | 8.80e-01 | 5.00e-01 | PL+HEC | 198.0 | -0.60 | -1000.00 | 13 | 0 |
| 090625B | 13.6 | 1.04e+00 | 1.87e+00 | Band | 100.0 | -0.40 | -2.00 | 125 | 0 |
| 090626 | 70.0 | 3.50e+01 | 1.79e+01 | Band | 175.0 | -1.29 | -1.98 | 15 | 1 |
| 090630 | 5.1 | 5.10e-01 | 2.78e+00 | Band | 71.0 | -1.50 | -2.30 | 75 | 0 |
| 090701 | 12.0 | 4.50e-01 | 2.10e+00 | SPL | -1.0 | 1.84 | -1000.00 | 13 | 0 |
| 090703 | 9.0 | 6.80e-01 | 1.00e+00 | SPL | -1.0 | -1.72 | -1000.00 | 25 | 0 |
| 090704 | 70.0 | 5.80e+00 | 1.20e+00 | PL+HEC | 233.7 | -1.13 | -1000.00 | 77 | 0 |
| 090706 | 100.0 | 1.50e+00 | 1.24e+00 | SPL | -1.0 | -2.16 | -1000.00 | 20 | 0 |
| 090708 | 18.0 | 4.00e-01 | 1.00e+00 | PL+HEC | 47.5 | -1.29 | -1000.00 | 55 | 0 |
| 090709B | 32.0 | 1.30e+00 | 2.00e+00 | PL+HEC | 130.0 | -1.01 | -1000.00 | 35 | 0 |
| 090711 | 100.0 | 1.17e+01 | 4.20e+00 | PL+HEC | 210.0 | -1.30 | -1000.00 | 13 | 0 |
| 090712 | 72.0 | 4.20e+00 | 6.30e-01 | PL+HEC | 505.0 | -0.68 | -1000.00 | 33 | 0 |
| 090713 | 113.0 | 3.70e+00 | 1.60e+00 | PL+HEC | 99.0 | -0.34 | -1000.00 | 63 | 0 |
| 090717A | 70.0 | 4.50e-01 | 7.80e+00 | Band | 120.0 | -0.88 | -2.33 | 70 | 0 |
| 090717B | 0.9 | 4.83e-01 | 3.91e+00 | SPL | -1.0 | -1.02 | -1000.00 | 35 | 0 |
| 090718A | -1.0 | -1.00e+00 | -1.00e+00 | * | -1.0 | 1000.00 | -1000.00 | 51 | 0 |
| 090718B | 28.0 | 2.52e+01 | 3.20e+01 | Band | 184.0 | -1.18 | -2.59 | 76 | 0 |
| GRB name | t90 | fluence | peakflux | Function | Epeak | LAT | |||
|---|---|---|---|---|---|---|---|---|---|
| sec | erg/cm2 | ph/cm2/sec | keV | ||||||
| 090719 | 16.0 | 4.83e+01 | 3.78e+01 | Band | 254.0 | -0.68 | -2.92 | 88 | 0 |
| 090720A | 7.0 | 2.90e+00 | 1.09e+01 | PL+HEC | 117.5 | -0.75 | -1000.00 | 113 | 0 |
| 090720B | 20.0 | 1.06e+01 | 1.09e+01 | Band | 924.0 | -1.00 | -2.43 | 56 | 0 |
| 090802A | 0.1 | 6.50e-01 | 6.12e+01 | Band | 283.0 | -0.42 | -2.40 | 123 | 0 |
| 090802B | -1.0 | -1.00e+00 | -1.00e+00 | * | -1.0 | 1000.00 | -1000.00 | 104 | 0 |
| 090807B | 3.0 | 1.02e+00 | 1.09e+01 | Band | 37.0 | -0.60 | -2.40 | 45 | 0 |
| 090809B | 15.0 | 2.26e+01 | 2.36e+01 | Band | 198.0 | -0.85 | -2.02 | 81 | 0 |
| 090813 | 9.0 | 3.50e+00 | 1.44e+01 | Band | 95.0 | -1.25 | -2.00 | 35.3 | 0 |
| 090814C | 0.2 | 6.60e-01 | 9.10e+00 | PL+HEC | 790.0 | -0.39 | -1000.00 | 61 | 0 |
| 090815A | 200.0 | 3.40e+00 | 1.90e+00 | SPL | -1.0 | -1.50 | -1000.00 | 87 | 0 |
| 090815B | 30.0 | 5.05e+00 | 1.44e+01 | Band | 18.6 | -1.82 | -2.70 | 82 | 0 |
| 090817 | 220.0 | 7.30e+00 | 3.80e+00 | Band | 115.0 | -1.10 | -2.20 | 82 | 0 |
| 090820A | 60.0 | 6.60e+01 | 5.80e+01 | Band | 215.0 | -0.69 | -2.61 | 108 | 0 |
| 090820B | 11.2 | 1.16e+00 | 6.10e+00 | PL+HEC | 38.8 | -1.44 | -1000.00 | 32 | 0 |
| 090826 | 8.5 | 1.26e+00 | 3.28e+00 | PL+HEC | 172.0 | -0.96 | -1000.00 | 35 | 0 |
| 090828 | 100.0 | 2.52e+01 | 1.62e+01 | Band | 136.5 | -1.23 | -2.12 | 95 | 0 |
| 090829A | 85.0 | 1.02e+02 | 5.15e+01 | Band | 183.0 | -1.44 | -2.10 | 47 | 0 |
| 090829B | 100.0 | 6.40e+00 | 3.20e+00 | Band | 143.0 | -0.70 | -2.40 | 42 | 0 |
| 090831 | 69.1 | 1.66e+01 | 9.40e+00 | Band | 243.8 | -1.52 | -1.96 | 107 | 0 |
| 090902A | 1.2 | 2.11e+00 | 1.14e+01 | Band | 388.0 | 0.30 | -2.05 | 82 | 0 |
| 090902B | 21.0 | 3.74e+02 | 4.61e+01 | Band | 798.0 | -0.61 | -3.87 | 52 | 1 |
| 090904B | 71.0 | 2.44e+01 | 9.80e+00 | Band | 106.3 | -1.26 | -2.18 | 113 | 0 |
| 090910 | 62.0 | 9.20e+00 | 2.30e+00 | Band | 274.8 | -0.90 | -2.00 | 107 | 0 |
| 090922A | 92.0 | 1.14e+01 | 1.56e+01 | Band | 139.3 | -0.77 | -2.28 | 19 | 0 |
| 090925 | 50.0 | 9.46e+00 | 4.20e+00 | Band | 156.0 | -0.60 | -1.91 | 116 | 0 |
| 090926A | 20.0 | 1.45e+02 | 8.08e+01 | Band | 268.0 | -0.69 | -2.34 | 52 | 1 |
| 090926B | 81.0 | 8.70e+00 | -1.00e+00 | PL+HEC | 91.0 | -0.13 | -1000.00 | 100 | 0 |
| 090927 | 2.0 | 6.10e-01 | 7.20e+00 | SPL | -1.0 | -1.47 | -1000.00 | 85 | 0 |
| 090929A | 8.5 | 1.06e+01 | 1.09e+01 | PL+HEC | 610.9 | -0.52 | -1000.00 | 122 | 0 |
| 091003A | 21.1 | 3.76e+01 | 3.18e+01 | Band | 486.2 | -1.13 | -2.64 | 13 | 1 |
: Best fit parameters , , and and their 1- confidence levels. For each fit we report the values corresponding to the best fit (). Also shown are the parameter for a LF, LFb, that fit quite well all the samples, the for all the instruments
| sample | Rate(z=0) | ||||
|---|---|---|---|---|---|
| erg/sec | |||||
| GBM | 1.1 | ||||
| BATSE | 1.1 | ||||
| Swift | 0.95 | ||||
| LFb | 1.3 |
5 Acknowledgements
We are grateful to Eli Waxman for very helpful comments and discussions. We thank Nicola Omodei, Toby Burnett and David Croward for very useful discussions.
References
- Abdo et al. 2009, Science, 323, 1688.
- Abdo et al. 2009, astro-ph/0908.1832.
- Amati, Frontera, Guidorzi 2009, astro-ph/0907.0384.
- Ando, S., Nakar, E. & Sari, R. 2008, ApJ 689, 1150.
- Atwood, W., et al. 2009, Ap. J., 697, 1071
- Band, D., 2003, ApJ 588, 945.
- Band, D. 2009, ApJ 701, 1673B.
- Bissaldi et al. 2009, astro-ph/0909.2470.
- Cash, W. 1979, Ap. J., 228, 939
- Cohen E., Piran T., 1995, ApJ, 444, L25
- Dingus, B. 1995, Astrophysics and Space Science 231, 187.
- Fan, Y.Z. 2009, MNRAS 397, 1539.
- Fenimore, E. & Bloom, J. 1995, ApJ 453, 25.
- Ghirlanda, Nava, & Ghisellini 2009, astro-ph/0908.2807
- Gilmore, Prada, & Primack 2009, astro-ph/0908.2830.
- Giuliani et al. 2008, A&A, 491.
- Giuliani et al. 2009, astro-ph/0908.1908.
- Gonzalez, M. M. et al. 2003, Nature, 424, 749
- Granot 2009, astro-ph/0905.2206
- Guetta, D., Piran, T. & Waxman E., 2005, ApJ, 619, 412.
- Guetta, D., & Piran, T. 2005, A&A, 435, 421
- Guetta, D., & Piran, T. 2006, A&A, 453, 823
- Guetta, D., & Piran, T. 2007, JCAP 07, 3
- Guetta, D., Pian, E. & Waxman, E. in preparation.
- Horack, J. & Hakkila, J. 1997, ApJ 479, 371.
- Hurley, K. 1994, Nature 372, 652.
- Kaneko, Y. et al. 2008, ApJ 677, 1168
- Kumar & Barniol Duran 2009, astro-ph/0905.2417
- Li 2009, astro-ph/0810.2932.
- Loredo, T. & Wasserman, I. 1995, ApJS 96, 26
- Loredo, T. & Wasserman, I. 1998, ApJ 502, 75
- Marisaldi, M. et al. 2009, astro-ph/0906.1446.
- Mattox, J. R. et al. 1996, ApJ 461, 396
- Neyman, J., & Pearson, E. 1928, Biometrika
- Piran, T. 1992, ApJ 389, L45.
- Pollock, A. M. T. et al. 1985, A&A 146, 352
- Pollock, A. M. T. et al. 1981, A&A 94, 116
- Salvaterra, R. et al. 2009, astro-ph/0906.1578 Nature in press.
- Schmidt, M., 1999, ApJ 559, L79.
- Schmidt, M., 2001, ApJ 559, L79.
- Sethi, S. & Bhargavi, S. G. 2001, A&A 376, 10.
- Tanvir, N. et al. 2009, astro-ph/0906.1577 Nature in press.
- Zhang & Pe’er 2009, astro-ph/0904.2943.
- Zou, Fan, Piran 2009, astro-ph/0811.2997.