Simultaneous Multiwavelength observation of Mkn 501 in a low state in 2006
Abstract
We present results of the multiwavelength campaign on the TeV blazar Mkn 501 performed in 2006 July, including MAGIC for the very-high-energy (VHE) -ray band and Suzaku for the X-ray band. A VHE -ray signal was clearly detected with an average flux above 200 GeV of 20% of the Crab Nebula flux, which indicates a low state of source activity in this energy range. No significant variability has been found during the campaign. The VHE -ray spectrum can be described by a simple power-law from 80 GeV to 2 TeV with a photon index of , which corresponds to one of the steepest photon indices observed in this energy range so far for this object. The X-ray spectrum covers a wide range from 0.6 to 40 keV, and is well described by a broken power law, with photon indices of and below and above the break energy of keV. No apparent high-energy cut off is seen above the break energy. Although an increase of the flux of about 50 % is observed in the X-ray band within the observation, the data indicate a consistently low state of activity for this source. Time-resolved spectra show an evidence for spectral hardening with a flux level. A homogeneous one-zone synchrotron self-Compton (SSC) model can adequately describe the spectral energy distribution (SED) from the X-ray to the VHE -ray bands with a magnetic field intensity G and a Doppler beaming factor , which are similar to the values in the past multiwavelength campaigns in high states. Based on our SSC parameters derived for the low state, we are able to reproduce the SED of the high state by just changing the Lorentz factor of the electrons corresponding to the break energy in the primary electron spectrum. This suggests that the variation of the injected electron population in the jet is responsible for the observed low-high state variation of the SED.
1 Introduction
Blazars are radio-loud active galactic nuclei (AGNs) viewed at small angles between the jet axis and our line of sight. The bulk relativistic motion of the emitting plasma causes the radiation to be beamed in a forward direction, making the variability appear more rapid and the luminosity appear higher than in the rest frame due to the relativistic beaming effect (e.g., Rees, 1966; Ghisellini et al., 1993).
Blazars with only weak or entirely absent emission lines in the optical band are classified as BL Lacertae Objects (BL Lacs). Their spectral energy distributions (SEDs: in ) are characterized by a two-bump structure (Fossati et al., 1998). Since the discovery of the first extra-galactic TeV-photon emitter, Mkn421 (Punch et al., 1992), very-high-energy (VHE: 80 GeV) emission has been confirmed in more than 20 BL Lac objects. The SEDs of many of those BL Lacs show the peaks of the lower energy bump at UV to X-ray energies. These objects belong to the sub-class known as ”High-frequency peaked BL Lacs (HBLs)” (Padovani & Giommi, 1995). Their non-thermal emission in this lower energy bump is commonly ascribed to synchrotron radiation from relativistic electrons, accelerated in the jet moving with relativistic bulk speed (e.g., Ghisellini et al., 1998). The two-bump structure in SEDs of HBLs has been well explained by synchrotron self-Compton (SSC) models, where the target photons of inverse-Compton scattering for the higher energy bump are the synchrotron photons produced by the same electron population (e.g., Costamante & Ghisellini, 2002). In this model the high energy end of the electron spectrum is responsible for both X-ray and VHE -ray emission. The observed correlations of the X-ray and VHE -ray fluxes during large flares of VHE -ray emitting HBLs (e.g., Takahashi et al., 1996; Maraschi et al., 1999; Krawczynski et al., 2001) provide strong experimental evidence for the SSC mechanism for HBLs. The target photons could also be produced in the accretion disk (Dermer & Schlickeiser, 1993) or in the broad-line region (e.g., Sikora et al., 1994). Alternatively, the high-energy emission can be also due to pions produced by accelerated protons and ions and subsequent pion decay (Mannheim, 1993) or direct synchrotron emission from high-energy protons (Aharonian, 2000).
The results of applying emission models to the data can provide information on physical parameters of the jet, such as the co-moving magnetic field, the population of the accelerated electrons, the Doppler boosting factor and the size of the emitting region. HBLs often show strong flux variability on time scales of less than 1 hr (Gaidos et al., 1996; Aharonian et al., 2007; Albert et al., 2007b). Hence, simultaneous multiwavelength observations over a wide energy range, covering in particular X-ray and VHE -ray bands, are essential to study the physics of these high-energy radiation emitters.
Until a few years ago, simultaneous multiwavelength observations were only possible during flaring states due to the low sensitivity of the participating -ray telescopes. In the VHE -ray band, new generation of Imaging Atmospheric Cherenkov Telescopes (IACTs) such as MAGIC, H.E.S.S., and VERITAS, can access the energy range from below 100 GeV up to several TeV. These instruments also allow us to detect GeV-TeV -ray signals within short observation times (several hours) even in quiescent source states. A comparison of emission model parameters for several different source states may allow us to reveal the origin of the jet activity.
The Suzaku X-ray satellite (see section 2.2) features the most sensitive instruments among current X-ray detectors for time-resolved coverage of a wide X-ray energy band, from the soft to the hard X-ray energies, well beyond 10 keV. Suzaku already performed observations of several known TeV HBLs and successfully obtained time-resolved spectra up to hard X-ray energies (Sato et al., 2008; Tagliaferri et al., 2008; Reimer et al., 2008). The capability to perform successful multiwavelength observations for TeV-HBLs with MAGIC and Suzaku even in quiescent states has been shown in Tagliaferri et al. (2008) and Reimer et al. (2008).
Mkn 501 (redshift ) is categorized as an HBL and was the second established TeV blazar (Quinn et al., 1996). In 1997 this source went into a state of surprisingly high activity. The detected flux was 10 times higher than that of the Crab Nebula in the VHE -ray regime; the high energy photons were observed up to 20 TeV (Aharonian et al., 2001). At the same time, BeppoSAX also observed a flaring activity in the X-ray band (Catanese et al., 1997; Pian et al., 1998; Tavecchio et al., 2001). The observed X-ray data showed an exceptionally hard spectrum with a synchrotron peak at (or above) 100 keV. This represents a shift of at least two orders of magnitude with respect to previous observations. Gliozzi et al. (2006) organized a long-term monitoring campaign in 2004, also covering the X-ray and TeV energy bands. They confirm the presence of a direct correlation between X-ray and VHE -ray emission, which appears to be stronger when the source is brighter. In 2005, when MAGIC observed the object between May and July, the source flux varied by an order of magnitude. During the two most active nights, rapid VHE -ray flux variability with a doubling time of a few minutes was observed (Albert et al., 2007b). Several extensive SED studies based on multiwavelength observations of this object were reported (e.g., Kataoka et al., 1999; Krawczynski et al., 2000; Sambruna et al., 2000; Tavecchio et al., 2001; Ghisellini et al., 2002). However, the multiwavelength observations that included VHE -ray and X-ray instruments were only conducted during flaring states, but no simultaneous X-ray and VHE -ray data were available for a low state of activity.
In 2006 July, a joint multiwavelength campaign between MAGIC, Suzaku, and the Kungliga Vetenskaplika Academy (KVA) optical telescope111http://tur3.tur.iac.es/ was organized to observe Mkn 501. We succeeded in obtaining clear detections from the simultaneous observations both in the VHE -ray band by MAGIC and in the X-ray band by Suzaku. In this paper, we report the observational results of this campaign. The observations and data reduction for both instruments are briefly described in Section 2. In Section 3, we present the results of the measured light curves and spectra for each energy band. In Section 4, we discuss the application of a simple one-zone SSC model to the SEDs obtained in this campaign and compare those to the historical data from flaring states. Finally, we summarize our results in Section 5.
2 Observations and data reduction
2.1 VHE -Ray band: MAGIC
The MAGIC telescope is an IACT with a 17m diameter dish, located at the Canary Island La Palma (28∘.2 N, 17 W, 2225 m a.s.l.).
In 2006, Mkn 501 was observed by MAGIC between July and September. The observations were performed in the so-called wobble mode (Daum et al., 1997), where the object is observed with an offset from the camera center. With this observation mode, ON- and OFF-data samples can be extracted from the same observation run; in our case, we used three OFF regions to estimate the background. As a part of the multiwavelength campaign, intensive observations were conducted during three nights on July 18th, 19th, and 20th with a total observation time of 10.5 hr. In eight additional nights, MAGIC pointed at this source for only a few tens of minutes each time as a part of an extended monitoring program. In total, 4.2 hr were spent for these additional monitoring observations. After rejecting the data with anomalous trigger rate due to bad observation conditions, the remaining good quality data were further analyzed. Data taken under large zenith angles () were also excluded to maintain the low energy threshold.
A shower image cleaning was applied based on the charge amplitude and time information in each pixel (Albert et al., 2008a). Every cleaned event was parameterized using the so-called Hillas parameterization (Hillas, 1985). These parameters were used for /hadron separation and energy estimation of -ray events by means of the ”Random Forest (RF)” method (Albert et al., 2008b). In the RF method, Monte-Carlo simulated -ray samples (Majumdar et al., 2005) with the same zenith angle range as the data were used as -ray training sample while real data were used as hadron-event background sample. The -ray signal was extracted on the basis of the DISP method (Domingo-Santamaría et al., 2005); a cut on the parameter (the squared angular distance between the nominal source position and the reconstructed -ray direction) was applied to determine the -ray signal (Albert et al., 2007a). Final spectra were derived using an unfolding technique (Albert et al., 2007c). More detailed information on the standard analysis steps and performance of the MAGIC telescope are given in Albert et al. (2008a). As quoted in that paper, we estimate a systematic energy scale error of 16%, a systematic error of 11% on the flux normalization (without the energy scale error), and a systematic slope error of .
For the multiwavelength campaign, based on 9.1 hrs of good quality data an excess of 1513 events over 26112 normalized background events yielding a significance of 8.0 was obtained for the following analysis. We note that tighter cuts that only selected data of a shower image size ¿ 350 photoelectrons (corresponding to a -ray energy peak of about 250 GeV) with a resulted in an increased 13.4 significance.
2.2 X-Ray band: Suzaku
The joint Japanese-US satellite Suzaku (Mitsuda et al., 2007), launched successfully into orbit on 2005 July 10, covers a wide energy range of 0.2-600 keV. Suzaku carries four sets of X-ray telescopes (Serlemitsos et al., 2007) each with a focal plane X-ray CCD camera (X-ray Imaging Spectrometer (XIS); Koyama et al., 2007), covering an energy range of 0.3-12 keV. Three of the XIS (XIS 0,2,3) detectors have front-illuminated (FI) CCDs, while the XIS-1 utilizes a back-illuminated (BI) CCD. The merit of the BI CCD is its improved sensitivity in the soft X-ray energy band below 1 keV. Suzaku also features a non-imaging collimated Hard X-ray Detector (HXD; Takahashi et al., 2007), consisting of PIN silicon diodes for the lower energy band (10–70 keV) and GSO scintillators for the higher energy band (40–600 keV). Suzaku observations can be conducted using two default pointing positions, the XIS nominal position and the HXD nominal position. In this observation for the multiwavelength campaign, we used the HXD nominal position to maximize the effective area of the HXD. In the following analysis, the HXD/GSO data are not used because there is no significant detection above the 3 level.
X-ray observations by Suzaku were carried out between 2006 July 18, 18:33:00 UTC and 2006 July 19, 17:27:00 UTC (sequence number 071727010). All XIS sensors were operated with 1/4 window option in order to reduce possible pile-up effects. In total 35 ks of good time intervals (GTIs) is obtained for each XIS and HXD detector after screening criteria as described in the following.
The XIS data used in this paper were reduced via the Suzaku software version 2.0. The screening was based on the following criteria: (1) ASCA-grade 0,2,3,4 and 6 events were accumulated, and the CLEANSIS script was used to remove hot or flickering pixels. (2) The time interval after the passage of the South Atlantic Anomaly is greater than 500 s. (3) Data were selected to be 5o in elevation above the rim of the Earth (ELV) (20o above the day-Earth rim). The XIS events were extracted from a circular region with a radius of centered on the source peak, whereas the background was accumulated in an annulus with inner and outer radii and , respectively. The response (RMF) and auxiliary files (ARF) are produced using the analysis tools XISRMFGEN and XISSIMARFGEN developed by the Suzaku team (Ishisaki et al., 2007), which are included in the software package HEAsoft version 6.5.
The HXD/PIN data (ver.2.0) were processed with basically the same screening criteria as those for the XIS, except for ELV through night and day and a cutoff rigidity 8 GeV/. The HXD/PIN instrumental background spectra were provided by the HXD team for each observation (Fukazawa et al., 2006; Kokubun et al., 2007). The HXD/PIN data also include another background component, the so-called, cosmic X-ray background (CXB). In our analysis, we use the CXB spectrum (Gruber et al., 1999) as
| (1) |
The observed spectrum was derived assuming the PIN-detector response is isotropic for diffuse emission. Both the source and background spectra were made with identical GTIs, and the exposure was corrected for detector deadtime of 6.0%. We use the response file version ae_hxd_pinhxdnom2_20080129.rsp.
Spectral analysis in the X-ray band was performed using XSPEC version 11.3.2. Each XIS spectrum is binned such that each bin contains at least 40 counts. After the binning, we ignored bins with energies below 0.6 keV and above 10 keV. We also excluded bins between 1.7 and 1.9 keV because there exist large systematic uncertainties in the response matrices. Based on a contemporaneous fit to the Crab spectra, Serlemitsos et al. (2007) reported that the normalizations among the CCD sensors are slightly different (by a few %). A relative normalization of HXD/PIN detector to the CCD cameras also needs to be taken into account (Kokubun et al., 2007). Therefore, the XIS-2, XIS-3 and HXD/PIN spectra were scaled by a constant factor with respect to the XIS-0 spectrum.
3 Results
3.1 Light curves
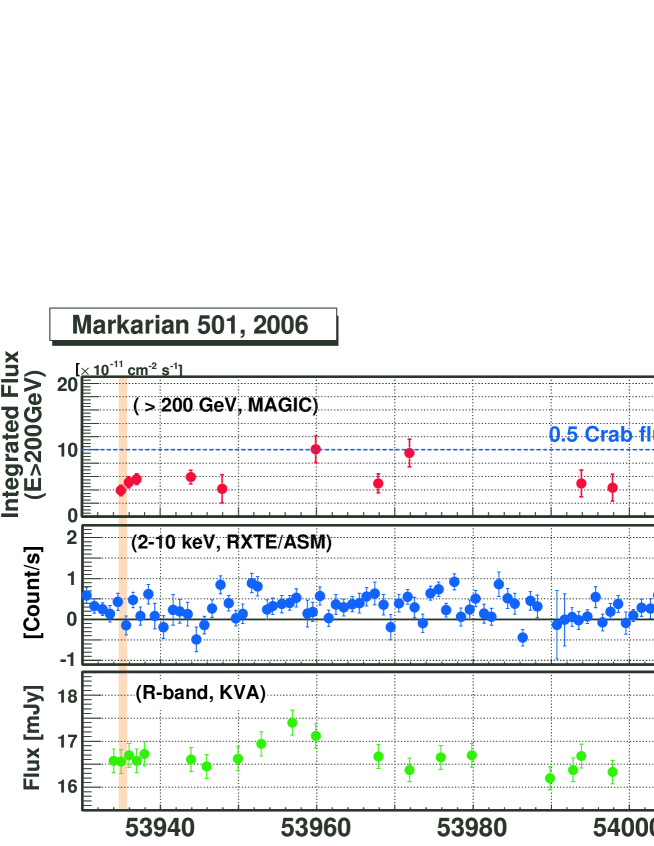
Figure 1 shows the diurnal light curves for Mkn 501 in 2006 with the VHE -ray emission above 200 GeV as measured by MAGIC, public X-ray data taken by RXTE/ASM222http://xte.mit.edu/ASM_lc.html and optical -band data provided by the Tuorla Observatory Blazar Monitoring Program333more information at http://users.utu.fi/kani/1m/ using KVA. In 2006, the source generally showed a low state of activity in the VHE -ray band, in contrast to 2005 when the flux varied by an order of magnitude up to 3.5 Crab units (Albert et al., 2007b). Such a strong flare activity is not found neither in the X-ray nor the optical bands between 2006 July and September.
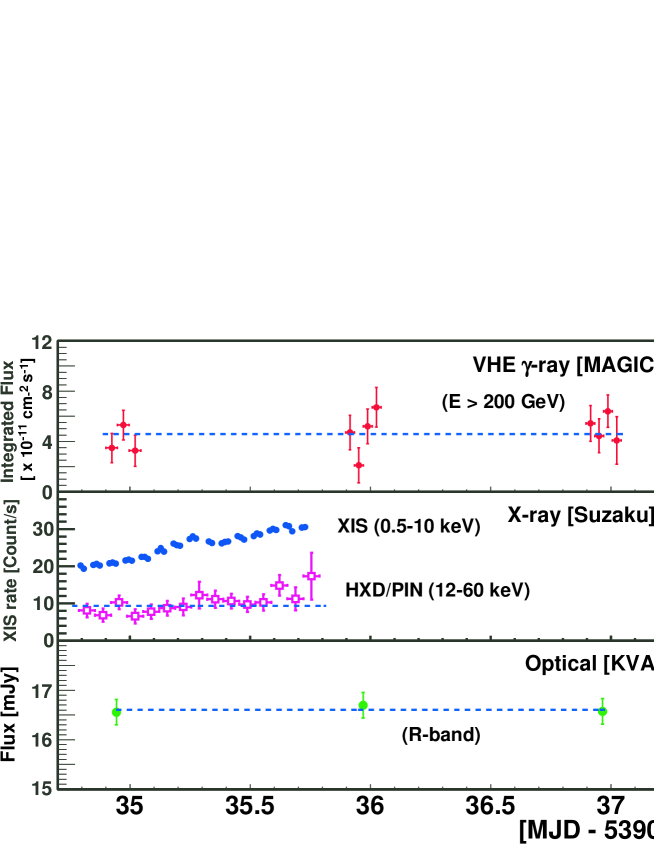
The light curves during the multiwavelength campaign in different energy bands taken by MAGIC, Suzaku and KVA are shown in Figure 2. The binning of the VHE -ray data is 1 hr. The average integrated flux above 200 GeV is , which corresponds to about 23% of the Crab Nebula flux as measured by the MAGIC telescope (Albert et al., 2007b). No significant variability is found. However, due to the low source flux level, we could only have seen variability if the flux were to increase by a factor of 2-3.
X-ray count rates of Mkn 501 recorded with the 4 XIS detectors (0.5-10 keV) and the HXD/PIN detector (12-60 keV) are plotted in the middle panel of Figure 2. Each point represents the rate in a time interval of 1440 s for the XIS and 5760 s interval for the HXD/PIN. The X-ray count rate in the XIS shows clear variability (1 for a constant flux fit). It gradually rises during the observation and an overall increase of about 50% can be seen. The HXD/PIN count rate also seems to follow that increasing trend, but a fit with a constant value yields . The optical -band flux is also consistent with a constant value with an average of 16.60.1 mJy.
3.2 Spectra
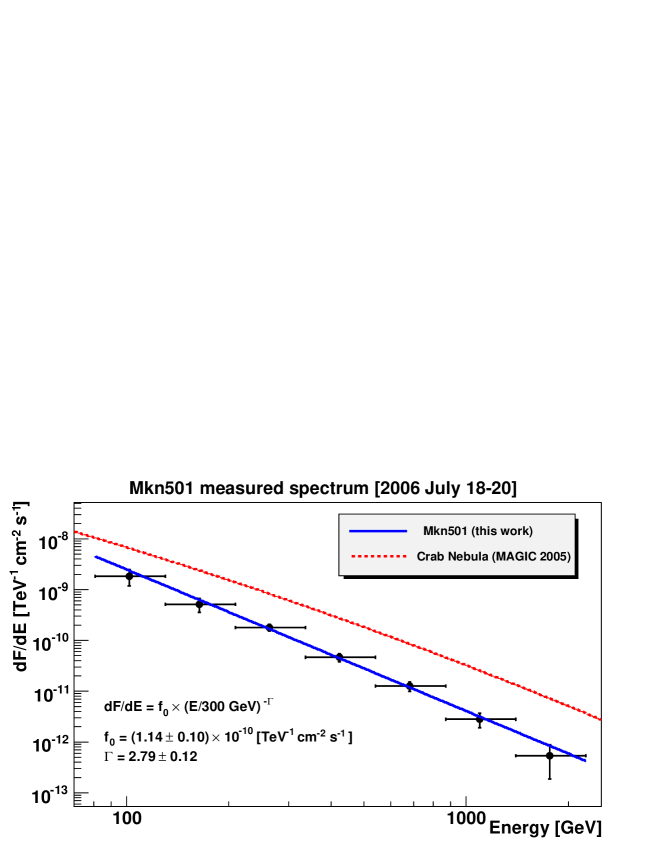
Figure 3 shows the unfolded differential spectrum in the VHE -ray band, averaged over the three days during the campaign. It is well described by a simple power law from 80 GeV to 2 TeV (with ):
| (2) |
An independent analysis gives results in very good agreement with those quoted numbers. The flux level and the photon index of this spectrum are similar to those in the lowest state among the MAGIC results in 2005 which were presented on a night-by-night basis in Albert et al. (2007b).
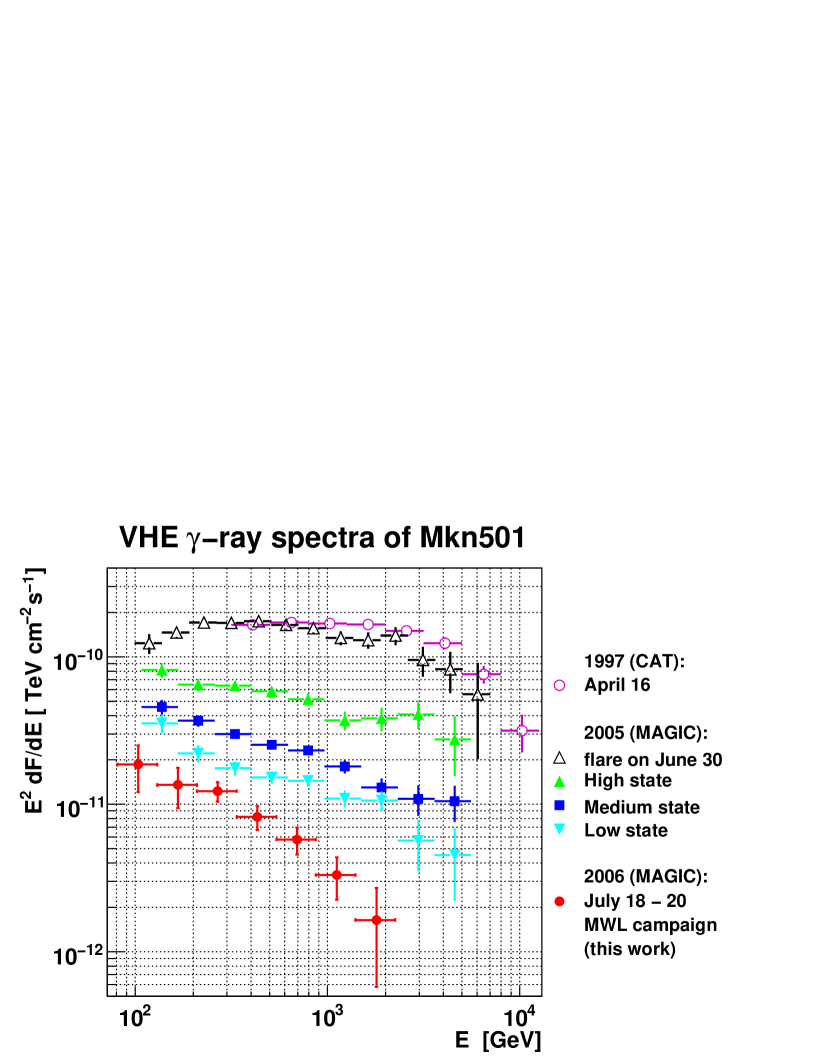
Figure 4 shows the Mkn 501 -ray spectrum obtained during this multiwavelength campaign together with four spectra measured by MAGIC in 2005 (Albert et al., 2007b) and a spectrum by CAT Cherenkov imaging Telescope on 1997 April 16 (Djannati-Atai et al., 1999). As described in Albert et al. (2007b), the 2005 MAGIC data were subdivided into three groups, i.e., low-, medium- and high-states depending on the diurnal integral flux level. The other MAGIC spectrum corresponds to data taken during a strong flare on 2005 June 30. The CAT data were taken in 1997 during a previous multiwavelength campaign with the BeppoSAX X-ray satellite when the source was in a flaring state. Historically, spectra of Mkn 501 in the VHE -ray band have shown strong variability, and different features of the variability can be seen depending on the energy bands as shown in Figure 4. The difference in flux at 1 TeV reaches almost two orders of magnitude, while a difference of only a factor of 2-3 in the flux can be seen around 100 GeV. The spectrum gets harder as the source flux increases. The energy of the spectral peak, which we consider to be the inverse-Compton peak, can be seen above 100 GeV in the highest flux states (on 1997 April 16 by CAT and on 2005 June 30 by MAGIC), while the peak seems to be located well below 100 GeV in the 2006 observations.
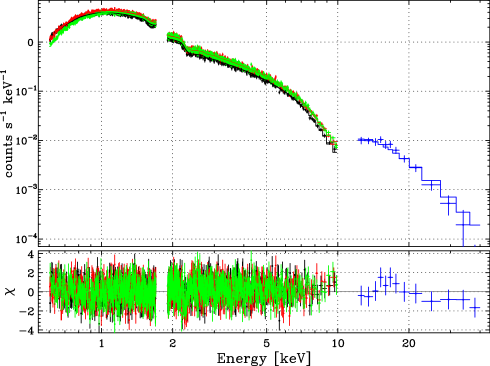
In the 0.6–40 keV X-ray band, we perform a joint fitting with three FI-XISs (XIS-0, 2 and 3: 0.6–10 keV) and HXD/PIN (12–40 keV) to derive a spectrum. A fixed value of the galactic column density at cm-2 (Stark et al., 1992) is used for the galactic absorption. The normalization of the HXD/PIN with respect to XIS-0 is fixed to be 1.15 as reported in Kokubun et al. (2007). A simple power-law fit yields a photon index of , but this model gives an unacceptable fit (a reduced =1.107 with 3893 d.o.f: probability%). Fitting with a broken power law, we obtain a significantly improved fit (a reduced = 1.050 with 3891 d.o.f: probability%) with the best-fit photon indices of and below and above the break energy keV, respectively. The constant factors for XIS-2 and XIS-3 are and , respectively, which are within the values previously reported in Serlemitsos et al. (2007). A double-broken power-law model does not improve the fit at all. Figure 5 shows background-subtracted folded count spectra of the three FI XISs and HXD/PIN with residuals for the broken power law, using the fixed Galactic column density. The best-fit parameters and associated errors are summarized in Table 1. These derived fit parameters are in good agreement with the results from the XIS data (0.6 -10 keV) fit alone. It suggests that there is no significant change (e.g., high-energy cut-off) in the spectrum between and 40 keV. The photon index below the break () clearly shows a softer value than 2. This indicates that the synchrotron peak is located at energies below the XIS range, i.e., lower than 0.6 keV.
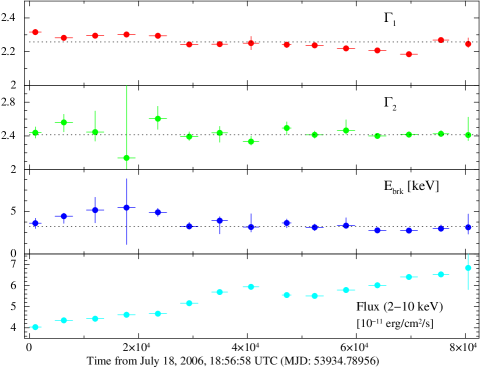
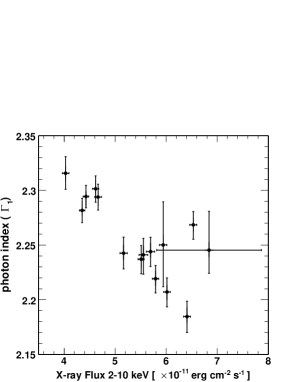
We also attempted to fit time-resolved broken power-law spectra. The temporal behavior of three parameters, , , and the break energy, as well as the model flux between 2 and 10 keV, are presented in Figure 6 with a 5760 s interval. The normalization factors for the XISs were the same as stated above (see Table 1). The model flux increases, similar to the XIS count rate. Figure 7 shows a scatter plot between the model flux between 2 and 10 keV and the photon index . A spectral hardening trend by 0.15 can be seen in as the flux increases with a correlation coefficient of . On the other hand, the other parameters do not show strong, flux-dependent variations.
Although the X-ray data show some variability (increase by 50 %), given the low flux level, it is still much less than the a factor of 2 that would be needed to clearly detect the variability in the VHE -ray range. Thus, in the following section we discuss the broad band SED of Mkn 501 using average spectra in both VHE -ray and X-ray bands taken during this multiwavelength campaign.
4 Discussion
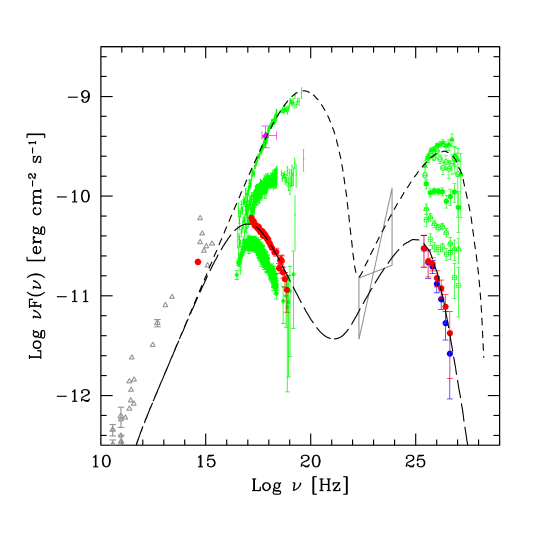
Figure 8 shows the overall SEDs of Mkn 501 with data obtained during this multiwavelength campaign as well as some historical data. The flux in the VHE -ray band is corrected for absorption by the extra-galactic background light (EBL) using the ”low-IR” model of Kneiske et al. (2004). In our optical data, the host galaxy contribution (mJy) (Nilsson et al., 2007) has already been subtracted.
Assuming a uniform injection of the electrons throughout a homogeneous emission region, we applied a one-zone SSC model, developed by Tavecchio et al. (1998, 2001), to our campaign data for estimating physical parameters of the emitting region. A spherical shape (blob) of radius is adopted for the emission region, filled with a tangled magnetic field of intensity . The electron distribution is described by a smoothed broken power-law energy distribution with slopes from to the break energy and up to a limit of and with a normalization factor . The relativistic effect is taken into account by the Doppler beaming factor .
The radius, , is selected to be cm, corresponding to the value reported in Albert et al. (2007b) for the SEDs observed in 2005. is set to be since no cut-off in the high energy ends of both the X-ray and the VHE -ray spectra is detected. is fixed at 1 as a nominal value because this parameter does not affect the emission in the energy bands of our data. Since the data do not clearly indicate the positions of the synchrotron and inverse-Compton peaks, we cannot fully constrain the SSC parameters by precise fits to the SEDs. In addition, variability timescales cannot be determined for the data because of the quiescent state of the source. Therefore, our aim is to reproduce the observed spectral behavior and correlations within a simple unifying picture rather than entering in details of the jet structure.
First, we applied the SSC model for the low state SED which is obtained during our multiwavelength campaign in 2006. The one-zone SSC model can reproduce the measured X-ray and VHE -ray spectra in this low state of activity of the source as shown in Figure 8. However, it is apparent that the model in Figure 8 underestimates the flux in a low energy range between radio and optical. Usually, homogeneous models cannot be used to explain the low frequency radio emission (see e.g., Pian et al., 1998) due to efficient self absorption. In previous studies, Katarzynski et al. (2001) used an inhomogeneous conical jet model proposed by Ghisellini et al. (1985) to explain radiation from the low radio frequency up to the ultraviolet of Mkn 501. Here, along the same lines, we consider the energy range between X-ray and TeV for our one-zone SSC model.
On the basis of model parameters for this low state, we attempted to reproduce the SED obtained during the flare on 2005 June 30, using the same SSC model. There are no simultaneous X-ray data other than RXTE/ASM available at that time. The measured flux by the RXTE/ASM (pink triangle in Figure 8) shows a compatible level in the X-ray spectrum to those taken by BeppoSAX (green dots in Figure 8) on 1997 April 16. In addition, the VHE -ray spectrum taken by MAGIC on 2005 June 30, was almost equivalent to the spectrum measured by CAT on 1997 April 16, as shown in Figure 4. Therefore, we used this BeppoSAX spectrum as a guide for the X-ray spectrum during the VHE -ray flare on 2005 June 30. With this, we can reproduce the SED in this high state just by changing , the Lorentz factor of the electrons at the break energy in the electron spectrum. The SSC models for the low and the high states of Mkn 501 are represented by dashed lines in Figure 8. The derived parameters for these SSC models are listed in Table 2.
In Table 3 we compare our results to some of the previous SED studies based on SSC models for Mkn 501. All of those were derived from applying one-zone SSC models to actual observational data. Not all studies used simultaneous X-ray and VHE -ray data. In fact, most simultaneous X-ray and VHE -ray data were taken during the huge outbursts in 1997. Nevertheless, the SSC model parameters of and from our multiwavelength campaign in 2006 indicate values similar to those of previous works for different flux states, apart from models of Sambruna et al. (2000) (lower ) for the medium flux state in 1998444however, they did not take into account the absorption by EBL in the VHE -ray data., and of Konopelko et al. (2003) (higher and lower ) for the high flux state in 1997. Those parameters are also consistent with values in Bednarek & Protheroe (1999), who constrain the parameters of the emission region based on the variability time scale during the 1997 April 15-16 flaring activity. Note again that only our work used simultaneous X-ray and VHE -ray data taken in a low flux state.
Tavecchio et al. (2001) attempted to model different emission states of Mkn 501 in 1997 and 1999 by mainly changing the break energy of electrons, slightly modifying its spectral slopes and number density, and by keeping other parameter unchanged. Also Pian et al. (1998) could reproduce different flux states by changing only the electron distribution, keeping the same values for other parameters. In these frameworks, the electron spectrum is the key component representing the different activity states of Mkn 501; especially, can play a major role there.
From the physical point of view, in the context of the widely discussed diffusive shock acceleration models (Kirk et al., 1998; Henri et al., 1999) the variations of (and the other parameters specifying the particle acceleration) could be explained by changes of the parameters determining the efficiency of the acceleration mechanisms (such as the parameters characterizing the turbulence). A deeper discussion of this point is clearly beyond the scope of this paper.
5 Summary
We present first results of a multiwavelength campaign for the TeV blazar Mkn 501 during its low state of activity observed by MAGIC and Suzaku in 2006 July.
-
•
VHE -ray signals were clearly detected at a 13.4 level from 9.1 hrs of data taken during the campaign. The average integrated flux above 200 GeV corresponds to about 23% of the Crab Nebula flux without significant variability detected in the data. The spectrum in the VHE -ray band is well described by a simple power law from 80 GeV to 2 TeV with a photon index of . The flux level and the photon index of this measured spectrum are compatible with those found in the lowest state among the MAGIC Mkn 501 observations in 2005.
-
•
The X-ray spectral shape derived from the Suzaku data from 0.6 keV up to 40 keV is well described by a broken power-law without a need for a high energy cut-off. The derived photon index suggests that the synchrotron peak is located below 0.6 keV. The flux level in X-ray showed a low state of activity, in similarity to the VHE -ray flux. As the flux shows a small increase (50 %), the spectral index below the break energy shows a hardening trend by 0.15.
-
•
The overall SED in the low state during our multiwavelength campaign can be well represented by a homogeneous one-zone SSC model. Based on the SSC parameters for this low state, the high state SED in 2005 can be reproduced by changing only the Lorentz factor of the electrons corresponding to the break energy of the electron spectrum. This suggests that the variation of the injected electron population in the jet is responsible for the observed variation of the SED. In particular, the electron energy at the spectral break could be a key parameter to represent the different activity states of Mkn 501.
References
- Aharonian (2000) Aharonian, F., 2000, New Astronomy, 5, 377
- Aharonian et al. (2001) Aharonian, F., et al., 2001, A&A, 366, 62
- Aharonian et al. (2007) Aharonian, F., et al. 2007, ApJ, 664, L71
- Albert et al. (2007a) Albert, J., et al. 2007a, ApJ, 667, L21
- Albert et al. (2007b) Albert, J., et al. 2007b, ApJ, 669, 862
- Albert et al. (2007c) Albert, J. et al. 2007c, Nucl. Instrum. Methods Phys, Res. A, 538, 494
- Albert et al. (2008a) Albert, J., et al. 2008a, ApJ, 674, 1037
- Albert et al. (2008b) Albert, J., et al. 2008b, Nucl. Instrum. Methods Phys, Res. A, 588, 424
- Bednarek & Protheroe (1999) Bednarek, W. & Protheroe, R. J. 1999, MNRAS, 310, 577
- Catanese et al. (1997) Catanese, M., et al. 1997, ApJ, 480, 562
- Costamante & Ghisellini (2002) Costamante, L. & Ghisellini, G., 2002, A&A, 384, 56
- Daum et al. (1997) Daum, A., et al. 1997, AstroPart. Phys., 8, 1
- Dermer & Schlickeiser (1993) Dermer, C. D., & Schlickeiser, R., 1993, ApJ, 416, 458
- Djannati-Atai et al. (1999) Djannati-Atai, A., et al. 1999, A&A, 350, 17
- Domingo-Santamaría et al. (2005) Domingo-Santamaría, E., et al. 2005, in Proc. 29th Int. Cosmic Ray Conf. (Pune), 5, 363
- Fossati et al. (1998) Fossati, G., Maraschi, L., Celotti, A., Comastri, A., & Ghisellini, G. 1998, MNRAS, 299, 433
- Fukazawa et al. (2006) Fukazawa, Y., et al. 2006, Proc. SPIE, 6266, 62662L
- Gaidos et al. (1996) Gaidos, J., et al. 1996, Nature, 383, 319
- Ghisellini et al. (1985) Ghisellini, G., Maraschi, L., & Treves, A. 1985, A&A, 146, 204
- Ghisellini et al. (1993) Ghisellini, G., Padovani, P., Celotti, A., & Maraschi, L. 1993, ApJ, 407, 65
- Ghisellini et al. (2002) Ghisellini, G., Celotti, A., Fossati, & Costamante, L. 2002, A&A, 386, 833
- Ghisellini et al. (1998) Ghisellini, G., Celotti, A., Fossati, G., Maraschi, L., & Comastri, A. 1998, MNRAS, 301, 451
- Gliozzi et al. (2006) Gliozzi, M., Sambruna, R. M., Jung, I., Krawczynski, H., Horan, D., & Tavecchio, F. 2006, ApJ, 646, 61
- Gruber et al. (1999) Gruber, D. E., Matteson, J. L., Peterson, L. E., & Jung, G. V. 1999, ApJ, 520, 124
- Henri et al. (1999) Henri, G., Pelletier, G., Petrucci, P. O., & Renaud, N. 1999, Astroparticle Physics, 11, 347
- Hillas (1985) Hillas, A. M. 1985, Proc. 19th Int. Cosmic Ray Conf. (La Jolla), 3, 445
- Ishisaki et al. (2007) Ishisaki, Y., et al. 2007, PASJ, 59, 113
- Kataoka et al. (1999) Kataoka, J. et al. 1999, ApJ, 514, 138
- Katarzynski et al. (2001) Katarzynski, K. et al. 2001, A&A, 367, 809
- Kino et al. (2002) Kino, M., Takahara, F. & Kusunose, M. 2002, ApJ, 564, 97
- Kirk et al. (1998) Kirk, J. G., Rieger, F. M., & Mastichiadis, A. 1998, A&A, 333, 452
- Kneiske et al. (2004) Kneiske, T. M., Bretz, T., Mannheim, K., & Hartman, D. H. 2004, A&A, 413, 807
- Kokubun et al. (2007) Kokubun, M., et al. 2007, PASJ, 59, 53
- Konopelko et al. (2003) Konopelko, A. et al. 2003, ApJ, 597, 851
- Koyama et al. (2007) Koyama, K., et al. 2007, PASJ, 59, 23
- Krawczynski et al. (2000) Krawczynski, H. et al. 2000, A&A, 353, 97
- Krawczynski et al. (2001) Krawczynski, H., et al. 2001, ApJ, 559, 187
- Majumdar et al. (2005) Majumdar, P., et al. 2005, Proc. 29th Int. Cosmic Ray Conf. (Pune), 5, 203
- Mannheim (1993) Mannheim, K. 1993, A&A, 269, 76
- Maraschi et al. (1999) Maraschi, L., et al. 1999, Astroparticle Physics, 11, 189
- Mitsuda et al. (2007) Mitsuda, K., et al. 2007, PASJ, 59, 1
- Nilsson et al. (2007) Nilsson, K. et al. 2007, A&A, 475, 199
- Padovani & Giommi (1995) Padovani, P. & Giommi, P. 1995, ApJ, 444, 567
- Pian et al. (1998) Pian, E. et al. 1998, ApJ, 492, L17
- Punch et al. (1992) Punch, M., et al. 1992, Nature, 358, 477
- Quinn et al. (1996) Quinn, J., et al. 1996, ApJ, 456, L831
- Rees (1966) Rees, M. J. 1966, Nature, 211, 468
- Reimer et al. (2008) Reimer, A., et al. 2008, ApJ, 682, 775
- Sambruna et al. (2000) Sambruna, R. M., et al. 2000, ApJ, 538, 127
- Sato et al. (2008) Sato, R., et al. 2008, ApJ, 680, L9
- Serlemitsos et al. (2007) Serlemitsos, P. J., et al. 2007, PASJ, 59, 9
- Sikora et al. (1994) Sikora, M., Begelman, M. C., Rees, M. J., 1994, ApJ, 421, 153
- Stark et al. (1992) Stark, A. A., et al. 1992, ApJS, 79, 77
- Tagliaferri et al. (2008) Tagliaferri, G., et al. 2008, ApJ, 679, 102
- Takahashi et al. (1996) Takahashi, T., et al. 1996, ApJ, 470, L89
- Takahashi et al. (2007) Takahashi, T., et al. 2007, PASJ, 59, 35
- Tavecchio et al. (1998) Tavecchio, F., Maraschi, L & Ghisellini, G. 1998, ApJ, 509, 608
- Tavecchio et al. (2001) Tavecchio, F., et al. 2001, ApJ, 554, 725
| Model | const. | const. | const. | /d.o.f. | ||||
| (1) | (2) | (3) | (4) | [XIS2] (5) | [XIS3] (6) | [HXD/PIN] (7) | (8) | (9) |
| Suzaku XIS + HXD/PIN | ||||||||
| power law | – | – | 1.15 (fixed) | 1.107/3893 (%) | ||||
| broken power law | 1.15 (fixed) | 1.050/3891 (1.5%) | ||||||
| Galactic column density: (fixed) | ||||||||
Note. — Col. (1): model used to fit the data. Col. (2): photon index for the power law model, or low-energy photon index for the broken power law model. Col. (3): break energy [keV] for the broken power law model. Col. (4): high-energy photon index for the broken power law model. Col. (5,6,7): constant factors with respect to XIS1, for XIS2, XIS3 and HXD/PIN, respectively. Col. (8): flux in the 2-10 keV band, in units of [erg cm-2 s-1]. Col. (9): reduced degrees of freedom and corresponding probability.
| data | |||||||||
|---|---|---|---|---|---|---|---|---|---|
| cm | Gauss | particle/ | |||||||
| 2006 (low) | 20 | 1 | 0.313 | 2 | 3.9 | ||||
| 2005 (flare) | 20 | 1 | 0.313 | 2 | 3.9 |
| [G] | [cm] | Flux State11H: high state, M: medium state, L: low state (among historical data in X-ray. BeppoSAX (green) data in Figure 8 represent those states). Numbers represent the year when the corresponding data were taken. Previous works for ”L” use data taken in different years in different energy bands. | reference | |
|---|---|---|---|---|
| 15 | 0.8 | H (1997), M(1997) and L | Pian et al. (1998) | |
| 15 | 0.2 | L | Kataoka et al. (1999) | |
| 25 | 0.1 | H (1998) | Sambruna et al. (2000) | |
| 25 | 0.03 | M (1998) | Sambruna et al. (2000) | |
| 14 | 0.15 | H (1997) | Katarzynski et al. (2001) | |
| 14 | 0.15 | M (1997) | Katarzynski et al. (2001) | |
| 10 | 0.32 | H (1997), M (1997) and L | Tavecchio et al. (2001) | |
| 11 | 0.2 | L | Kino et al. (2002) | |
| 50 | 0.04 | H (1997) | Konopelko et al. (2003) | |
| 20 | 0.313 | H (2005), L (2006) | this work |