22institutetext: Leiden Observatory, Leiden University, Oort Gebouw, P.O. Box 9513, 2300 RA Leiden, The Netherlands
33institutetext: Jacobs University Bremen, P. O. Box 750 651, 28725, Bremen, Germany
Unveiling radio halos in galaxy clusters in the LOFAR era
Abstract
Aims. Giant radio halos are mega-parsec scale synchrotron sources detected in a fraction of massive and merging galaxy clusters. Radio halos provide one of the most important pieces of evidence for non-thermal components in large scale structure. Statistics of their properties can be used to discriminate among various models for their origin. Therefore, theoretical predictions of the occurrence of radio halos are important as several new radio telescopes are about to begin to survey the sky at low frequencies with unprecedented sensitivity.
Methods. In this paper we carry out Monte Carlo simulations to model the formation and evolution of radio halos in a cosmological framework. We extend previous works on the statistical properties of radio halos in the context of the turbulent re-acceleration model.
Results. First we compute the fraction of galaxy clusters that show radio halos and derive the luminosity function of radio halos. Then, we derive differential and integrated number count distributions of radio halos at low radio frequencies with the main goal to explore the potential of the upcoming LOFAR surveys. By restricting to the case of clusters at redshifts 0.6, we find that the planned LOFAR all sky survey at 120 MHz is expected to detect about 350 giant radio halos. About half of these halos have spectral indices larger than 1.9 and substantially brighten at lower frequencies. If detected they will allow for a confirmation that turbulence accelerates the emitting particles. We expect that also commissioning surveys, such as MS3, have the potential to detect about 60 radio halos in clusters of the ROSAT Brightest Cluster Sample and its extension (eBCS). These surveys will allow us to constrain how the rate of formation of radio halos in these clusters depends on cluster mass.
Key Words.:
Radiation mechanism: non–thermal - galaxies: clusters: general - radio continuum: general - X–rays: general1 Introduction
Radio halos are diffuse Mpc–scale radio sources observed at the center of of massive galaxy clusters (e.g. Feretti 2005; Ferrari et al. 2008, for reviews). These sources emit synchrotron radiation due to GeV electrons diffusing through G magnetic fields and provide the most important evidence of non-thermal components in the intra-cluster-medium (ICM).
Clusters hosting radio halos always show very recent or ongoing merger events (e.g., Buote 2001; Schuecker et al 2001; Govoni et al. 2004; Venturi et al. 2008). This suggests a connection between the gravitational process of cluster formation and the origin of these halos. Cluster mergers are expected to be the most important sources of non-thermal components in galaxy clusters. A fraction of the energy dissipated during these mergers could be channelled into amplification of the magnetic fields (e.g., Dolag et al. 2002; Brüggen et al. 2005; Subramanian et al. 2006; Ryu et al. 2008) and into the acceleration of high energy particles via shocks and turbulence (e.g., Enßlin et al. 1998; Sarazin 1999; Blasi 2001; Brunetti et al. 2001, 2004; Petrosian 2001; Miniati et al. 2001; Fujita et al. 2003; Ryu et al. 2003; Hoeft & Brüggen 2007; Brunetti & Lazarian 2007; Pfrommer et al. 2008, Brunetti et al. 2009).
A promising scenario proposed to explain the origin of the synchrotron emitting electrons in radio halos assumes that electrons are re-accelerated due to the interaction with MHD turbulence injected in the ICM in connection with cluster mergers (turbulent re-acceleration model, e.g., Brunetti et al. 2001; Petrosian 2001). An alternative possibility is that the emitting electrons are continuously injected by pp collisions in the ICM (secondary models; e.g., Dennison 1980; Blasi & Colafrancesco 1999).
In the picture of the turbulent re-acceleration scenario, the formation and evolution of radio halos are tightly connected with the dynamics and evolution of the hosting clusters. Indeed, the occurrence of radio halos at any redshift depends on the rate of cluster-cluster mergers and on the fraction of the merger energy channelled into MHD turbulence and re-acceleration of high energy particles. In the last few years this has been modeled through Monte Carlo procedures (Cassano & Brunetti 2005; Cassano et al. 2006a) that provide predictions that can be verified using future instruments. In this scenario radio halos have a relatively short lifetime ( 1 Gyr), and the fraction of galaxy clusters where radio halos are generated is expected to increase with cluster mass (or X-ray luminosity), since the energy of the turbulence generated during cluster mergers is expected to scale with the cluster thermal energy (which roughly scales as ; e.g., Cassano & Brunetti 2005). It has been shown that the predicted occurrence of radio halos as a function of the cluster mass (or X-ray luminosity) is in line with results obtained from a large observational project, the “GMRT radio halo survey” (Venturi et al. 2007, 2008), and with its combination with studies of nearby halos based on the NVSS survey (e.g., Cassano et al. 2008).
The steep spectrum of radio halos makes these sources ideal targets for observations at low radio frequencies suggesting that present radio telescopes can only detect the tip of the iceberg of their population (Enßlin & Röttgering 2002; Cassano et al. 2006; Hoeft et al. 2008). The recent discovery of the giant and ultra-steep spectrum radio halo in Abell 521 at low radio frequencies (Brunetti et al. 2008) allows a first confirmation of this conjecture and provides a glimpse of what future low frequency radio telescopes, such as the Low Frequency Array (LOFAR)111http://www.lofar.org and the Long Wavelength Array (LWA, e.g., Ellingson et al. 2009), might find in the upcoming years.
LOFAR promises an impressive gain of two orders of magnitude in sensitivity and angular resolution over present instruments in the frequency range 15–240 MHz, and as such will open up a new observational window to the Universe. In particular, LOFAR is expected to contribute significantly to the understanding of the origin and evolution of the relativistic matter and magnetic fields in galaxy clusters.
The main focus of the present paper is to provide a theoretical framework for the interpretation of future LOFAR data by quantifying expectations for the properties and occurrence of giant radio halos in the context of the turbulent re-acceleration scenario. In particular, in Sect. 2 we summarize the main ingredients used in the model calculations and provide an extension of the results of previous papers on the occurrence of radio halos in clusters (Sect. 2.1) and on the expected radio halo luminosity functions (Sect. 2.2). In Sect. 3 we derive the expected number counts of radio halos at 120 MHz and explore the potential of LOFAR surveys. Our conclusions are given in Sect.4.
A CDM ( , , ) cosmology is adopted throughout the paper.
2 Statistical modelling of giant radio halos in galaxy clusters
Turbulence generated during cluster mergers may accelerate relativistic particles and produce diffuse synchrotron emission from Mpc regions in galaxy clusters (e.g., Brunetti et al. 2008). Diffuse radio emission in the form of giant radio halos should be generated in connection with massive mergers and fade away as soon as turbulence is dissipated and the emitting electrons cool due to radiative losses. It is likely that the generation of turbulence and the acceleration of particles persist for a few crossing times of the cluster-core regions. This then yields a lifetime of about 1 Gyr.
Since the physics of the proposed scenario is rather uncertain, we choose to model the properties of the halos and their cosmic evolution using a simple statistical approach. Through Monte Carlo calculations we take into account the main processes that play a role in this scenario. These include the rate of cluster-cluster mergers in the Universe and their mass ratios, and the fraction of the energy dissipated during these mergers that is channelled into MHD turbulence and acceleration of high energy particles (Cassano & Brunetti 2005; Cassano et al. 2006a). We refer the reader to these papers for details, here we briefly report the essential steps that enter into the calculations :
-
i)
the formation and evolution of galaxy clusters is computed through the extended Press & Schechter approach (1974, hearafter PS; Lacey & Cole 1993) that is based on the hierarchical theory of cluster formation. The PS mass function shows a good agreement with that derived from N-body simulations, at least for relatively low redshifts and masses (e.g., Springel et al. 2005), although it has the tendency to underestimate the number density of systems with mass (e.g., Governato et al. 1999; Bode et al. 2001; Jenkins et al. 2001). Given a present day mass and temperature of the parent clusters, the cluster merger history (merger trees) is obtained making use of Monte Carlo simulations. We simulate the formation history of galaxy clusters with present-day masses in the range . This allows a statistical description of the cosmological evolution of galaxy clusters and of the merging events with cosmic time;
-
ii)
the generation of the turbulence in the ICM is estimated for every merger identified in the merger trees. The resulting turbulence is assumed to be generated and then dissipated within a time-scale of the order of the cluster-cluster crossing time in that merger222The cascading time scale of large scale turbulence is expected to be of the same order of cluster-cluster crossing time (e.g., Cassano & Brunetti 2005; Brunetti & Lazarian 2007).. Furthermore, it is assumed that turbulence is generated in the volume swept by the subcluster infalling into the main cluster and that a fraction, , of the work done by this subcluster goes into the excitation of fast magneto–acoustic waves. The work is estimated as , where is the ICM density of the main cluster averaged over the swept cylinder, is the impact velocity of the two subclusters, is the stripping radius (see also Sect.2.1), and is the virial radius of the main cluster (see Cassano & Brunetti 2005 for details).
-
iii)
the resulting spectrum of MHD turbulence generated by the chain of mergers in any synthetic cluster and its evolution with cosmic time is computed by taking into account the injection of waves and their damping in a collisionless plasma. Acceleration of particles by this turbulence and their evolution is computed in connection with the evolution of synthetic clusters by solving Fokker-Planck equations and including the relevant energy losses.
-
iv)
This procedure allows for the exploration of the statistical properties of radio halos. Following Cassano et al. (2006), we consider homogeneous models, i.e., without spatial variation of the turbulent energy, acceleration rate and magnetic field in the halo volume. We assume a value of the magnetic field, averaged over a region of radius kpc, which scales with the virial mass of clusters, as:
(1) where is a parameter that enters in the model calculations. Eq. 1 is motivated by numerical cosmological (MHD) simulations that found a scaling of the magnetic field with temperature or mass of the simulated clusters (e.g., Dolag et al. 2002)333Dolag et al. (2002) found a scaling , that would imply if the virial scaling is assumed..

2.1 Occurrence of radio halos in galaxy clusters
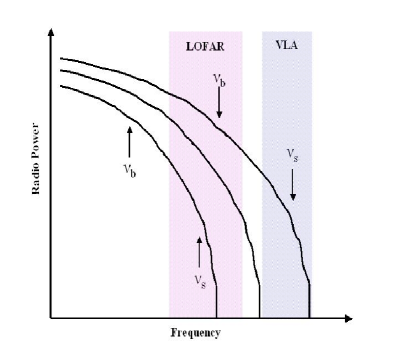
Stochastic particle acceleration by MHD turbulence is believed to be rather inefficient in the ICM. Consequently electrons can be accelerated only up to energies of several GeV, since at higher energies the radiation losses are efficient and hence dominate. The resulting gradual steepening in the theoretical synchrotron spectrum of radio halos at high frequencies is consistent with the observed spectral shapes (or with the very steep spectra) of several well studied halos (e.g., Schlickeiser et al 1987; Thierbach et al. 2003; Brunetti et al. 2008; Dallacasa et al. 2009).
This steepening will make it difficult to detect these sources at frequencies larger than the frequency, , at which the steepening becomes severe (see Fig.1). is expected to be a few times larger than the break frequency, . depends on the acceleration efficiency in the ICM, , and is defined as (e.g., Cassano et al. 2006) :
| (2) |
The Transit Time Damping (TTD) is the most important collisionless resonance between the magnetosonic waves and particles, and is due to the interaction of the compressible component of the magnetic field of these waves with the particles (e.g., Schlickeiser & Miller 1998; Cassano & Brunetti 2005; Brunetti & Lazarian 2007). In this case , where is the momentum of the electrons and is the electron diffusion coefficient in the momentum space due to the coupling with turbulent waves. Cassano & Brunetti (2005) derived that in the case of a single merger between a cluster with mass and a subcluster of mass , can be approximated as:
| (3) |
where is the stripping radius of the subcluster crossing the main cluster, i.e., the distance from the center of the subcluster where the static pressure equals the ram pressure (see Cassano & Brunetti 2005 for details); is the size of the radio halo, and and are the virial radius and temperature of the main cluster, respectively.
Combined with Eq. 2 this implies that larger values of are expected in the more massive clusters, (here considering for simplicity a fixed value of , see Cassano et al. 2006 for more general discussion), and in connection with major merger events, (also in Eq.3 increases with ).
Monte Carlo simulations can now be used to follow cluster-mergers and to explore how different mergers contribute to the acceleration (efficiency) of relativistic particles in the ICM. Consequently this allows for a statistical modeling of within a synthetic cluster sample and the derivation of its statistical dependence on cosmic time and cluster mass.
Surveys cannot reveal radio halos that have smaller than the observing frequency, since the spectrum of these halos should be very steep and their emission would fall below the survey detection limit (Figure 1). In order to investigate the statistical behavior of the population of radio halos at different frequencies we only take halos to be observable that have . Figure 2 shows the ratio calculated for homogeneous models of radio halos, defining as the frequency where the synchrotron spectrum of these halos is ( calculated between and to mimic 600-1400 MHz spectra); as is only mildly dependent on magnetic field strength and the assumed fraction of turbulent energy injected, we adopt . A statistical modeling of provides a statistical evaluation of in the synthetic cluster sample.
In the context of the turbulent acceleration model for giant radio halos energetics arguments imply that halos with 1 GHz must be generated in connection with the most energetic merger-events in the Universe. Only these mergers may allow for the efficient acceleration necessary to have relativistic electrons emitting at these frequencies (Cassano & Brunetti 2005). Present surveys carried out at 1 GHz detect radio halos only in the most massive and merging clusters (e.g., Buote 2001, Venturi et al. 2008), and their occurrence has been used to constrain the value of in the models (Cassano & Brunetti 2005). Similar energetics arguments can be used to claim that radio halos with smaller values of must be more common, since they can be generated in connection with less energetic phenomena, e.g., major mergers between less massive systems or minor mergers in massive systems (e.g., Eqs. 2-3), that are more common in the Universe (e.g., Cassano et al. 2008).
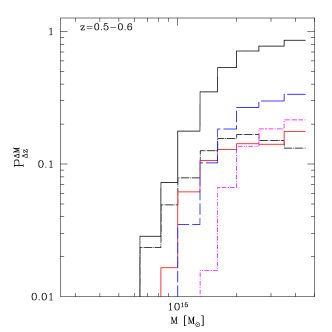
In Fig.3 we plot the fraction of clusters that host radio halos with as a function of the cluster mass and considering two redshift ranges : (left panel) and (right panel); this is obtained assuming a reference set of model parameters, namely: G, , (see also Cassano et al. 2006). As expected, the fraction of clusters with halos increases at smaller values of , and the amount of this increment depends on the considered mass and redshift of the parent clusters, being larger at smaller cluster masses and at higher redshifts.
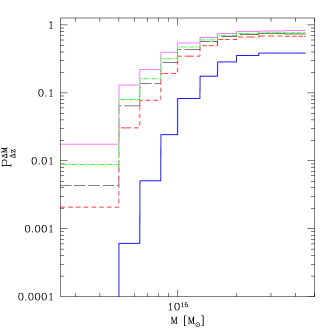
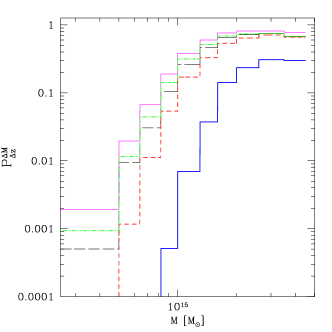
Fig.4 we plot the fraction of radio halos with 120 MHz (black upper line) and the differential contribution to this fraction from radio halos with in four frequency ranges (see figure caption for details). For nearby systems (Fig.4, Left Panel), a significant fraction of massive clusters, , is expected to host radio halos with 120 MHz; a sizeable fraction of them with MHz (blue and magenta lines). On the other hand, the majority of radio halos in clusters with mass would have very steep spectra if observed at GHz frequencies, MHz (red line and black dot-dashed line). Our calculations suggest that a similar situation is expected for clusters at higher redshift (Fig.4, Right Panel). Radio halos with larger values of become much rarer with increasing redshift, mainly because the unavoidable inverse Compton losses at these redshifts limit the maximum energy of the accelerated electrons in these systems. At , only merging clusters with mass have a sizeable chance to host giant radio halos with GHz, and an increasing contribution to the percentage of radio halos at higher redshift comes from halos with lower .
2.2 The radio halo luminosity function
The luminosity functions of radio halos (RHLFs), i.e., the number of halos per comoving volume and radio power, with GHz has been derived by Cassano et al. (2006a) as:
| (4) |
where is the theoretical mass function of radio halos with GHz, that is obtained combining Monte Carlo calculations of the fraction of clusters with halos and the PS mass function of clusters (e.g., Eq. 18 in Cassano et al. 2006).
can be estimated from the correlation between the 1.4 GHz radio power, , and the mass of the parent clusters, that is observed for radio halos (e.g., Govoni et al. 2001; Cassano et al. 2006a). Cassano et al. (2006) discussed the – correlation in the context of the turbulent acceleration model and have shown that the slope is consistent with the observed value () for a well constrained region of parameter space (, , and ; Figure 7 in Cassano et al. 2006); model parameters adopted in the present paper, G, , , fall in this range. In particular, the value of the derivative in Eq. 4 depends on the set of paramenters (, ) that, in the case of the reference model we are using in this paper, sets .
To derive the RHLF at frequency the contribution of all radio halos with should be taken into account. We first obtained the RHLF for halos with in a given frequency interval, e.g., , and then combine the different contributions from the considered intervals :
| (5) |
To derive the contribution to the RHLF from radio halos with 1.4 GHz we should calculate for these halos. This can be estimated from the correlation assuming a monochromatic radio power of these halos at :
| (6) |
where is the monochromatic radio power at 1.4 GHz from the correlation, and the typical spectral index of these halos, (e.g., Ferrari et al. 2008).
We now consider the case of halos with 1.4 GHz. The bolometric synchrotron power of radio halos is expected to scale with and (e.g., Cassano et al. 2006) :
| (7) |
From Eqs.2-3 it is clear that clusters with the same mass (and magnetic field ) at redshift could have different values of , depending on the merger event responsible of the generation of the radio halo. Yet, Eq. 7 implies that for a fixed cluster mass (and consequently for a fixed value of the magnetic field) the synchrotron radio power emitted at the break frequency, , is constant. In addition, homogeneous models, that consider an average value of and in the halo volume, also imply that (Fig. 2). From Eq. 7, we can then derive the monochromatic radio power at of halos with a given :
| (8) |
This allows the evaluation of starting from , and thus to derive Eq. 5.
| (9) |
i.e. radio halos with synchrotron spectra steepening at smaller frequencies will also have monochromatic radio powers at smaller than those of radio halos with larger .
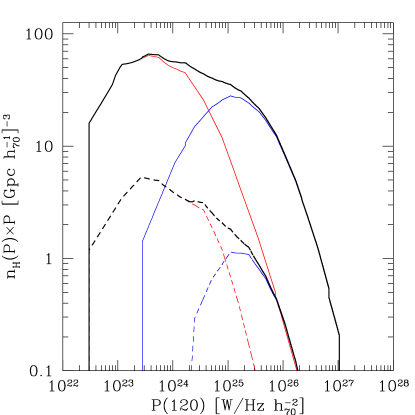
As a relevant example, in Fig.5 we report the expected RHLF at 120 MHz (black lines) for (solid thick lines) and (dashed thick lines), where we also show the relative contribution from halos with MHz (red lines) and MHz (blue lines).
As already discussed in Cassano et al. (2006), the shape of the RHLF flattens at lower radio powers due to the decrease of the efficiency of particle acceleration in less massive clusters. We note that halos with MHz (blue lines, Fig. 5) do not contribute to lower radio powers in the RHLF. This is because higher-frequency halos are generated in very energetic merger events, and must be extremely rare in smaller systems and consequently their monochromatic radio power is larger than that of halos with MHz (red lines, Fig. 5). Finally, we note that with increasing redshift the RHLFs decrease due to the evolution of the cluster mass function with and to the evolution with of the fraction of galaxy clusters with radio halos (Fig. 3, see also Cassano et al. 2006). The evolution of the RHLF with is stronger at higher radio powers, where the dominant contribution to the RHLF comes from halos with larger and the fraction of clusters hosting these halos decreases more rapidly with redshift (e.g., Fig. 4).
3 Number Counts of Radio Halos and LOFAR surveys at 120 MHz
It has been shown that model expectations of the occurrence of radio halos observed at = 1.4 GHz are consistent with the fraction of radio halos with cluster mass (Cassano et al. 2008) and with the number counts of nearby radio halos (Cassano et al. 2006).
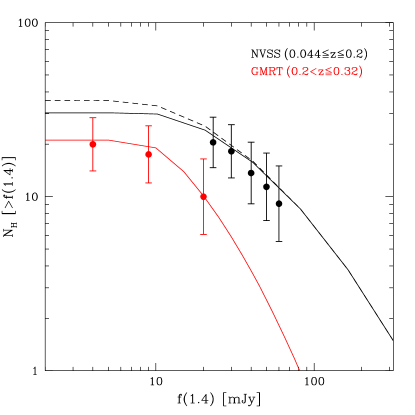
As already discussed, in this paper we adopt a reference model with parameters: G, , . In Fig. 6 we report number counts of giant radio halos expected with these parameters compared with radio halo counts from the NVSS survey at low redshift, (Giovannini et al. 1999) and from the GMRT Radio Halo Survey at intermediate redshift, (Venturi et al. 2007, 2008). The latter is a pointed survey down to Jy/beam at 610 MHz of a sample of galaxy clusters extracted from the REFLEX (Böhringer et al. 2004) and eBCS (Ebeling et al. 1998, 2000) cluster catalogs. The clusters have and erg/s (the X-ray sample is complete for ; see Cassano et al. 2008). All halos in the survey have GHz follow up. Beside the fair agreement between expectations and observations (see caption), we note that the GMRT radio halo survey is sufficiently sensitive to catch relatively faint halos and to constrain the flattening of the distribution of number counts of radio halos (RHNC) at lower fluxes.
Encouraged by these results, in this Section we derive expected RHNC at 120 MHz and explore the potential of the upcoming LOFAR surveys.
Because in our simplified procedure the radio power of halos scales with a spectral slope (Eqs. 6–9) and the great majority of halos is at 0.2–0.4, in the following we neglect K-correction.444For simplicity we also consider observables those halos with regardless of their redshift. This would slightly affect only the number counts of halos with that represent a minimal fraction of our halo population.
3.1 LOFAR Surveys
LOFAR will carry out surveys between 15 MHz and 210 MHz with unprecedented sensitivity and spatial resolution (e.g., Röttgering et al. 2006). Also, the unprecedented (u,v) coverage of LOFAR at short baselines maximizes the instrument capability to detect extended sources with low surface brightness such as radio halos. These surveys will constrain models for the origin of diffuse radio emission in galaxy clusters. In this paper we assume an observing frequency = 120 MHz where LOFAR will carry out the deepest large area radio surveys (e.g., Röttgering et al. 2006).
The crucial step in our analysis is the estimate of the minimum diffuse flux from giant radio halos (integrated over a scale of 1 Mpc) that is detectable by these surveys as a function of redshift. This depends on the brightness profiles of radio halos that is known to smoothly decrease with distance from the cluster center (e.g., Govoni et al. 2001). Consequently the outermost, low brightness, regions of halos will be difficult to detect.
However what is important is the capability to detect the central, brightest, regions of radio halos in the survey images. Following Brunetti et al. (2007), we consider a shape of the radial profile of radio halos that is obtained from the analysis of well studied halos. We assume a circular observing beam = 2525 arcsec, and follow two complementary approaches555The 120 MHz LOFAR survey will have a full resolution of 5–6 arcsec, thus we are considering the case of tapered images that increase the sensitivity to extended emission without changing significantly the point source sensitivity (due to the large number of inner LOFAR stations).:
-
i)
since radio halos emit about half of their total radio flux within their half radius (Brunetti et al. 2007), we estimate the minimum flux of a detectable halo, , through the requirement that the mean brightness within , , is times the , , of the survey, i.e. :
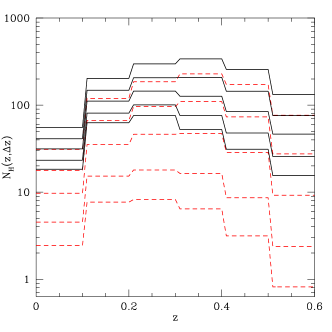
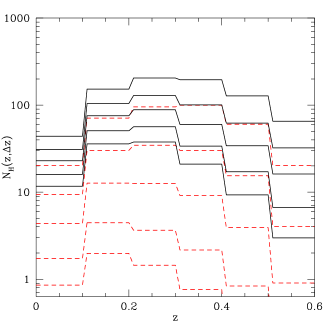
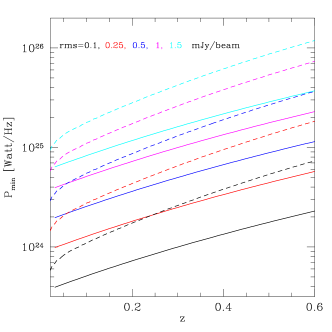
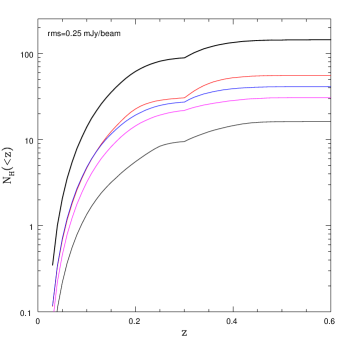
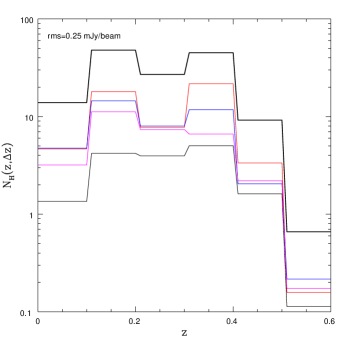
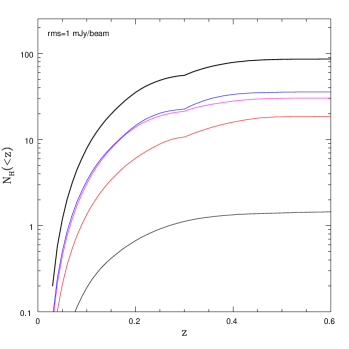
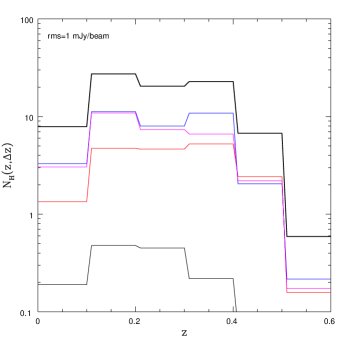
Figure 8: Number (all-sky) of radio halos with 120 MHz (black lines) as a function of redshift that can be expected at the sensitivity of LOFAR surveys. Calculations are performed following approaches i) in Sect. 2.1 (left) and ii) (right), assuming = 0.1, 0.25, 0.5, 1.0, 1.5 (bottom to top). Red lines give the number counts of radio halos with MHz. (10) where is the angular size of radio halos, in arcseconds, at a given redshift; allowing for the detection of diffuse halo emission in the images produced by the survey. Injection of fake radio halos in the (u,v) plane of interferometric data from NVSS observations show that radio halos at z 0.3 become visible in the images as soon as their flux approaches that obtained by Eq. 10 with (Cassano et al. 2008);
-
ii)
following a second approach we estimate the minimum flux of a detectable halo through the requirement that the average brightness within 5 observing beams is times the , , of the survey. The minimum flux is obtained through the condition :
(11) where is the typical radial profile of halos (Brunetti et al. 2007), is the beam area, and . The aim of this second approach is to avoid any bias due to the redshift of the halos and is motivated by the fact that in the first approach the sensitivity limit is reached in a fairly large area (many beams) for nearby radio halos, but only in a few beam area in the case of halos at z=0.5-0.6.
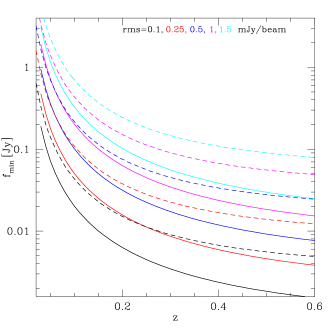
Fig.7 shows of radio halos as a function of redshift (left panel), and the corresponding minimum radio power (right panel), obtained following the two approaches and assuming = mJy/beam (see Figure caption).

Given the RHLF () the number counts of radio halos with in a redshift interval, , is given by :
| (12) |
In Fig. 8 we show the all-sky number of radio halos with 120 MHz in different redshift intervals detectable by typical LOFAR surveys with different sensitivities ( … mJy/beam, see figure caption) and following the approach i) (Left Panel) and ii) (Right Panel).
The LOFAR all sky survey (e.g., Röttgering 2009, priv. comm.) is expected to reach an rms=0.1 mJy/beam at 120 MHz. Considering the case i) (Fig. 8, Left Panel) with , we predict that this survey will detect more than 350 radio halos at redshift 0.6, in the northern hemisphere () and at high Galactic latitudes (). This will increase the statistics of radio halos by about a factor of with respect to that produced with the NVSS. The LOFAR commissioning MS3 survey is expected to reach sensitivities 0.5 mJy/b at 150 MHz. Based on our results, 100 radio halos are expected to be discovered through this survey within one year time-scale.
The spectral properties of the population of radio halos visible by the future radio surveys at low frequencies are expected to change with increasing the sensitivity of these surveys. In Fig. 8 we show the total number of halos with 120 MHz (solid lines) together with the number of halos with a spectral steepening at low frequencies, MHz. The latter class of radio halos has a synchrotron spectral index between 250-600 MHz, and would become visible only at low frequencies, MHz. We find that about 55% of radio halos in the LOFAR all sky survey at 120 MHz is expected to belong to this class of ultra-steep spectrum radio halos, while radio halos with larger are expected to dominate the population in shallower surveys. This is simply due to the fact that, for the reasons explained in Sect. 2.2, low frequency radio halos are expected to populate the low power-end of the RHLF (e.g. Fig. 5). Complementary information is given in Fig. 9 that shows the expected distribution of halo spectral indices, that refer to the number distributions in Fig. 8, and its evolution with sensitivity of radio observations; spectra in Fig. 9 are calculated between 120–300 MHz assuming homogeneous models.
Ultra-steep spectrum halos are a unique prediction of the turbulent re-acceleration model (e.g., Brunetti et al. 2008) and our expectations demonstrate the potential of LOFAR in constraining present models for the origin of radio halos.
3.2 Application to X-ray selected cluster samples
Although unbiased surveys of radio halos provide an important way to address the occurrence of these sources (Sect. 3.1), a potential problem with these approaches is the identification of radio halos and of their hosting clusters. This is because radio halos constitute only a very small fraction of the entire radio source population and need to be distinguished from confused regions of superpositions for radio AGNs and starbust galaxies.
Alternatively, an efficient approach is to exploit deep LOFAR surveys at low radio frequencies of X-ray selected samples of galaxy clusters.
Here we derive the number of radio halos, and their flux and redshift distribution, that are expected from LOFAR observations of sample of X-ray selected clusters.
There are several catalogs of X-ray selected clusters in the northern hemisphere that contain clusters extracted from the ROSAT All-Sky Survey (RASS, Trümper 1993). At redshift the ROSAT Brightest Cluster Sample and its extension at lower X-ray fluxes (eBCS, Ebeling et al. 1998, 2000) and the Northern ROSAT All-Sky (NORAS) Cluster Survey (Böhringer et al. 2000) provide cluster catalogs with X-ray flux ; the eBCS is 75% complete down to this flux limit. The extension towards larger redshifts of these catalogs is given by the Massive Cluster Survey (MACS, Ebeling et al. 2001) that contains clusters with at z=0.3-0.6. All these surveys have optical follow-ups and provide a useful starting point to pick up radio halos in LOFAR surveys.
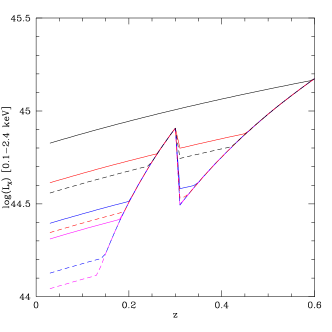
A well-known correlation exists between the synchrotron power of giant radio halos and the X-ray luminosity of the hosting clusters, , with (e.g., Liang et al. 2000; Bacchi et al. 2003; Enßlin & Röttgering 2002; Cassano et al. 2006; Brunetti et al. 2009). This implies that the X-ray flux limit of the survey, , is related to the radio flux of halos. The minimum flux of radio halos that can be detected at redshift is given by the maximum value between the minimum radio flux due to the sensitivity of radio surveys (Sect. 3.1) and that constrained by through the radio – X-ray correlation. To address this issue at =120 MHz in the case of radio halos with GHz we assume a correlation between the monochromatic radio luminosity at 120 MHz and rescaled from that at 1.4 GHz through Eq. 6. For halos with lower (yet 120 MHz) the correlation between the radio luminosity at 120 MHz and is obtained via Eq. 8 that accounts for the smaller radio power expected in the case of halos with steeper spectrum (Sect. 2.2).
In this Section we model the sensitivity of LOFAR at 120 MHz following the approach i) in Sect. 3 (Eq. 10). More specifically, to detect radio halos, we consider 120 MHz LOFAR follow ups of a cluster catalog obtained by combining the eBCS (at ) and the MACS () samples, and assume references sensitivities of radio observations and 1 mJy/beam. The minimum of clusters where these radio observations are expected to detect giant radio halos results from the combination of the above radio sensitivity and the minimum in cluster catalogs at redshift , and is shown in Fig. 10 by considering different (see Figure caption for details). One may note that at intermediate redshift and at higher redshift the luminosity-limit is driven by the X-ray flux limit of the eBCS and MACS catalogs, respectively. On the other hand, we expect that in the redshift range where the minimum is constrained by the radio sensitivity, radio halos with in the range 120–240 MHz (Fig. 10, black lines) can be detected in clusters with X-ray luminosity about 3 times larger than that of clusters with GHz halos (Fig. 10, magenta lines).
In Fig.11 we show the cumulative and differential number counts of radio halos expected from the LOFAR follow up of eBCS and MACS clusters at 120 MHz. This is obtained through Eq. 12 and by taking into account both the selection criteria shown in Fig.10 and the sky coverage of eBCS and MACS surveys. The inflection in the number counts at is due to the change in the X-ray selection criteria (see Fig.10) moving from the eBCS () to the MACS () cluster sample. We expect that the LOFAR all sky survey, with a planned sensitivity in line with the case mJy/beam (Fig.11, upper panels), will discover about 130 radio halos out of the clusters in the eBCS and MACS catalogs. Remarkably, about 40% of these radio halos are expected with MHz, thus halos with extreme steep spectra at GHz frequencies. The majority of radio halos in eBCS and MACS clusters is expected at z = 0.2-0.4, while the small number of clusters at with X-ray flux above the flux limit of the MACS catalog does not allow a statistically solid expectations, although we may expect a couple of radio halos hosted in MACS clusters at this redshift. At this redshift we expect that only major mergers in massive clusters () can generate radio halos with GHz (Fig. 4, right panel). The powerful radio halo recently discovered in the cluster MACS J0717.5 +3745 (e.g., Bonafede et al. 2009; van Weeren et al. 2009) is consistent with these expectations.
Fig. 11 (lower panels) shows the expected number counts of radio halos assuming the more conservative case mJy/b that is suitable to explore the potential of the LOFAR MS3 commissioning survey. In this case about 80 radio halos are expected to be found in eBCS and MACS clusters; about 20 of these halos are expected with 600 MHz. We notice that the number of expected radio halos from follow up of eBCS and MACS clusters increases by less than a factor of 2 considering a substantial drop in radio sensitivity from to 0.25 mJy/b. This is not surprising as the majority of radio halos that are expected to be discovered by deep radio observations should be found in galaxy clusters with X-ray luminosity below the luminosity-threshold of the eBCS and MACS catalogs (e.g., Fig. 10).
The eBCS cluster sample contains 300 galaxy clusters at and covers the northern hemisphere. The redshift and X-ray luminosity distribution of eBCS clusters is public (Ebeling et al. 1998, 2000) and thus we can provide a more quantitative expectation based on e.g., the more conservative case, MS3–like that assumes mJy/beam at 120 MHz (in this case the selection function of clusters in the - plane is reported in Fig. 10, solid lines at ).
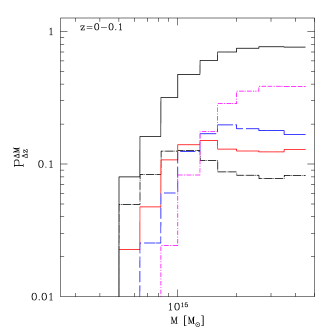
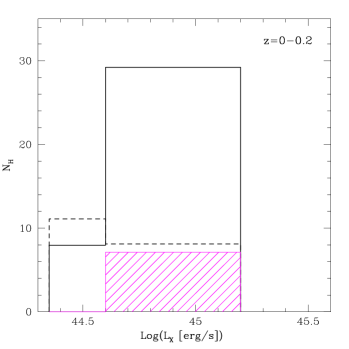
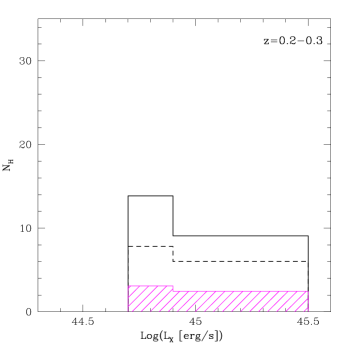
In Fig.12 we show the distribution of the expected radio halos in the eBCS clusters in two redshift intervals: and (left and right panels, respectively). We find that radio observations at 120 MHz are expected to discover radio halos in about clusters, i.e., in about 20% of eBCS clusters. In addition, about of these halos are expected to have very steep radio spectra, MHz (magenta shadowed region in Fig. 12).
Finally, the percentage of clusters with radio halos is expected to increase with the X-ray luminosity of the hosting clusters. This is particularly relevant in the redshift interval when compared to expectations calculated under the assumption that the fraction of clusters hosting radio halos is constant with cluster mass (Fig.12 dashed lines, see caption). Consequently LOFAR will be able to readily test this unique expectation of the turbulent re-acceleration model.
4 Summary & Conclusions
In the present paper we perform Monte Carlo simulations to model the formation and evolution of giant radio halos in the framework of the merger-induced particle acceleration scenario (see Sec. 2). Following Cassano et al. (2006a) we use homogeneous models that assume a) an average value of the magnetic field strength in the radio halo volume that scales with cluster mass as , and b) that a fraction, , of the work, done by subclusters crossing the main clusters during mergers goes into magneto-acoustic turbulence. Although simple, these models reproduce the presently observed fraction of galaxy clusters with radio halos and the scalings between the monochromatic radio power of halos at 1.4 GHz and the mass and X-ray luminosity of the host clusters (e.g., Cassano et al. 2006, 2008; Venturi et al. 2008), provided that the model parameters lie within a fairly constrained range of values (Fig. 7 in Cassano et al. 2006a); in the present paper we adopt a reference set of parameters: G, , , that falls in that range.
In Fig. 6 we show that the expected number counts of giant radio halos at GHz obtained with this set of parameters are nicely in agreement with both the data at low redshift (NVSS-XBACS selected radio halos, Giovannini et al. 1999) and at intermediate redshift (clusters in the “GMRT radio halo survey”, Venturi et al. 2007, 2008).
The most important expectation of the turbulent re-acceleration scenario is that the synchrotron spectrum of radio halos should become gradually steeper above a frequency, that is determined by the energetics of the merger events that generate the halos and by the electron radiative losses (e.g., Fujita et al. 2003; Cassano & Brunetti 2005). Consequently, the population of radio halos is expected to be constituted by a mixture of halos with different spectra, with steep spectrum halos being more common in the Universe than those with flatter spectra (e.g., Cassano et al. 2006). The discovery of these very steep spectrum halos will allow to test the above theoretical conjectures.
In Sect. 2 we have derived the expected radio halo luminosity functions (RHLF) at frequency , that account for the contribution from the different populations of radio halos with . The RHLF are obtained combining the theoretical mass function of radio halos (with different ) with the radio power–cluster mass correlation (Eq.4). The expected monochromatic radio power at of halos hosted by clusters with mass is extrapolated from the observed – correlation by assuming simple scaling relations, appropriate for homogenous models, that account for the dependence of the emitted synchrotron power on (Eqs.8,9).
As a relevant case we calculate the expected RHLF at = 120 MHz (Fig. 5). The shape of the RHLF can be approximated by a power law over more than two orders of magnitude in radio power. Homogeneous models imply the following scalings between , cluster mass and the radio luminosity at , :
| (13) |
and from Eq. 9 and the correlation:
| (14) |
i.e., radio halos with larger are typically generated in massive clusters that undergo major mergers and contribute to the RHLF at larger powers. On the other hand halos with smaller are typically generated in less massive systems and contribute to the RHLF at fainter powers. Radio halos with 120 MHz however become increasingly rare in clusters with mass M⊙ and this explains the drop of the RHLF at lower radio powers in Fig. 5. At the same time, halos with monochromatic radio emission at 120 MHz W Hz-1 would be generated in connection with very energetics merging events in very massive clusters, that are extremely rare, and this explains the RHLF cut-off at higher synchrotron powers in Fig. 5.
In Sect. 3 we discuss the expected number counts of radio halos at 120 MHz, that best allow us to explore the potential of incoming LOFAR surveys in constraining present models.
The crucial step in this analysis is the estimate of the minimum diffuse flux from giant radio halos that is detectable by these surveys. Because the LOFAR capabilities will become more clear during the incoming commissioning phase we exploit two complementary approaches: i) we required that at least half of the radio halo emission is above a fixed brightness–threshold, ( being the of LOFAR surveys; ii) we required that the signal from the radio halo is in at least 5 beam area of LOFAR observations. In both cases we assume a fixed shape of the radial profile of radio halos, calibrated through that of several well studied halos at 1.4 GHz, that introduces a potential source of uncertainty.
Although the uncertainties due to the unavoidable simplifications in our calculations, the expected number counts of radio halos highlights the potential of future LOFAR surveys. By assuming the expected sensitivity of the LOFAR all sky survey (e.g., Röttgering 2009; priv. comm.), rms =0.1 mJy/b, and , we predict that about 350 giant radio halos ( considering the case ii)) can be detected at redshift 0.6. This means that LOFAR will increase the statistics of these sources by a factor of with respect to present day surveys. About 55% of these halos are predicted with a synchrotron spectral index between 250-600 MHz, and would brighten only at lower frequencies, unaccessible to present observations. Most important, the spectral properties of the population of radio halos are expected to change with increasing the sensitivity of the surveys as steep spectrum radio halos are expected to populate the low-power end of the RHLF. A large fraction of radio halos with spectrum steeper than (e.g., Fig. 9) is expected to allow a prompt discrimination between different models for the origin of radio halos, for instance in this case simple energetic arguments would rule out a secondary origin of the emitting electrons (e.g., Brunetti 2004; Brunetti et al. 2008).
Due to the large number of expected radio halos, a potential problem with these surveys is the identification of halos and of their hosting clusters. As a matter of fact we expect that LOFAR surveys will open the possibility to unveil radio halos in galaxy clusters with masses M⊙ at intermediate redshift. On the other hand, statistical samples of X-ray selected clusters, that are unique tools for the identification of the hosting clusters, typically select more massive clusters at intermediate z. Consequently, we explored the potential of the first LOFAR surveys as deep follow ups of available X-ray selected samples of galaxy clusters.
We calculate the radio halo number counts expected from the follow up of clusters in the eBCS and MACS samples that collect galaxy clusters in the redshift range 0–0.6. We expect that the LOFAR all sky survey, with a planned sensitivity in line with the case mJy/b, will discover about 130 radio halos in eBCS and MACS clusters and that about 40% of these radio halos should have very steep spectrum, MHz. The majority of radio halos in eBCS and MACS clusters are expected at z = 0.2-0.4, while the small number of clusters at in the MACS catalog does not allow a statistically solid expectations, although we may expect a couple of radio halos hosted in MACS clusters at this redshift.
The MS3 survey will be carried out in 2010, covering the northern hemisphere, and is expected to reach a noise level of about 0.5 mJy/b at 150 MHz, that implies a sensitivity to diffuse emission from galaxy clusters about one order of magnitude (assuming ) better than present surveys (e.g., NVSS, Condon et al. 1998; VLSS, Cohen et al. 2007; WENSS, Rengelink et al. 1997).
We considered MS3 pointings relative to the fields of the about 300 galaxy clusters at in the eBCS catalogues. We find that about 60 radio halos are expected to be detected by MS3 observations in these clusters, 25% of them (10-15 halos) are expected with 600 MHz. Fairly sensitive GMRT observations of eBCS clusters at redshift 0.2–0.3 are already available (Venturi et al. 2007, 2008) and we expect that in a few cases radio halos would glow up in the MS3 images where no diffuse radio emission is detected at 610 MHz. We also find that MS3 observations of eBCS clusters at can be used to test the increase of the fraction of cluster with radio halos with the X-ray luminosity of the host clusters, which is a unique prediction of our model (Fig.12.
The most important simplification in our calculations is the use of homogeneous models. Non-homogeneous approaches, that model the spatial dependence of the acceleration efficiency and magnetic field in the halo volume (e.g., Brunetti et al. 2004), and possibly their combination with future numerical simulations, will provide a further step to interpret LOFAR data. Also the use of the extended PS theory is expected to introduce some biases. For instance, it is well-known that the PS mass function underproduces the expected number of massive clusters () at higher redshift, , by a factor of with respect to that found in N-body simulations (e.g., Governato et al. 1999; Bode et al. 2001; Jenkins et al. 2001). Since in our model the great majority of halos at these redshift is associated with massive clusters, the use of the PS mass function implies that the RHNC at could be underestimated by a similar factor. A further refinement of the approach proposed in the present paper could be obtained with the use of galaxy cluster merger trees extracted from N-body simulations. These would also allow for a more realistic description of the merger events (spatially resolved, multiple mergers, etc…).
In the present paper we focus on a reference set of model parameters. Cassano et al. (2006a) discussed the dependence of model expectations at 1.4 GHz on these parameters. Based on their analysis we expect that all the general results given in the present paper are independent of the adopted values for parameters. The expected number counts of halos should change by a factor of considering sets of model parameters within the region (, , ) that allows for reproducing the observed correlation. In this case the number of halos that we expect decreases from super-linear sets of parameters ( and G) to sub-linear cases ( and G) (see also Fig.4 in Cassano et al. 2006b); a more detailed study will be presented in a future paper.
Acknowledgements.
We thank the anonymous referee for useful comments. This work is partially supported by ASI and INAF under grants PRIN-INAF 2007, PRIN-INAF 2008 and ASI-INAF I/088/06/0.References
- (1) Bacchi M., Feretti L., Giovannini G., Govoni F., 2003, A&A, 400, 465
- (2) Blasi P., 2001, APh 15, 223
- (3) Blasi, P., & Colafrancesco, S. 1999,
- (4) Bode P, Bahcall N.A., Ford E. B. & Ostriker J.P., 2001, ApJ 551, 15
- (5) Bonafede A., Feretti L., Giovannini G., Govoni F., Murgia M., Taylor G. B., Ebeling H, Allen S., Gentile G., Pihlstrom Y., 2009, A&A in press; arXiv:0905.3552
- (6) Böhringer, H.; Voges, W.; Huchra, J. P.; et al. 2000, ApJS 129, 435
- (7) Böhringer, H., Schuecker, P., Guzzo, L., et al., 2004, A&A, 425, 367
- (8) Brunetti G., 2004, JKAS 37, 493
- (9) Brunetti G., Setti G., Feretti L., Giovannini G., 2001, MNRAS 320, 365
- (10) Brunetti G., Blasi P., Cassano R., Gabici S., 2004, MNRAS 350, 1174
- (11) Brunetti G., Lazarian A., 2007, MNRAS 378, 245
- (12) Brunetti, G.; Venturi, T.; Dallacasa, D., Cassano, R., Dolag, K., Giacintucci, S., Setti, G., 2007, ApJ, 670, 5
- (13) Brunetti, G., Giacintucci, S., Cassano, R., Lane, W., Dallacasa, D., Venturi, T., Kassim, N. E., Setti, G., Cotton, W. D., Markevitch, M., 2008, Nature, 455, 944
- (14) Brunetti, Cassano, Dolag, Setti 2009, A&A in press, arXiv:0909.2343
- (15) Brüggen, M., Ruszkowski, M., Simionescu, A., Hoeft, M., Dalla Vecchia, C., 2005, ApJ, 631, L21
- (16) Buote D.A, 2001, ApJ 553, 15
- (17) Cassano R. & Brunetti G., 2005, MNRAS 357, 1313
- (18) Cassano R., Brunetti G., Setti G., 2006a, MNRAS 369,1577
- (19) Cassano R., Brunetti G., Setti G., 2006b, Astronomische Nachrichten 327, 557
- (20) Cassano, R.; Brunetti, G.; Venturi, T., Setti, G., Dallacasa, D., Giacintucci, S., Bardelli, S., 2008, A&A, 480, 687
- (21) Cohen, A. S.; Lane, W. M.; Cotton, W. D.; Kassim, N. E.; Lazio, T. J. W.; Perley, R. A.; Condon, J. J.; Erickson, W. C., 2007, AJ 134, 1245
- (22) Condon J.J., Cotton W.D., Greisen E.W., Yin Q.F., Perley R.A., Taylor G.B., Broderick J.J., 1998, AJ 115, 1693
- (23) Dallacasa, D.; Brunetti, G.; Giacintucci, S.; Cassano, R.; Venturi, T.; Macario, G.; Kassim, N. E.; Lane, W.; Setti, G., 2009, ApJ 699, 1288
- (24) Dennison B., 1980, ApJ 239
- (25) Dolag K., Bartelmann M., Lesch H, 2002, A&A, 387, 383
- (26) Ebeling H., Voges W., Bohringer H., Edge A. C., Huchra J. P., & Briel U. G. 1996, MNRAS 281, 799
- (27) Ebeling H., Edge A.C., Böhringer H., et al.,1998 MNRAS, 301, 881
- (28) Ebeling H., Edge A.C., Allen S.W., et al., 2000, MNRAS 318, 333
- (29) Ebeling, H.; Edge, A. C.; Henry, J. P., 2001, ApJ, 553, 668
- (30) Ellingson S.W., Clarke T.E., Cohen A., Craig J., Kassim N.E., Pihlstrom Y., Rickard L.J., Taylor G.B., Proc. of the IEEE, Vol. 97, Issue 8, pp 1421-1430
- (31) Enßlin T. A., Biermann P. L., Klein U., & Kohle S. 1998, A&A, 332, 395
- (32) Enßlin T.A., Röttgering H., 2002, A&A, 396, 83
- (33) Feretti L., 2005, in ’X-Ray and Radio Connections’, published electronically by NRAO, eds. L.O.Sjouwerman and K.K.Dyer
- (34) Ferrari, C., Govoni, F., Schindler, S., Bykov, A. M., Rephaeli, Y., 2008, Space Science Reviews, 134, 93
- (35) Fujita Y., Takizawa M., Sarazin C.L., 2003, ApJ 584, 190
- (36) Giovannini G., Tordi M., Feretti L., 1999, NewA 4, 141, (GTF99)
- (37) Governato, F.; Babul, A.; Quinn, T.; Tozzi, P.; Baugh, C. M.; Katz, N.; Lake, G., 1999, MNRAS 307, 949
- (38) Govoni F., Markevitch M., Vikhlinin A., VanSpeybroeck L., Feretti, L., Giovannini G., 2004, ApJ 605, 695
- (39) Govoni F., Feretti L., Giovannini G., Böringer H., Reiprich T.H., Murgia M., 2001, A&A, 376, 803
- (40) Hwang C.-Y., 2004, JKAS 37, 461
- (41) Hoeft, M., Brüggen, M., 2007, MNRAS, 375, 77
- (42) Hoeft, M.; Brüggen, M.; Yepes, G.; Gottlöber, S.; Schwope, A., 2008, MNRAS 391, 1511
- (43) Jenkins, A.; Frenk, C. S.; White, S. D. M.; Colberg, J. M.; Cole, S.; Evrard, A. E.; Couchman, H. M. P.; Yoshida, N., 2001, MNRAS, 321, 372
- (44) Liang H., Hunstead R.W., Birkinshaw M., Andreani P., 2000, ApJ 544, 686
- (45) Lacey, C., & Cole, S. 1993, MNRAS, 262, 627
- (46) Miniati F., Jones T.W., Kang H., Ryu D., 2001, ApJ562, 233
- (47) Petrosian V., 2001, ApJ 557, 560
- (48) Pfrommer, C., Enßlin, T. A., Springel, V., 2008, MNRAS, 385, 1211
- (49) Press W.H., Schechter P., 1974, ApJ 187, 425
- (50) Rengelink, R. B.; Tang, Y.; de Bruyn, A. G.; Miley, G. K.; Bremer, M. N.; Röttgering, H. J. A.; Bremer, M. A. R., 1997, A&AS 124, 259
- (51) Röttgering, H. J. A.; Braun, R.; Barthel, P. D., et al. 2006, proceedings of the conference “Cosmology, galaxy formation and astroparticle physics on the pathway to the SKA”, Oxford, April 10-12 2006, astro-ph/0610596
- (52) Ryu, D., Kang, H., Hallman, E., Jones, T.W., 2003, ApJ 593, 599
- (53) Ryu, D., Kang, H., Cho, J., Das, S., 2008, Science, 320, 909
- (54) Sarazin C.L., 1999, ApJ 520, 529
- (55) Schlickeiser R., Sievers A., Thiemann H., 1987, A&A 182, 21
- (56) Schlickeiser, R.; Miller, J. A., 1998, ApJ 492, 352
- (57) Schuecker P., Böhringer H.; Reiprich T.H., Feretti L., 2001, A&A 378, 408
- (58) Springel, V. et al. 2005, Nature, 435, 629
- (59) Subramanian, K., Shukurov, A., Haugen, N. E. L., 2006, MNRAS 366, 1437
- (60) Thierbach, M., Klein, U., & Wielebinski, R. 2003, A&A, 397, 53
- (61) Trümper, J., 1993, Science, 260, 1769
- (62) Venturi T., Giacintucci S., Brunetti G., Cassano R., Bardelli S., Dallacasa D., Setti G., 2007, A&A 463, 937
- (63) Venturi, T., Giacintucci, S., Dallacasa, D., Cassano, R., Brunetti, G., Bardelli, S., Setti, G., 2008, A&A, 484, 327
- (64) van Weeren R.J., Röttgering H.J.A., Bruggen M, Cohen A., 2009, A&A in press; arXiv:0905.3650