Optical Observations of the Rapidly Expanding
Type Ia Supernova 2007gi
Abstract
We present optical photometry and spectra for the Type Ia supernova (SN Ia) 2007gi in the nearby galaxy NGC 4036. SN 2007gi is characterized by extremely high-velocity (HV) features of the intermediate-mass elements (Si, Ca, and S), with expansion velocities () approaching 15,500 km s-1 near maximum brightness (compared to 10,600 km s-1 for SNe Ia with normal ). SN 2007gi reached a -band peak magnitude of 13.250.04 mag with a decline rate of (true) = 1.330.09 mag. The -band light curve of SN 2007gi demonstrated an interesting two-stage evolution during the nebular phase, with a decay rate of 1.160.05 mag (100 days)-1 during –90 days and 1.61 mag (100 days)-1 thereafter. Such a behavior was also observed in the HV SN Ia 2006X, and might be caused by the interaction between supernova ejecta and circumstellar material (CSM) around HV SNe Ia. Based on a sample of a dozen well-observed -band (or unfiltered) light curves of SNe Ia, we confirm that the HV events may have a faster rise time to maximum than the ones with normal .
1 Introduction
Type Ia supernovae (SNe Ia) have been successfully utilized over the past decade to measure the cosmic expansion history (Riess et al., 1998; Perlmutter et al., 1999) and explore the nature of dark energy (e.g., Riess et al., 2004, 2007; Astier et al., 2006; Wood-Vasey et al., 2007). The foundation for the utility of SNe Ia as a cosmological tool is that some distance-independent observables, such as the light-curve shape parameters (Phillips, 1993; Riess et al., 1995; Jha et al., 2007; Perlmutter et al., 1997), the color parameters (Wang et al., 2003, 2005), or both (Tripp, 1998; Guy et al., 2005), have been found to correlate with their peak luminosity. These empirical correlations can be used to calibrate the luminosities of SNe Ia and measure their distances with a precision of 9%.
A recent result suggests that the luminosity standardization of SNe Ia can be improved to a level of 6% by separating the SNe into two groups based on a spectroscopic criterion [for details, see Wang et al. (2009a), hereafter W09]. The expansion velocity () of the SN ejecta is inferred from the blueshift of the absorption minimum of Si‘II 6355, and the SNe are divided into one group with normal (hereafter “Normal” SNe Ia) and the other group with high (hereafter “HV” SNe Ia)111See Benetti et al. (2005) and Branch et al. (2006) for a similar classification based on the velocity gradient and the strength of the absorption features, respectively.. W09 found that the two groups have either different extinction laws or color evolution. The cause for such a dichotomy might be related to the properties of their progenitors. The HV SNe Ia are characterized by stronger absorption features of intermediate-mass elements (IMEs, such as Si, S, and Ca) at higher velocities as well as a red color around maximum brightness.
SN 2002bo and SN 2006X are two of the best-studied examples of this class (Benetti et al., 2004; Wang et al., 2008a). In particular, the interstellar Na I D lines were found to show significant variations in the spectra of SN 2006X, likely pointing to the presence of CSM produced by the progenitor system (Patat et al., 2007; Chugai, 2008). The possible detection of CSM around SN 2006X is also supported by a flat evolution of the late-time light curve (Wang et al., 2008a) and a detection of light echoes (Wang et al., 2008b; Crotts & Yourdon, 2008). Similar variability of the Na I D lines was also observed in SNe 1999cl and 2007le (Blondin et al., 2009; Simon et al., 2009), two other members of the HV SN Ia class. Contrasting with this, multi-epoch, high-resolution spectral observations of SN 2007af, a Normal SN Ia, do not reveal any significant signature of CSM absorption (Simon et al., 2007). This raises the possibility that CSM might be preferentially present for the SNe Ia in the HV class.
In this paper, we present optical observations of another member of the HV SN Ia class, SN 2007gi. Our goal is to increase the sample and understand the properties of well-observed HV SNe Ia. Observation and data reductions are described in §2, while §3 presents the light curves, color curves, reddening estimate, and an analysis of the rise time. Section 4 presents the spectral evolution. Our discussions and conclusions are given in §5.
2 Observations and Data Reductions
SN 2007gi was discovered by K. Itagaki (IAUC 8864) on July 23.49 (UT dates are used throughout this paper) at = 12h01m23s.4, = +61∘53′33′′.8 (J2000.0) in the lenticular galaxy NGC 4036. An optical spectrum taken on 2007 Aug. 4.90 revealed that SN 2007gi was a very young SN Ia at a phase 10 days before maximum brightness (Harutyunyan, Benetti & Cappellaro, 2007), with an expansion velocity measured from the absorption minimum of Si II 6355 as 20,500 km s-1. This velocity is much higher than what is observed for a Normal SN Ia at a similar phase, but is typical for members of the HV SN Ia class, such as SNe 1983G, 1997bp, and 2006X (Benetti et al., 2005; Wang et al., 2008a).
2.1 Photometry
Photometry of SN 2007gi was obtained primarily with the 0.8-m Tsinghua-NAOC Telescope (TNT) located at NAOC Xinglong Observatory222This telescope is operated by Tsinghua University and the National Astronomical Observatories of China (NAOC).. This telescope is equipped with a pixel back-illuminated CCD, with a field of view (FOV) of (scale pixel-1). Observations of SN 2007gi began on 2007 Aug. 8, 6 days before -band maximum, and continued for the next 6 months. SN 2007gi was also observed during its early rising phase (from to 7 days) with the Ultraviolet/Optical Telescope [UVOT; Roming et al. (2005)] onboard the Swift Observatory.
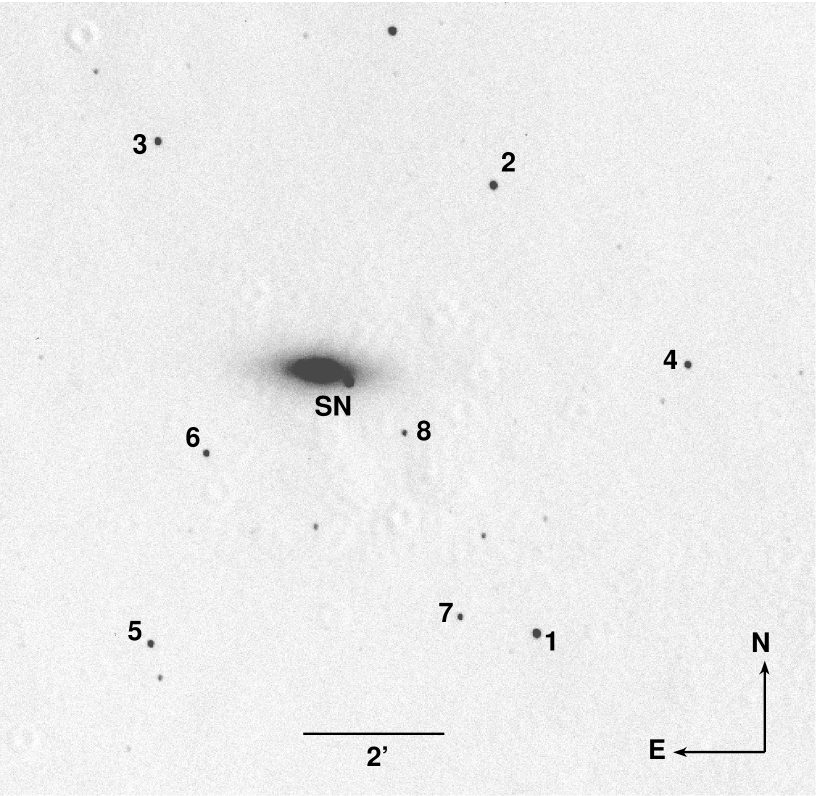
As shown in Figure 1, SN 2007gi is located just outside the central bulge of NGC 4036. To remove the light contamination from the host galaxy, we applied an image-subtraction technique before performing the photometry. Template images of NGC 4036 were obtained on 2008 May 24, roughly 300 days after maximum brightness. To perform the image subtraction, the image containing SN 2007gi is first geometrically registered to the corresponding template image; the fluxes of the foreground stars in the images are then scaled to the same level. The point-spread functions (PSFs) of these two images are convolved to match, and the template is then subtracted from the SN images. We finally performed standard PSF-fitting photometry to obtain the instrumental magnitudes for the SN and the local standard stars with the IRAF333IRAF, the Image Reduction and Analysis Facility, is distributed by the National Optical Astronomy Observatories, which are operated by the Association of Universities for Research in Astronomy (AURA), Inc., under cooperative agreement with the National Science Foundation. DAOPHOT package (Stetson, 1987).
Transformations from the instrumental magnitudes to the standard Johnson (Johnson et al., 1966) and Kron-Cousins (Cousins, 1981) systems were established by observing on photometric nights a series of Landolt (1992) standard stars covering a wide range of air masses and colors. A total of 4 photometric nights were used to calibrate 8 local standard stars in the field of SN 2007gi. Table 1 lists their final calibrated magnitudes (Li, 2008). These local stars are then used to transform the instrumental magnitudes of SN 2007gi to the standard system, and the final results of the photometry are listed in Table 2. The error bars (in parentheses) include both the uncertainty in the calibration of the local standard stars and the uncertainty of the instrumental magnitudes due to photon noise and image subtraction.
The - and -band magnitude obtained by UVOT on three earlier epochs are also listed in Table 2. The Swift/UVOT photometry was reduced in a manner similar to that described in Brown et al. (2009) and using the photometric zeropoints of Poole et al. (2008). In the absence of template images of the host galaxy, regions around the galaxy at the same distance from the nucleus as the SN were used to estimate the underlying count rate and its uncertainty.
Given the sparse spectroscopic observations of SN 2007gi (§4), no - or -corrections were applied to the photometry presented in this paper.
2.2 Spectroscopy
Optical spectra of SN 2007gi were obtained primarily with the 3-m Shane telescope at Lick Observatory using the Kast double spectrograph (Miller & Stone, 1993). A spectrum was also obtained on 2007 Nov. 12 with the Low Resolution Imaging Spectrometer (LRIS; Oke et al. (1995)] mounted on the 10 m Keck I telescope on Mauna Kea, Hawaii. The journal of spectroscopic observations is given in Table 3.
All of the spectra were reduced by standard IRAF routines. In order to avoid contamination from the host galaxy, each spectrum of the SN was extracted carefully, and the flux calibration was done with spectra of standard stars observed on the same night at similar air masses. The spectra were corrected for continuum atmospheric extinction using mean extinction curves for Lick Observatory, and telluric lines were removed from the data. During the observations, the slit was always aligned near the parallactic angle to avoid chromatic losses due to atmospheric dispersion (Filippenko, 1982).
3 Light Curves of SN 2007gi
3.1 Optical Light Curves
The light curves of SN 2007gi are presented in Figure 2. A polynomial fit to the -band light curve around maximum brightness yields = 13.250.04 mag on JD 2,454,327.020.71 (2007 August 14.5). This indicates that our observations started from about 11 days and extended to +188 days with respect to the -band maximum. The -band light curve reached a peak magnitude of 13.080.03 mag on JD 2,454,328.480.72, about 1.5 days after (B).
Using a template-fitting method [similar to that used in Hamuy et al. (1996) but expanded to include more templates] to fit the - and -band light curves, we derived = 1.310.08 mag and = 0.170.05 mag. The color around the maximum is found to be slightly redder than the unreddened loci (Wang et al., 2009b), suggesting some reddening toward SN 2007gi. The SALT2 method (Guy et al., 2007) yields a best-fit stretch factor of = 0.880.02, which corresponds to (B) = 1.400.10 from the transforming relation between and (B) by Altavilla et al. (2004). The best-fit templates from MLCS2k2 (Jha et al., 2007) are also overplotted in Figure 2. One can see that the light curves of SN 2007gi can be well fit by both SALT2 and MLCS2k2.
In Figure 3, we compare the light curves of SN 2007gi with those having similar values: SNe 1994D (Richmond et al., 1995; Patat et al., 1996), 1996X (Salvo et al., 2001), 2002bo (Benetti et al., 2004), 2002dj (Pignata et al., 2008), 2002er (Pignata et al., 2004; Kotak et al., 2005), 2004eo (Pastorello et al., 2007), and 2006X (Wang et al., 2008a). Among these objects, SNe 2002bo, 2002dj, 2006X, and 2007gi belong to the HV group, while SNe 1994D, 1996X, and 2004eo belong to the Normal group. SN 2002er may be a transitional object linking the Normal and HV groups (W09).
Compared to the Normal SNe Ia in the band, SN 2007gi appears relatively brighter and declines slowly when entering the nebular phase. For convenience of comparison, we introduce a quantity , which is the flux ratio measured at and days with respect to the maximum. The ratio is found to be 19.90.7 for SN 2007gi, which is similar to that of SN 2006X (17.20.6) but noticeably smaller than that of SN 1994D (27.30.6), SN 1996X (25.42.0), and SN 2004eo (24.21.2). Thus, the HV objects seem to have systematically smaller peak-to-tail contrast than the Normal objects. Close inspection of Figure 3a also reveals that there may be a break in the light-curve evolution for SN 2007gi at days. The decay rate is found to be 1.160.05 mag (100 days)-1 during the period from days to days, similar to that measured for SN 1984A and SN 2002bo at the same phase. The decay becomes steeper after days, with = 1.610.04 mag (100 days)-1. Such a two-stage evolution also exists in SN 2006X, but it is not unambiguously present in the cases of SNe 1984A and 2002bo due to poor photometric coverage in the nebular phase. Future observations will be needed to determine whether this trend is universal for all HV SNe Ia.
In contrary to the -band light curve, the -band light curves of SN 2007gi do not exhibit a two-stage evolution in the nebular phase (see Figure 3b–d). Neither the flux contrast between the tail and peak nor the decay rate of the tail show significant differences among the objects in the comparison. A noticeable difference is that the secondary shoulder/maximum features at around +25 days in the bands appear more pronounced in the HV objects than those in the Normal ones (see Figures 3c and 3d). Part of this effect could be caused by significant extinction which shifts the effective passband to redder wavelengths [e.g., Wang et al. (2008a)]. As the extinction suffered by SN 2007gi is relatively low (§3.2), its prominent secondary shoulder is likely to be mostly intrinsic. According to Kasen (2006), the variation of the secondary maximum of the near-infrared (NIR) light curves is caused by the abundance stratification in SNe Ia and/or the progenitor metallicity.
One feature in Figures 3(a)–(d), though not easily discernible due to the crowdness of the data points, is that the HV SNe 2007gi, 2006X, and 2002bo seem to rise to the maximum at a faster rate than the Normal objects. Such a trend was also mentioned by Pignata et al. (2008) in the qualitative comparison of SN 2002dj. A quantitative analysis of the rise time is given in §3.3.
3.2 Color Curves and the Reddening
Figure 4 presents the optical color curves of SN 2007gi (, , ). Overplotted are the color curves of the other SNe in the light-curve comparison in Figure 3. All of the color curves are shifted to match the observed values of SN 2007gi at maximum. For the color, SN 2007gi exhibited a similar color evolution as the other SNe in the early phase ( days). At days, it has the reddest color of all the SNe. After the red peak at 25 days, SN 2007gi seems to become progressively bluer than the other SNe in the comparison, so by days it has the bluest color. Unfortunately, there is a gap in the range –60 days when SN 2007gi was behind the Sun, so the detailed evolution during this phase is not clear. The slope measured during –90 days is mag day-1, steeper than the Lira-Phillips relation [e.g., mag day-1; Lira (1995); Phillips et al. (1999)]. This was also noticed by Wang et al. (2008a) in the comparison study of SN 2006X. In fact, a steeper color-change slope than the Lira-Phillips relation in the nebular phase is found to be the case for most of the HV events (Wang, X., et al. 2009c, in preparation), suggesting that the reddening derived for them from their tail colors might be potentially biased toward a lower value. Despite the relatively large differences seen in the color evolution, the two classes of SNe Ia (HV and Normal) share similar and color evolution (Figures 4b–c).
The Galactic extinction toward NGC 4036/SN 2007gi is mag (Schlegel et al., 1998), corresponding to a color excess of mag [adopting the standard reddening law of Cardelli et al. (1989)]. The peak color, corrected for the Galactic reddening, is 0.150.05 mag. This corresponds to a host-galaxy reddening of mag under the assumption that the HV SNe Ia have intrinsic colors similar to those of the Normal objects near maximum brightness (W09). Assuming , as suggested by W09 for the HV SNe Ia, the extinction caused by the dust within the host galaxy of SN 2007gi is mag.
3.3 The Late-Time HST Photometry
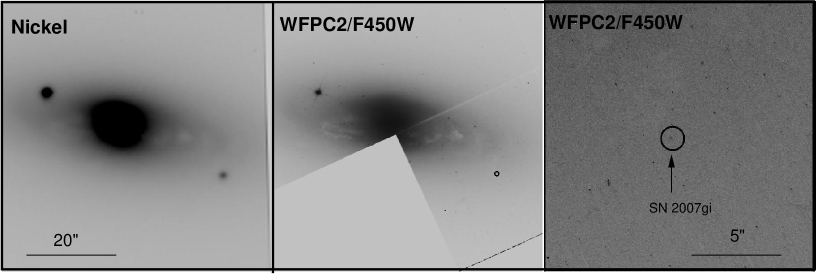
The late-time evolution of SNe can provide valuable constraints on the SN environments as well as their explosion models [e.g., Milne, The & Leising (2001); Li et al. (2002); Sollerman et al. (2004)]. The field of SN 2007gi was imaged with the Wide Field Planetary Camera 2 (WFPC2) onboard the Hubble Space Telescope (HST) on 2009 March 26, 600 days after discovery, as part of HST program GO-10877 (PI: Weidong Li). A cosmic-ray-split pair of observations was observed with each of the F435W, F555W, F675W, and F814W filters. To locate SN 2007gi on these WFPC2 images, we follow the technique detailed by Li et al. (2007). We use an -band image of SN 2007gi taken with the Lick Observatory 1-m Nickel telescope on 2007 Dec. 15, and identify four stars that are present in the WFPC2 images. An astrometric solution using these four stars yields a relatively poor precision of due to the faintness of the stars and the resolution of the Nickel image. Nevertheless, within the 1 error radius of the astrometric solution, we identify a single star which we presume to be SN 2007gi. Figure 5 demonstrates this process.
To measure the magnitudes of SN 2007gi in the WFPC2 images, we have used the “HSTphot” package developed by Dolphin (2000a). After performing the preprocessing suggested by the HSTphot manual, including removal of cosmic rays, defects, bad pixels, and hot pixels, we measure the magnitudes in the WFPC2 system. These magnitudes are then converted to the ground-based broad-band magnitudes using the procedure described by Dolphin (2000b). We measure the following magnitudes for SN 2007gi: = 24.490.10, = 24.200.13, = 24.630.28, and = 23.500.12.
SN 2007gi was found to decline by 11.1 mag in the band by 590 days after the maximum. This flux drop is consistent with the corresponding values observed in SN 1996X and SN 2003hv at comparable phases (Salvo et al., 2001; Leloudas et al., 2009). SN 1991T and 1998bu, which showed evidence for the presence of light echoes (Schmidt et al., 1994; Cappellaro et al., 2001), declined by mag within 590 days since the maximum. In addition, the color of SN 2007gi in the nebular phase is found to be inconsistent with that predicted by the light-echo scenario. Thus. we conclude that an interstellar echo may not be present in SN 2007gi.
3.4 Rise Time
The time spent by a SN from explosion to maximum brightness is defined as the rise time , an important parameter that links the explosion physics to the progenitors of SNe Ia (Leibundgut & Pinto, 1992). The rise time of a SN Ia is determined primarily by the rate at which the interior energy is released and subsequently diffuses to the surface of the supernova. Assuming that the luminosity of a SN Ia evolves as an expanding fireball at very early phases (Goldhaber et al., 1998), the rise time can be derived from the relation (Riess et al., 1999)
| (1) |
where is the ”speed” of the rise of the luminosity and is the time elapsed since maximum brightness.
In this subsection, we attempt to examine the difference in between HV and Normal SNe Ia. Instead of adopting the -band light curve (Riess et al., 1999; Strovink, 2007), our analysis uses the -band light curve, as our earliest photometric data points are usually obtained with a clear filter (used in our SN search) which is very close to broad-band (Li et al., 2003). Only those data obtained earlier than one week before the -band maximum are used in the fitting.
The computed rise times for SN 2007gi and several other well-observed SNe Ia are plotted against the decline rate in Figure 6. The SNe are divided into the HV (filled circles) and Normal (open squares) groups according to the classification scheme defined by W09. In each group, correlates with : slower decliners have longer rise times. The HV SNe Ia appear to have a faster (i.e., shorter) rise time than the Normal ones at the same with the exception of SN 1994D, which lacks published photometry during the very early phases. A similar trend was also noted by Pignata et al. (2008). Assuming comparable amounts of nickel are synthesized during the explosion, the rise time of a SN Ia is affected by the efficiency of the photon diffusion, which depends on the opacity and the location of the photosphere. A shorter could indicate that compared with a Normal SN Ia, the photosphere of a HV SN Ia is less effectively heated by the -ray photons inside the ejecta, or becomes optically thin at a faster pace due to the more rapid expansion (see the discussion in §4.3).
4 Optical Spectra
We have 5 optical spectra of SN 2007gi obtained with the 3.0-m Shane telescope at Lick Observatory and the Keck I 10-m telescope at the W. M. Keck Observatory, spanning from to days since -band maximum brightness. As shown in Figure 7, the spectral evolution around maximum brightness generally follows that of a normal SN Ia but is characterized by very broad and highly blueshifted absorption features at 3600 Å (Ca II H&K), 6000 Å (Si II 6355), and 8000 Å (Ca II NIR triplet).
4.1 Temporal Evolution of the Spectra
In Figure 8, we compare the spectra of SN 2007gi with those of SNe Ia having similar values at four selected epochs (, , +6, and +3 months since the maximum). All spectra have been corrected for the reddening and the redshifts of the host galaxies. The reddening of each comparison SN Ia is taken from Table 1 in W09, and the value is assumed to be 1.57 for the HV SNe Ia and 2.36 for the Normal objects according to the analysis W09.
At days (Figure 8a), the spectrum of SN 2007gi is characterized by lines of singly ionized IMEs (Si, S, Mg, and Ca). The absorption features of Si II 6355 and Ca II H&K in SN 2007gi are deep and broad, comparable to those in the HV SN Ia 2002bo but significantly stronger than those in the Normal SNe 1994D, 2002er, and 2004eo. Around maximum brightness (Figure 8b), we measured a line-strength ratio of Si II 5972 to Si II 6355, known as (Si II) (Nugent et al., 1995), to be for SN 2007gi. This is a relatively small (Si II) value and usually indicates an overluminous event (Nugent et al., 1995). Similar low values of (Si II) are observed for the other two HV objects, SNe 2006X and 2002bo.
By one week after maximum (Figure 8c), the strong absorptions of Si II and Ca II lines are still present in the HV objects (SNe 2007gi, 2002bo, 2002dj, and 2006X), but the W-shape S II lines have almost vanished. At months (Figure 8d), the spectra are dominated by iron lines whose strength is similar in all of the objects, and a strong Ca II NIR absorption trough. SN 2006X was found to show a prominent near-UV excess starting from days, perhaps due to a local light echo or an interaction of the SN ejecta with circumstellar material (Wang et al., 2008b). Close inspection of the day spectrum of SN 2007gi reveals a flux excess at the blue end when compared to the Normal SNe Ia, consistent with its bluer color at this phase (§3.2).
4.2 Expansion Velocity of the Ejecta
The blueshift of the absorption minima of some spectral features may approximately trace the location of the photosphere in the early phases of a SN. In this subsection, we examine some strong lines such as Si II 6355 and Ca II H & K, as well as a weak line S II 5640. The derived evolution of the expansion velocity ()444The relativistic effect is taken into account when calculating the ejecta velocities of the SNe. of the SNe is shown in Figure 9. All of the velocities have been corrected for the redshifts of the host galaxies.
SN 2007gi is one of the objects with the highest expansion velocities in the comparison, with = 15,500 300 km s-1 at day. By comparison, the typical value of for a Normal SN Ia is 10,600 400 km s-1 at this epoch (W09). The velocities inferred from the Ca II H K and S II 5640 lines are about 21,500 km s-1 and 12,800 km s-1 near maximum, respectively, which are also significantly higher than those of the Normal SNe Ia.
These high values of the IMEs (Si, S, and Ca) can often be interpreted as being caused by a density/abundance enhancement in the outer ejecta of the SNe (Lentz et al., 2001; Benetti et al., 2004). Several scenarios have been proposed to account for such an enhancement. The metallicity effect was examined by Benetti et al. (2004), who found that increasing the metallicity in the C+O layers by a factor of 10 is still far from explaining the high seen in SN 2002bo. The delayed detonation models were proposed to explain the HV features in SN 1984A and SN 2002bo (Lentz et al., 2001; Benetti et al., 2004), as intense nucleosynthesis in the outer layers results in an enhancement of the density of the IMEs at higher velocities, which subsequently increases the opacity in the outer regions and results in a photosphere that is moving at a high velocity. An interaction between the SN ejecta and CSM could produce the high-velocity Ca II lines (Gerardy et al., 2004) and may also affect the Si II lines (Tanaka et al., 2006). Detailed analysis of the reasons for the HV features is beyond the scope of this paper.
4.3 The Photospheric Temperature
As discussed by Nugent et al. (1995), Bongard et al. (2006), and Hachinger et al. (2006), the flux ratio (Si II) between Si II 5972 and Si II 6355 is an indicator of the photospheric temperature and the luminosity of a SN Ia: a value of (Si II) means a more luminous SN Ia with a higher photospheric temperature. The unusually low (Si II) value of 0.07 for SN 2007gi at day thus suggests a rather high photospheric temperature. On the other hand, the strength of Si III 4560 (actually Si III 4553, 4568) has been proposed as another photospheric temperature tracer (Benetti et al., 2004), and is stronger for a SN Ia having a higher temperature. The Si III 4560 line is weak in SN 2007gi, suggesting a rather low photospheric temperature. The two temperature indicators thus provide conflicting results for SN 2007gi.
In an attempt to further constrain the photospheric temperature in SN 2007gi, we used the parameterized resonance scattering synthetic-spectrum code SYNOW (Fisher et al., 1999; Branch et al., 2005) to fit the near-maximum spectra of SN 2007gi. The basic input parameters are taken from Table 1 in Branch et al. (2005), with the blackbody temperature and the velocity at the photosphere as free parameters. Figure 10 shows our best SYNOW fit for the day spectrum, with = 15,500 km s-1 and K. The high is consistent with the high measured directly from the spectrum (§4.2). The blackbody temperature , on the other hand, is rather typical of other SNe Ia at this phase. For example, Branch et al. (2005) estimated K for the Normal SN Ia 1994D at day, while our best SYNOW fit to a spectrum of the Normal SN Ia 2004eo at day yields K.
Our SYNOW analysis thus suggests that (Si II) is not a good photospheric temperature indicator for the HV SNe Ia. The exact cause for this is not clear. One possibility is contamination by Fe II and Fe III lines. Bongard et al. (2008) suggested that the Fe lines might weaken the Si II 5972 absorption line even at low .
5 Discussion and Conclusions
In this paper, we present optical photometry and spectroscopy of SN 2007gi, a SN Ia with an extremely high expansion velocity measured from IMEs (Si, Ca, and S). We also conduct a comparison study for a sample of SNe Ia with high and normal expansion velocities (HV and Normal, respectively) to investigate differences in their photometric and spectroscopic behaviors.
The -band light curve of SN 2007gi shows a two-stage evolution: a decay rate of mag (100 days)-1 during –90 days and (100 days)-1 thereafter. The latter decay rate is similar to those observed in Normal SNe Ia. This two-stage evolution is also present in the HV SN Ia 2006X. More late-time observations of the HV objects are necessary to establish whether this is a universal property. The color of SN 2007gi is found to evolve at a faster slope than that of Normal SNe Ia during the nebular phase, a trend that is also observed for the HV SN Ia 2006X (Wang et al., 2008a) and most of the other HV events (Wang, X., et al. 2009c, in preparation). SN 2007gi was detected at days after maximum in HST/WFPC2 images. The magnitudes and colors at this very late-time epoch suggest that SN 2007gi may not be contaminated by a light echo on interstellar scales.
Using a dozen well-observed SNe Ia, we confirm the previous claim that HV SNe Ia tend to have a faster rise time than Normal SNe Ia (Pignata et al., 2008): at the same value of , the rise time of the HV objects is shorter than that of the Normal objects by 1–2 days.
The spectral evolution of SN 2007gi is characterized by high expansion velocities measured from the absorption lines. The value of is measured to be 15,500 km s-1 at day, 50% higher than what is observed for Normal SNe Ia. A small flux ratio (Si II) = 0.070.03 is observed, which traditionally means a hot photospheric temperature in the SN ejecta. Our synthetic spectral analysis using the SYNOW code, on the other hand, suggests that SN 2007gi has a typical photospheric temperature compared with other Normal SNe Ia.
The two-stage evolution in the -band light curve of SN 2007gi may suggest that an additional energy source besides radioactive decay plays a role in the nebular phase. Dust scattering (a light echo) seems unlikely because the tail luminosity would have remained nearly constant for a long time, which is not the case for SN 2007gi. Nevertheless, the possibility of a local light echo on a small scale (due to CSM dust) cannot be completely ruled out. Another potential energy source is interaction with CSM; detection of variable sodium lines in the spectra of some HV events provides some evidence for this scenario. Assuming that the CSM lies at a distance of cm from the supernova, it is expected that the outermost ejecta will begin to interact with the CSM at 30 days after the maximum. This naturally accounts for a flatter evolution seen in the -band light curve of the HV SNe Ia after days. The difficulty with this scenario is the lack of convincing observational evidence for stripped material, such as low-velocity H emission in the nebular spectra [e.g., Mattila et al. (2005), but see Leonard et al. (2008) for alternative explanations regarding the observed lack of hydrogen], and the lack of spectral evidence in support of ongoing CSM interaction.
A possible explanation for the HV features observed in the HV SNe Ia is that there are density enhancements of the IMEs in the outer layers of the ejecta of the HV objects (due to a metallicity effect, delayed detonations, or CSM interaction); the -ray heating is less effective, and the photosphere is formed at an outer layer with a higher expansion velocity compared to the Normal objects.


| StaraaSee Figure 1 for a chart of SN 2007gi and the comparison stars. | |||||
|---|---|---|---|---|---|
| 1 | 13.860(002) | 0.823(003) | 2.392(016) | 0.475(002) | 0.726(002) |
| 2 | 14.233(002) | 0.860(003) | 2.702(020) | 0.482(003) | 0.697(002) |
| 3 | 14.833(002) | 0.742(004) | 2.399(022) | 0.395(004) | 0.585(004) |
| 4 | 15.375(004) | 1.413(008) | 3.367(067) | 0.929(005) | 1.363(004) |
| 5 | 15.298(003) | 0.800(006) | 2.532(032) | 0.443(005) | 0.648(005) |
| 6 | 15.408(004) | 0.762(007) | 2.538(034) | 0.451(005) | 0.654(006) |
| 7 | 15.869(005) | 0.878(009) | 2.655(045) | 0.522(007) | 0.783(007) |
| 8 | 16.175(006) | 0.781(010) | 2.474(047) | 0.410(009) | 0.611(010) |
| UT Date | JD 2,450,000 | PhaseaaRelative to the epoch of -band maximum (JD = 2,454,327.02). | (mag) | (mag) | (mag) | (mag) |
|---|---|---|---|---|---|---|
| 2007 Aug 3 | 4316.17 | -10.85 | 15.170(0.048) | 14.940(0.055) | ||
| 2007 Aug 4 | 4317.70 | -9.32 | 14.510(0.050) | 14.420(0.045) | ||
| 2007 Aug 7 | 4320.18 | -6.84 | 13.870(0.052) | 13.840(0.053) | ||
| 2007 Aug 8 | 4321.02 | -6.00 | 13.678(0.016) | 13.615(0.029) | 13.488(0.021) | 13.553(0.035) |
| 2007 Aug 9 | 4322.03 | -4.99 | 13.505(0.015) | 13.450(0.028) | 13.391(0.034) | 13.446(0.029) |
| 2007 Aug 11 | 4324.03 | -2.99 | 13.323(0.021) | 13.269(0.048) | 13.190(0.018) | |
| 2007 Aug 12 | 4325.02 | -2.00 | 13.321(0.023) | 13.189(0.028) | 13.197(0.017) | 13.320(0.014) |
| 2007 Aug 14 | 4327.01 | -0.01 | 13.259(0.037) | 13.106(0.052) | 13.153(0.023) | 13.383(0.023) |
| 2007 Aug 15 | 4328.01 | +0.99 | 13.237(0.028) | 13.077(0.029) | 13.130(0.033) | 13.374(0.032) |
| 2007 Aug 21 | 4334.00 | +6.98 | 13.571(0.023) | 13.238(0.018) | 13.347(0.067) | 13.647(0.095) |
| 2007 Sep 3 | 4347.02 | +20.00 | 15.236(0.024) | 13.899(0.015) | 13.769(0.028) | 13.642(0.018) |
| 2007 Sep 4 | 4347.99 | +20.97 | 15.330(0.029) | 13.944(0.018) | 13.753(0.045) | 13.612(0.033) |
| 2007 Sep 5 | 4348.99 | +21.97 | 15.414(0.028) | 13.997(0.025) | 13.756(0.036) | |
| 2007 Sep 6 | 4349.99 | +22.97 | 15.533(0.047) | 14.089(0.041) | 13.804(0.050) | |
| 2007 Oct 13 | 4387.30 | +60.28 | 16.514(0.020) | 15.753(0.012) | 15.572(0.017) | 15.671(0.026) |
| 2007 Oct 16 | 4390.36 | +63.34 | 16.532(0.035) | 15.807(0.014) | 15.695(0.027) | 15.791(0.036) |
| 2007 Oct 21 | 4395.39 | +68.37 | 16.586(0.020) | 15.972(0.013) | 15.846(0.019) | 15.973(0.035) |
| 2007 Oct 22 | 4396.34 | +69.32 | 16.626(0.021) | 15.986(0.013) | 15.893(0.026) | 16.015(0.031) |
| 2007 Oct 24 | 4398.34 | +71.32 | 16.613(0.031) | 16.014(0.012) | 15.980(0.038) | 16.128(0.047) |
| 2007 Oct 25 | 4399.36 | +72.34 | 16.622(0.033) | 16.034(0.019) | 16.000(0.049) | 16.154(0.050) |
| 2007 Oct 29 | 4403.40 | +76.38 | 16.736(0.059) | 16.179(0.081) | 16.228(0.081) | |
| 2007 Nov 12 | 4417.38 | +90.36 | 16.857(0.016) | 16.551(0.020) | 16.612(0.017) | 16.643(0.056) |
| 2007 Nov 20 | 4425.36 | +98.34 | 17.028(0.014) | 16.735(0.010) | 16.889(0.014) | 16.979(0.027) |
| 2007 Nov 28 | 4433.36 | +106.34 | 17.174(0.033) | 16.961(0.022) | 17.120(0.020) | 17.145(0.035) |
| 2007 Dec 22 | 4457.36 | +130.34 | 17.606(0.049) | 17.425(0.053) | 17.771(0.041) | 17.729(0.057) |
| 2008 Jan 6 | 4472.36 | +145.34 | 17.845(0.023) | 17.861(0.032) | 18.301(0.044) | 18.218(0.086) |
| 2008 Jan 9 | 4475.26 | +148.24 | 17.852(0.057) | 17.907(0.058) | 18.315(0.065) | 18.274(0.140) |
| 2008 Feb 18 | 4515.29 | +188.27 | 18.480(0.030) | 18.520(0.126) |
| Stretch | aaUsing 24.6 Mpc (Tully, 1988) as the distance, = 71 km s-1 Mpc-1. | Explosion velocitybbBased on Si II 6355 absorption minimum at maximum. | TemperatureccThe blackbody temperature given by SYNOW at maximum. | ||
|---|---|---|---|---|---|
| mag | mag | km s-1 | mag | K | |
| 0.88 0.02 | 1.31 0.09 | -19.26 0.10 | 15, 500 300 | 0.17 0.04 | 11, 500 |
| UT Date | JD 2,450,000 | PhaseaaRelative to the epoch of -band maximum (JD = 2,454,327.02). | Range(Å) | Resolution(Å)bbApproximate spectral resolution (FWHM intensity). |
|---|---|---|---|---|
| 2007 Aug 7 | 4319.50 | -7.52 | 3300–10,000 | 5-12 |
| 2007 Aug 14 | 4326.50 | -0.52 | 3300–10,000 | 5-12 |
| 2007 Aug 21 | 4333.50 | +6.48 | 3300–10,000 | 5-12 |
| 2007 Nov 12 | 4416.50 | +89.48 | 3100–9200 | 6 |
| 2008 Jan 15 | 4480.50 | +153.48 | 3300–10,000 | 5-12 |
References
- Altavilla et al. (2004) Altavilla, G., et al. 2004, MNRAS, 349, 1344
- Astier et al. (2006) Astier, P., et al. 2006, A&A, 447, 31
- Benetti et al. (2004) Benetti, S., et al. 2004, MNRAS, 348, 261
- Benetti et al. (2005) Benetti, S., et al. 2005, ApJ, 623, 1011
- Blondin et al. (2009) Blondin, S., et al. 2009, ApJ, 693, 207
- Bongard et al. (2006) Bongard, S., Baron, E., Smadja, G., Branch, D., & Hauschildt, P. H. 2006, ApJ, 647, 513
- Bongard et al. (2008) Bongard, S., Baron, E., Smadja, G., Branch, D., & Hauschildt, P. H. 2008, ApJ, 687, 456
- Branch et al. (2005) Branch, D., et al. 2005, PASP, 117, 545
- Branch et al. (2006) Branch, D., et al. 2006, PASP, 118, 560
- Brown et al. (2009) Brown, P. et al. 2009, AJ, 137, 4517
- Cappellaro et al. (2001) Cappellaro, E., et al. 2001, ApJ, 549, L215
- Cardelli et al. (1989) Cardelli, J. A., Clayton, G. C., & Mathis, J. S. 1989, ApJ, 345, 245
- Chugai (2008) Chugai, N., N., 2008, Astronomy Letters, 34, 389
- Cousins (1981) Cousins, A. W. J. 1981, S. African Astron. Obs. Circ., 6, 4
- Crotts & Yourdon (2008) Crotts, A., & Yourdon, D. 2008, ApJ, 689, 1186
- Dolphin (2000a) Dolphin, A. E. 2000a, PASP, 112, 1383
- Dolphin (2000b) Dolphin, A. E. 2000b, PASP, 112, 1397
- Elias-Rosa et al. (2006) Elias-Rosa, N., et al. 2006, MNRAS, 369, 1880
- Filippenko (1982) Filippenko, A. V. 1982, PASP, 94, 715
- Fisher et al. (1999) Fisher, A., et al. 1999, MNRAS, 304, 67
- Gerardy et al. (2004) Gerardy, C., et al. 2004, ApJ, 607, 391
- Goldhaber et al. (1998) Goldhaber, G., et al. 1998, A&AS, 113, 1325
- Guy et al. (2005) Guy, J., et al. 2005, A&A, 443, 781
- Guy et al. (2007) Guy, J., et al. 2007, A&A, 466, 11
- Hachinger et al. (2006) Hachinger, S., Mazzali, P. A., & Benetti, S. 2006, MNRAS, 370, 299
- Harutyunyan, Benetti & Cappellaro (2007) Harutyunyan, A., Benetti, S., & Cappellaro, E. 2007, CBET, 1021, 1
- Hicken et al. (2009) Hicken, M., et al. 2009, arXiv:0901.4787v3
- Jha et al. (2007) Jha, S., Riess, A. G., & Kirshner, R. P. 2007, ApJ, 695, 122
- Johnson et al. (1966) Johnson, H. L., Iriarte, B., Mitchell, R. I., & Wisniewskj, W. Z. 1966, Comm. Lunar Planet. Lab., 4, 99Z. ed. R. Wang (Cambridge: Cambridge Univ. Press), 41
- Kasen (2006) Kasen, D. 2006, ApJ, 649, 939
- Kotak et al. (2005) Kotak, R., et al. 2005, A&A, 436, 1021
- Krisciunas et al. (2003) Krisciunas, K., et al. 2003, AJ, 125, 166
- Landolt (1992) Landolt, A. U. 1992, AJ, 104, 340
- Leibundgut & Pinto (1992) Leibundgut, B., & Pinto, P. A. 1992, ApJ, 401, 49
- Leloudas et al. (2009) Leloudas, G., et al. 2009, arXiv:0908.0537
- Lentz et al. (2001) Lentz, J. E., Baron, E., Branch, D., & Hauschildt, P. H. 2001, ApJ, 547, 402
- Leonard et al. (2008) Leonard, D. C., et al. 2008, PASP, 120, 1259
- Li (2008) Li, J. 2008, PhD thesis, Tsinghua University
- Li et al. (2002) Li, W., et al. 2002, PASP, 114, 403
- Li et al. (2003) Li, W., et al. 2003, 586 L9
- Li et al. (2007) Li, W., et al. 2007, ApJ, 661, 1013
- Lira (1995) Lira, P. 1995, Master thesis, Univ. Chile
- Lira et al. (1998) Lira, P., et al. 1998, AJ, 115, 234
- Mattila et al. (2005) Mattila, S., et al. 2005, A&A, 443, 649
- Miller & Stone (1993) Miller, J. S., & Stone, R. P. S. 1993, Lick Obs. Tech. Rep. 66
- Milne, The & Leising (2001) Milne, P. A., The, L. S., & Leising, M. D. 2001, ApJ, 559, 1019
- Nugent et al. (1995) Nugent, P., et al. 1995, 455, L147
- Oke et al. (1995) Oke, J. B., et al. 1995, PASP, 107, 375
- Pastorello et al. (2007) Pastorello, A., et al. 2007, MNRAS, 376, 1301
- Patat et al. (1996) Patat, F., et al. 1996, MNRAS, 278, 111
- Patat et al. (2007) Patat, F., et al. 2007, Science, 317, 924
- Perlmutter et al. (1997) Perlmutter, S., et al. 1997, ApJ, 483, 565
- Perlmutter et al. (1999) Perlmutter, S., et al. 1999, ApJ, 517, 565
- Phillips (1993) Phillips, M. M. 1993, ApJ, 413, L105
- Phillips et al. (1999) Phillips, M. M., et al. 1999, AJ, 118, 1766
- Pignata et al. (2004) Pignata, G., et al. 2004, MNRAS, 355, 178
- Pignata et al. (2008) Pignata, G., et al. 2008, MNRAS, 388, 971
- Poole et al. (2008) Poole, T. S., et al. 2008, MNRAS, 383, 627
- Roming et al. (2005) Roming, P. W., et al. 2005, Space Science Reviews, 120, 95
- Richmond et al. (1995) Richmond, M. W., et al. 1995, AJ, 109, 2121
- Riess et al. (1995) Riess, A. G., Press, W. H., & Kirshner, R. P. 1995, ApJ, 438, L17
- Riess et al. (1998) Riess, A. G., et al. 1998, AJ, 116, 1009
- Riess et al. (1999) Riess, A. G., et al. 1999, AJ, 118, 2675
- Riess et al. (2004) Riess, A. G., et al. 2004, ApJ, 607, 665
- Riess et al. (2007) Riess, A. G., et al. 2007, ApJ, 659, 98
- Salvo et al. (2001) Salvo, M. E., et al. 2001, MNRAS, 321, 254
- Schlegel et al. (1998) Schlegel, D. J., Finkbeiner, D. P., & Davis, M. 1998, ApJ, 500, 525
- Schmidt et al. (1994) Schmidt, B. P., et al. 1994, ApJ, 434, L19
- Simon et al. (2007) Simon, J. D., et al. 2007, ApJ, 671, L25
- Simon et al. (2009) Simon, J. D., et al. 2009, ApJ, 702, 1157
- Sollerman et al. (2004) Sollerman, J., et al. 2004, A&A, 428, 555
- Stetson (1987) Stetson, P. B. 1987, PASP, 99,191
- Strovink (2007) Strovink M. 2007, ApJ, 671, 1084
- Tanaka et al. (2006) Tanaka, M., Mazzali, P. A., Maeda, K., & Nomoto, K. 2006. ApJ, 645, 470
- Tully (1988) Tully, R. B. 1988, Nearby Galaxy Catalog, Cambridge University Press
- Tripp (1998) Tripp, R. 1998, A&A, 331, 815
- Wang et al. (2003) Wang, L., et al. 2003, ApJ, 590, 944
- Wang et al. (2005) Wang, X., et al. 2005, ApJ, 620, L87
- Wang et al. (2008a) Wang, X., et al. 2008a, ApJ, 675, 626
- Wang et al. (2008b) Wang, X., et al. 2008b, ApJ, 677, 1060
- Wang et al. (2009a) Wang, X., et al. 2009a, ApJ, 699, L139 (W09)
- Wang et al. (2009b) Wang, X., et al. 2009b, ApJ, 697, 380
- Wood-Vasey et al. (2007) Wood-Vasey, W. M., et al. 2007, ApJ, 666, 694
- Yamanaka et al. (2009) Yamanaka, M., et al. 2009, PASJ, in press (arXiv:0904.2763)