Star formation in the Cometary Globule Ori I-2
Abstract
We investigate the young stellar population in and near the cometary globule Ori I-2. The analysis is based on deep Nordic Optical Telescope -band and H images, JCMT SCUBA 450 and 850 µm images combined with near-infrared 2MASS photometry and mid-infrared archival Spitzer images obtained with the IRAC (3.6, 4.5, 5.8 and 8 µm), and MIPS (24 and 70 µm) instruments. We identify a total of 125 sources within the 5′5′ region imaged by IRAC. Of these sources 87 are detected in the -band image and 51 are detected in the 2MASS survey. The detailed physical properties of the sources are explored using a combination of near/mid-infrared color-color diagrams, greybody fitting of SEDs and an online SED fitting tool that uses a library of 2D radiation transfer based accretion models of young stellar objects with disks. Ori I-2 shows clear evidence of triggered star formation with four young low luminosity pre-main sequence stars embedded in the globule. At least two, possibly as many as four, additional low-mass PMS objects, were discovered in the field which are probably part of the young Orionis cluster. Among the PMS stars which have formed in the globule, MIR-54 is a young, deeply embedded Class 0/I object, MIR-51 and 52 are young Class II sources, while MIR-89 is a more evolved, heavily extincted Class II object with its apparent colors mimicking a Class 0/I object. The Class 0/I object MIR-54 coincides with a previously known IRAS source and is a strong sub-millimeter source. It is most likely the source for the molecular outflow and the large parsec scale Herbig-Haro flow. However the nearby Class II source, MIR-52, which is strong a H emission line star, also appears to drive an outflow approximately aligned with the outflow from MIR-54, and because of the proximity of the two outflows, either star could contribute. MIR-89 appears to excite a low excitation HH object, HH 992, discovered for the first time in this study.
1 Introduction
Cometary globules are believed to be molecular cloud condensations, which are so dense that they are not disrupted when an H II region expands into the molecular cloud(s) surrounding it. Such globules are always bright rimmed and often have a cometary or tear shaped form, because the stellar wind and ionizing radiation from the central O stars ablate away the low density gas on the side facing the O stars and sweep away dust towards the tail. Cometary globules are thought to form from “elephant trunks” (Herbig, 1974; Reipurth & Bouchet, 1984), although for compact cores surrounded by low density gas this phase can be quite short. The Rosette nebula is a good example of an H II region, which shows an abundance of both cometary globules and elephant trunk structures (Herbig, 1974). Although elephant trunks and cometary globules have been known for a long time, the fact that these sites may be forming stars was realized only in the last few decades. The first clear confirmation that stars form in cometary globules was a result of the identification of Bernes 135 in the cometary globule CG 1, one of the large cometary globules in the Gum Nebula, as a pre-main-sequence (PMS) star (Reipurth, 1983). The discovery of molecular outflows associated with cold IRAS sources without optical counterparts in three bright-rimmed globules (Sugitani et al., 1989), definitely confirmed that stars form in elephant trunks and cometary globules. Probably the most well-known example of star forming in the tip of elephant trunks is seen in the Hubble poster, “the pillars of creation”, in the Eagle nebula (M 16) (Hester et al., 1996).
In this paper we examine star formation in a more nearby cometary globule, Ori I-2, located in the large H II region IC 434. This is one of the three globules, in which Sugitani et al. (1989) discovered a molecular outflow. By using Spitzer IRAC and MIPS images, 2MASS data, deep R and H images from the Nordic Optical Telescope (NOT), and SCUBA sub-millimeter imaging we can identify all young stars in and near the globule and provide more accurate information on their physical characteristics.
2 Overview of previous work on Ori I-2
Bok, Cordwell & Cromwell (1971) were the first to notice this globule in the large H II region IC 434 and named it Ori I-2. The H II region IC 434 is illuminated by the Trapezium like system Ori with at least five early type stars (Caballero, 2008). The two hottest members, A and B (O9.5V and B0.5V) form a binary system, which allows for an accurate distance determination. Caballero (2008) derived a distance of 334 pc assuming that they form a binary, although he also considered the possibility that it is a hierarchical triple system, in which case the distance would be 385 pc. Walter et al. (2008), in their review of distance estimates to the Orionis cluster, quote a slightly larger distance, 420 30 pc. The morphology of Ori I-2, with the bright rim facing Ori and the tail aligned in the direction of the star suggests that the globule is at the same distance or slightly in front of Ori. In this paper we adopt the distance to Ori I-2 as 380 pc, favoring the distance estimate by Caballero.
Martin & Barrett (1978) included Ori I-2 in their molecular line survey of small Bok globules and found it to be the densest, the most compact, and the warmest, 18 K, of all the globules in their sample. Sugitani et al. (1989) discovered a bipolar molecular outflow in the globule. They found that the outflow had a linear extent of 0.34 pc, a dynamical age of 5 104 yr, and was centered on a low luminosity (L = 11 L⊙) cold IRAS source, IRAS , without any optical counterpart. Cernicharo et al. (1992) did a more detailed study of Ori I-2 in CO, 13CO and C18O J = , HCN J = , CS J = and CS J = with higher spatial resolution and sensitivity than Martin & Barrett (1978) and Sugitani et al. (1989). They confirmed that the molecular outflow is bipolar and centered on the IRAS source, IRAS , but found it to be more compact (0.22 pc) than what Sugitani et al. (1989) estimated from their low-spatial resolution observations. By examining the Palomar sky survey prints and doing CCD imaging in R, I, and narrowband H and [S II], they showed that the bright rim is a diffuse H II region and not a reflection nebula. They identified a faint star, star A, as a possible counterpart to the IRAS source. They found that the gas temperature of the shock heated gas in the bright rim is 25 K, while the gas temperature in the opaque (AV 20m) core of the globule is 12 K, similar to that of normal isolated globules. They determined the total mass of the globule to be 8 M⊙, with the opaque core having a mass of 2.3 M⊙ (corrected to a distance of 380 pc). Ori I-2 was included in the catalogue of remnant molecular clouds in the Ori OB 1 association by Ogura & Sugitani (1998) as cloud number 40A. They also identified three fainter cometary globules “behind” the tail of Ori I-2 (40 A), which they called 40 B, C, and D. Mader et al. (1999), who did a photographic and CCD imaging survey of the L 1630 and L 1641 molecular cloud regions in Orion, identified a chain of HH objects, HH 289, to the east of Ori I-2 and a tube like feature (cavity) protruding out on the western side of the globule, both apparently excited by the embedded IRAS source. Their observations show that the IRAS source drives a giant outflow with a projected size of pc to the east. A good overview of Ori I-2 and other globules in the vicinity of Orionis can be found in Alcalá et al. (2008).
3 Observations
3.1 Spitzer IRAC & MIPS observations
We have extracted IRAC and MIPS (24 & 70 µm) observations from the Spitzer Space Observatory archive (Program ID 30050: Star Formation in Bright Rimmed Clouds by Fazio et al.). The IRAC data were taken in the High Dynamic Readout (HDR) mode using a single AOR (Astronomical Observation Request) with a five-point dither pattern. We have processed both the short (0.6 sec) and the long (12 sec) integration Basic Calibrated Data (BCD) frames in each channel using the Artifact mitigation software developed by Sean Carey and created mosaics using MOPEX. These IRAC observations go far deeper than any previous observations of Ori I-2. In the short wavelength bands we can detect point-sources down to 30 – 40 Jy and are slightly less sensitive in the long wavelength bands, but in regions without nebulosity we can still detect point-sources down to 60 Jy.
We have also created mosaics of the MIPS 24 and 70 µm BCDs using MOPEX. Both data sets are of excellent quality. The 70 m-image, due to the lower angular resolution, shows only one bright point-like source embedded in the globule. The image also shows strong emission from the hot ionized rim facing Ori and fainter emission on the western side of the globule.
We have carried out multiframe PSF photometry using the SSC-developed tool APEX on all the Spitzer IRAC images and on the MIPS images. The 3.6 and 4.5 µm IRAC images show signs of saturation on bright stars. We have used combination of automated routines and eye-inspection to detect sources and extract photometry of these sources from the IRAC and MIPS images. For sources, which APEX failed to detect at one or several wavelengths, we have used the user list option in APEX to supply the coordinates for the source to extract it and perform photometry on it. This enabled us to derive photometry for every source, which we could visually identify on any image.
In the IRAC images we have detected 118, 122, 41 and 32 sources respectively at 3.6, 4.5, 5.8 and 8.0 µm. Since the field of view of the two IRAC cameras do not completely overlap, we end up with a total of 125 mid-infrared sources. We detect five of them in the 24 µm MIPS image, but only one in the 70 µm image. We have crosscorrelated the sources detected in the IRAC and MIPS bands, and the 2MASS point source catalogue. We have used the following association radii : 1′′ for the IRAC images, 25 for the MIPS 24 µm image and 2′′ for 2MASS data. Table 1 gives the coordinates of the 125 sources identified in Ori I-2 together with their -band and 2MASS magnitudes, Spitzer IRAC and MIPS flux densities and a preliminary classification based on selected color-color plots. In Table 1 we have given them the prefix Ori I-2, but throughout the paper we simply refer to them as MIR-nn, where nn is the number of the source. Out of the 125 sources 51 were found to have 2MASS counterparts. All the sources detected in the MIPS 24 µm image were also detected in the four IRAC bands. We find that around 50% of the sources in the list have been detected only at 3.6 and 4.5 µm and have no counterparts in 2MASS as well, although many of them are seen in the deep -band image.
3.2 Optical CCD imaging
The optical CCD images presented here were obtained on October 26 2007 using the 2.56 m Nordic Optical Telescope (NOT) located at El Observatorio del Roque de Los Muchachos on the island of La Palma in the Canary Islands. We used the Andalucia Faint Object Spectrometer and Camera (ALFOSC), which uses a thinned Loral 2048 2048 CCD array with 15 m pixels giving a field of view of 6.5 6.5 arcmin2 with 0.187 arcseconds pixel-1. For these observations we obtained two images with 300 seconds exposure time in Bessel R (6500 Å) separated by offsets of 90′′,+90′′ from the center of the globule in right ascension and declination, and a short 30 second exposure centered on the globule. We also observed the globule in narrow-band H. The narrow band H filter was a circular filter giving a more restricted field of view and centered on 6564 Å with a bandwidth of 33 Å. Here we obtained two images, each with 300 second exposure and separated by 60′′ in right ascension. The observing conditions were excellent with an average seeing of 075.
The images were reduced with the STARLINK program suite CCDPACK. The transformation to the World Coordinate System (WCS) was done using the STARLINK program Gaia and we used more than twenty 2MASS stars as astrometric reference stars. The 2MASS stars have very good astrometric accuracy and the fit to these reference stars indicate that the astrometry of the CCD images have an accuracy of 01 for both the R and the narrow-band H image compared to the 2MASS reference frame.
The images of the photometric standard stars were unavailable, hence the -band image was calibrated using the 30 second exposure and seven stars in the 14 - 15m range from the USNO-A2.0 catalogue. We estimate the photometric calibration accuracy to be 0.1 - 0.2m. This calibration was transferred to the H image using a somewhat larger set of overlapping stars with approximately neutral colors judged from 2MASS J magnitudes. The H image is estimated to have a photometric accuracy no better than 0.3m. The R band image has a limiting magnitude of 23.5m and stars brighter than 15m are partially saturated. We did aperture photometry in R and H of all stars, which coincided with an IRAC source to within 1′′. We present only the result of the R band photometry in Table 1. The H is virtually identical, except for one star, see below. We detect all 2MASS sources in R band as well as 26 IRAC sources without 2MASS detection.
Comparison of the R and H photometry revealed only one H emission line star. MIR-52 has an H magnitude of 18.5, while it is 19.9 in R (Table 1). The excess seen in H, 1.4m, is much larger than our photometric uncertainty. Therefore the star is definitely an H emission line star. MIR-52 has a strong IR excess in the MIPS 24 µm band, so that we identify it as a Class II object based on IRAC and MIPS color color diagrams, see Section 4.1.
3.3 SCUBA observations
The 850 m and 450 m continuum observations were obtained with bolometer array SCUBA on JCMT111The JCMT is operated by the Joint Astronomy Centre, on behalf of the UK Particle Physics and Astronomy Research Council, the Netherlands Organization for Scientific Research, and the Canadian National Research Council., Mauna Kea, Hawaii. SCUBA (Holland et al., 1999) has 37 bolometers in the long and 91 in the short wavelength array separated by approximately two beam widths in a hexagonal pattern. The field of view of both arrays is 2.3′. Both arrays can be used simultaneously by means of a dichroic beamsplitter.
The SCUBA observations reported in this paper were all obtained in jiggle-map mode (Holland et al., 1999). On October 17, 1997 we obtained two separate five integration maps with a chop throw of 100′′ in azimuth; which unfortunately was not sufficient to completely chop outside of the globule. On December 17, 1997 we therefore used a 120′′ chop with a fixed position angle of 80° measured from North (equatorial reference frame). This time we obtained three maps, each with small position offsets (dither) with three, eight, and five integrations. The total integration time from both nights was therefore 3328 seconds. The sky conditions were good on both nights. On October 17 the atmospheric opacity measured with the Caltech Submillimeter Observatory (CSO) taumeter, CSO was 0.07, and on December 17 was 0.04 - 0.05. The dust emission from the globule is too extended to be observed in jiggle map mode and the emission from the cold cloud core is therefore likely to be underestimated, especially at 450 m. Any strong emission in the off source positions was carefully blanked out in the data reduction stage. It should not affect the morphology or photometry of the strong, compact source, which dominates the emission both at 850 and 450 m. Pointing corrections were derived from observations of the blazar 0528+134 on October 17, and the blazar 0529+075 on December 17. The secondary calibrators CRL 618 and HL Tau were used for flux density calibration. We estimate the calibration accuracy to be 10% at 850 µm and 20% at 450 µm. The Half Power Beam Width (HPBW) was estimated from observations of Uranus obtained in the early part of each night and was found to be 145 – 15′′ at 850 m and 8′′ – 85 at 450 m.
The data were reduced in a standard way using SURF (Jenness & Lightfoot, 1999; Sandell, Jessop & Jenness, 2001) and STARLINK imaging software, i.e., flat fielded, extinction corrected, sky subtracted, despiked, and calibrated the images in Jy beam-1. Each data set was corrected for any drift in pointing between successive pointing observations and the data were added together to determine the most likely submillimeter position at 850 µm. Once we had derived a basic 850 µm astrometric image, we made Gaussian fits of the compact sub-millimeter source in each data set and derived small additional RA and Dec corrections to each scan (shift and add) to sharpen the final image to this position. Since there is a small mis-alignment between the 850 and 450 µm arrays, we first corrected the 450 µm images for any pointing drifts and then did shift and add using the position derived at 850 µm. We estimate the astrometric accuracy to be 2′′. The final coadd was done by noise-weighting the data in order to minimize the noise in the final images. The rms of the 450 µm image is 0.50 mJy beam-1 and 10 mJy beam-1 for the 850 µm image. All the maps were converted to FITS-files and exported to MIRIAD (Sault, Teuben & Wright, 1995) for further analysis. In order to correct for the error lobe contribution, especially at 450 µm, we have deconvolved all the maps using CLEAN with the same beam model used by Hogerheijde & Sandell (2000). Since the HPBW varies slightly from night to night, this model beam is not ideal, but it is the best we can do. The actual beam size is probably somewhat more extended.
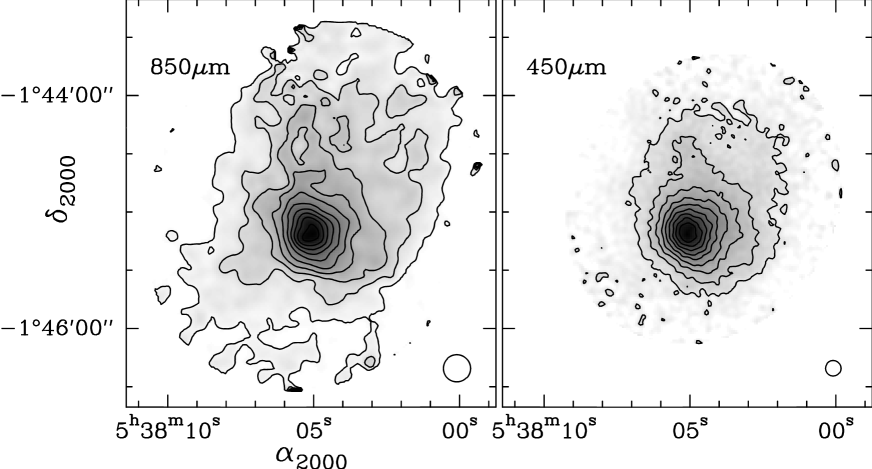
Figure 1 shows the 450 and 850 µm SCUBA images of Ori I-2. These images show a single bright source, located at the head of the globule beyond the optically bright rim. This source, SMM 1, is coincident with MIR-54, which is the only source seen in the MIPS 70 µm image. In order to derive the position and size of SMM 1 we have fitted a two component elliptical Gaussian using the task IMFIT in MIRIAD, one for the sub-mm source, and the other for the surrounding cloud. The fit to the broader component is mainly to provide a good subtraction of the extended emission, and is not to estimate the flux density of the surrounding cloud. The sub-millimeter position is (2000.0) = 05h 38m 05098, (2000.0) = 01° 45′ 114. The integrated flux densities are 0.54 0.08 Jy and 3.36 0.75 Jy for 850 and 450 µm, respectively. The fitted size, 179 154, should be considered an upper limit, since the true beam sizes were probably somewhat larger than the model beams used for deconvolving the images.
4 The young stellar population in the Ori I-2 field
Since Ori I-2 lies within the Orionis cluster (age 3 Myr), we expect to detect some young stars belonging to the cluster in the 5′ 5′ field that we are analyzing. Stars belonging to the Orionis cluster should be preferentially located outside the globule and generally appear older than stars that have recently formed in the globule.
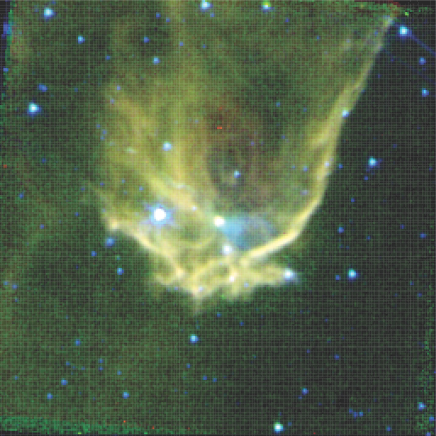
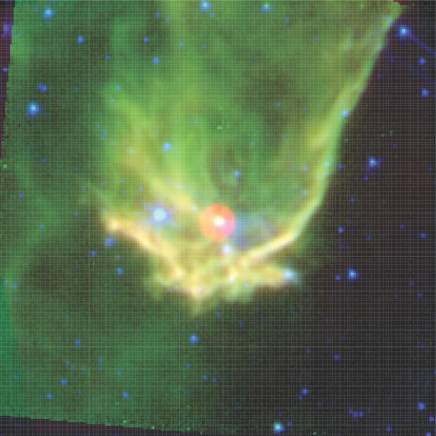
Figure 2 present three-color images of Ori I-2 using IRAC 3.6, 4.5 and 8 µm in the left panel and the IRAC 3.6 and 8 µm bands combined with the MIPS 24 µm channel in the right panel. Both images show that the front side of the globule, which is dominated by strong polyaromatic hydrocarbon emission (PAH-emission) is far from smooth. This may in part be due to Rayleigh-Taylor instabilities at the ionization front, but it is also due to outflows from the young stars which have recently formed in the cloud. The outflow from MIR-54 (IRAS 05355-0146), the bright red star in the IRAC/MIPS color image, is clearly seen as a cavity like structure to the east of the star and a bluish nebulosity on the western side of the star. This outflow is very prominent in the H image (Figure 3), where it shows up as a limb brightened cavity, extending 50′′ from the western edge of the globule and 1.5′ from the star exciting it. Another outflow just south of the H outflow and approximately aligned with it, can be seen in the IRAC images terminating at a blue star (unrelated to the outflow). This outflow is powered by another young star, MIR-52, 20′′ to the south of MIR-54. To the east both outflows overlap. The western side of the globule is very sharp with an ionized rim. To the east the the boundary between the globule on the surrounding H II region is more diffuse. The most opaque part of the globule is just north or northwest of the IRAS source. The bright star located 43′′ away from MIR-54 in the color image is SAO 132389 (HD 37389). This star, identified as MIR-73 in Table 1, is detected even at 24 µm, although it is an unreddened foreground A0 star with an . The star has a radial velocity of km s-1, which is very different from the radial velocity (12 km s-1) of Ori I-2 (Cernicharo et al., 1992). Most of the faint stars outside the globule are field stars, although a few are young stars belonging to the -Orionis cluster.
4.1 YSO classification based on Near- and Mid-infrared colors
The IRAC and MIPS data are ideal for detecting young stellar objects; especially in obscured regions like in Ori I-2, which has a visual extinction exceeding 20m. Outside the globule, where the extinction is low, search for brown dwarfs, for which the Spectral Energy Distribution (SED) peaks at J, can be most efficiently performed using near-infrared data. However, we go deeper than 2MASS in the 3.6 and 4.5 µm IRAC bands. The same is true even for the NOT broadband R filter. There is therefore no particular advantage in using the 2MASS data alone. All 2MASS sources in our field have also been detected by IRAC, at least in the two short wavelength bands. Furthermore, at the distance of the Orionis cluster only the brightest M dwarfs are barely detectable with 2MASS.
Since we can see several galaxies in the deep R band image, we first analyzed the IRAC data to eliminate any galaxies, which could have MIR colors similar to a YSO. Stern et al. (2005) demonstrated that (a) normal star-forming galaxies and narrow-line AGNs with increasing 5.8 and 8.0 µm and (b) broad-line AGNs with red, nonstellar SEDs, result in colors which are very similar to bona-fide YSOs. It is therefore necessary to inspect deep IRAC images for contamination due to the extragalactic sources. Gutermuth et al. (2008) have extensively discussed the criteria for identifying such extragalactic objects in the IRAC color-color diagrams. If we use the criteria given in the appendix of their paper, we identify MIR-16, 25, 88, 89, 93, and 114 as extragalactic. However, inspection of these sources in the R-band CCD image, which was taken in excellent seeing conditions, suggests that most of them are stellar, with the exception of MIR-93. This source is clearly extended, and therefore it is an extragalactic source. For MIR-88, which is close to the detection limit in the R-band, we get no help from the R band image, it could be stellar, or it could be extragalactic. MIR-89, which is not detected in the R band, was also identified as an extragalactic object. However, not only IRAC, but also the MIPS colors suggest that MIR-89 is a Class 0/I object. This classification is also supported by its location in the eastern side of the bright rim. We therefore only positively identify MIR-93 as an extragalactic object.
Figure 4 presents color-color diagrams of 2MASS, IRAC and MIPS 24 µm sources detected in the Ori I-2 field. We have used several criteria (shown as dashed lines and boxes in Figure 4) to identify potential PMS stars using these color-color diagrams.
The most stringent classification scheme uses the IRAC ([3.6]–[5.8]) colors and the [8]–[24] IRAC and MIPS color. At 24 µm the reddening due to extinction is small and the photospheric colors are very close to zero for all spectral types (Muzerolle et al., 2004). Therefore the [8]–[24] color is very sensitive to infrared excess, but of course not all young stars bright are enough to be detected at 24 µm. Using this color-color diagram we find four sources with infrared excess (Figure 4 (left)). We identify MIR-54 and MIR-89 as Class 0/I sources, while MIR-41 and MIR-52 are in the Class II regime.
Figure 4 (middle) presents the [3.6]–[4.5] vs [5.8]-[8.0] color-color plot for the sources detected in all the IRAC bands. Sources with the colors of stellar photospheres are centered at ([3.6]–[4.5],[5.8]–[8.0])=(0,0) and include foreground and background stars as well as diskless (Class III) pre-main sequence stars. The box outlined in Figure 4 (middle), defines the location of Class II objects (Megeath et al., 2004; Allen et al., 2004), i.e. sources whose colors can be explained by young, low-mass stars surrounded by disks. Hartmann et al. (2005) have shown from their observations of young stars in the Taurus-Auriga complex that Class 0/I protostars require [3.6]–[4.5] and [5.8]–[8.0]. While MIR-89 clearly falls in the Class 0/I region, MIR-54 does not. It is well above the horizontal line corresponding to [3.6]–[4.5]=0.7, but the color [5.8]–[8.0] is slightly less than 0.7. Since the demarcating lines primarily serve as a guidance and MIR-54 is securely identified as a Class 0/I object based on the IRAC/MIPS color-color plot, we identify it as a Class 0/I object here as well. In this color-color diagram five stars end up in the Class II color regime: MIR-23 (marginally), MIR-25, MIR-41, MIR-51, and MIR-88. MIR-51, which shows a large excess in the [5.8]–[8.0] color is a Class II/I source, i.e. a flat spectrum source. We did not pick up MIR-52, because the [3.6]–[4.5] color is only 0.12, yet it is the only strong H emission line star in our sample (see Section 3.2) and definitely a PMS star. It has, however, a strong infrared excess longward of 8 µm, which is why it was picked up in the [3.6]–[5.8] vs. [8]–[24] color-color diagram.
Hartmann et al. (2005) also investigated color-color diagrams using the shortest IRAC bands, which have the highest sensitivity and which are least affected by PAH emission with near-IR colors taken from the 2MASS catalogue. We have similarly used the photometry for the sources presented in Table 1 which have 2MASS counterparts to plot the –[3.6] versus [3.6]–[4.5] color-color diagram (Figure 4 right). We identify 12 potential PMS stars, i.e. stars which are located outside the box demarcating stellar sources. These sources are MIR-10, 29, 41, 47, 49, 51, 52, 61, 63, 78, 93, and 117. If we account for the large errors in faint 2MASS sources we find at least one more source, MIR-17, which appears to have a clear excess in the 5.8 µm filter. For both MIR-10 and 78 the 2MASS fluxes have large uncertainties. It is therefore desirable to have additional evidence of IR excess in order to justify their classification as PMS objects. While MIR-10 shows a clear excess at 5.8 µm, MIR-78 is not detected beyond 4.5 µm and it’s SED is completely stellar with no sign of an IR excess. Thus we do not consider MIR-78 to be a PMS object. Since MIR-93 was found to be an extragalactic source, we are left with 10 potential PMS stars. Of these we have already identified MIR-41, 49, 51 and 52 as PMS stars based on MIR color-color plots. The two Class 0/I sources, MIR-54 and 89, and MIR-88, a potential Class II source, were not detected in , and hence do not appear in this color-color diagram. Neither do the sources MIR-23, and 25, both of which were classified as PMS objects in the IRAC color-color diagram, show –[3.6] or [3.6]–[4.5] colors expected for Class II objects. The –[3.6] color is 0.3 for MIR-23, which would put it in the class II regime, while it is 0 for MIR-25. The latter, however, does have a significant color excess at 8 µm.
Not all of the stars identified in the 2MASS/IRAC color color diagram are likely to be PMS stars, they could just be heavily reddened background stars. MIR-29, 47, and 61 are all located in the western or southern rim of the globule, and have very blue IRAC colors. They are all almost certainly heavily reddened background stars. The same is true for MIR-63 which is seen toward the opaque part of the globule. We identify MIR-63 with the star that Cernicharo et al. (1992) labeled B, and proposed might be a stellar counterpart to the IRAS source. However, the [3.6] – [4.5] color for MIR-63 is extremely blue, 2.4m, which shows that the red near-IR colors are simply due to extinction. The same is true for MIR-117, which is located east of the globule in a relatively low extinction area. For this star the –[3.6] color excess is rather marginal and there is no excess in the IRAC bands. It appears to be a reddened background star. MIR-10 lies outside the globule in a region of low extinction and is very red in the [4.5] – [5.8] color band, and could therefore be a PMS star, although it was not detected at 8 µm.
In all we therefore identify 11 potential PMS objects based on 2MASS, IRAC and MIPS colors. We classify MIR-54 and 89 as Class 0/I stars , while MIR-10, 17, 23, 25, 41, 49, 51, 52, and 88 are Class II objects. We also note that MIR-104, which lies just outside the southern rim of the globule, was only detected at 5.8 and 8 µm, suggesting that it has an infrared excess. It is therefore a potential PMS object. Among these PMS objects MIR-10, 17, and 41 are located well south of the globule, while MIR-25 is west of the cometary globule. If all of these four sources are PMS stars, they most likely belong to the young -Orionis cluster and are unrelated to Ori I-2. All the rest could potentially have formed in the globule.
In Section 5.1 we investigate the SEDs of these candidate PMS objects in more detail to see whether they are young stars, and if so, what their physical properties are.
4.2 The large Herbig-Haro outflow, HH 289, and a new HH object, HH 992
Mader et al. (1999) identified a parsec scale Herbig-Haro outflow, HH 289, to the east of the globule by analyzing images from the AAT/UKST H survey, broadband R (IVN) plates and narrowband CCD images in H + [S II]. Their HH objects 2 – 5, i.e. knots C – F, are all outside the area we imaged in R and H. We do detect their knot B in our H image, but not knot A. Knot B appears very elongated and is located in the cavity wall from the red-shifted outflow from MIR-54. Mader et al.’s feature 1, which coincides with the outflow cavity emerging to the SW out of the globule is also readily visible in the H image (Figure 3). Although we see no trace of knot A in either R or H, it seems to coincide with the bluish nebulosity west of MIR-54, which is very prominent in the IRAC three color image (Figure 2). In the 3.6 and 4.5 µm images the MIR-54 nebulosity appears to be the inner part of an outflow cavity which is not visible in the mid-IR outside the bright western rim of the globule. However, this outflow lobe is seen more prominently as a limb-brightened H cavity extending out another 50′′ from the western edge of the globule. The total length of the outflow is therefore 1.5′, 0.17 pc. Since this outflow extends into “empty” space, i.e. the low density H II region IC 434, it is possible that the outflow extends even further, but becomes so diffuse that it is no longer visible. It is probably the counterpart to the large Herbig-Haro flow, but since the density of the globule is much lower on the eastern side of the globule, it has been able to expand more freely. However, in the IRAC images one can also see an outflow cavity from MIR-52 protruding out of the globule. This outflow is approximately parallel with the MIR-54 outflow. It is brighter on the southern side of the cavity and has an apparent length of 50′′ from MIR-52. To the east the two outflows appear as a large evacuated hole (cylinder) and cannot be separated. Either star could therefore drive the large HH outflow.
However, we also detect a Herbig-Haro like nebulosity with three knots or condensations in the R-band image 140′′ east of MIR-54. A blow-up of this nebulosity is shown in Figure 3, although it is not seen at all in the H image. Normally HH objects are bright in H. If this is an HH object, the emission must completely be dominated by [SII] emission, i.e. it has to be an extreme low excitation HH object. It is not detected by 2MASS, nor is it seen in the IRAC images, which go deeper than 2MASS. It is, however, seen faintly in Mader et al.’s H + [SII] image, which proves that it is real and not just an instrumental artifact. In fact it appears quite strong in Mader et al.’s 2.12 µm molecular hydrogen image, while the nebulosity is completely absent on their IVN plate. This confirms that there is no continuum at the position of the nebulosity. The only conclusion we can draw, is that this is a rather low excitation HH object, which is completely dominated by line emission from [SII] and which is also seen in vibrationally excited H2 at 2.12 µm. The coordinates of the three HH knots, which are here labeled HH 992, are given in Table 2. This HH object is not a part of the large Herbig-Haro flow, HH 289, seen by Mader et al. (1999). The most likely exciting source of the HH 992 complex is MIR-89, which is 75′′ west of the HH objects. MIR-89 was identified as a Class 0/I object in the color-color diagrams, but SED modeling (Section 5.1) suggest that it is a Class II object. In the 3.6 and 4.5 µm images one can see a limb-brightened fan-shaped nebulosity emerging to the west from the star. This nebulosity may trace an outflow into the globule, which is roughly aligned (p.a. -95°) with the HH objects on the opposite side of the star.
5 Discussion of young objects in Ori I-2
5.1 Detailed SED modeling of the PMS objects
In order to interpret the observed SEDs for the sources identified to be PMS and better characterize these sources we have explored the archive of two-dimensional (2D) axisymmetric radiative transfer models of protostars calculated for a large range of protostellar masses, accretion rates, disk masses and disk orientations created by Robitaille et al. (2007). This archive also provides a linear regression tool which can select all model SEDs that fit the observed SED better than a specified . Each SED is characterized by a set of model parameters, such as stellar mass, temperature, and age, envelope accretion rate, disk mass, and envelope inner radius. We have used this online tool to generate models, which fit the observed SEDs for the 11 candidate PMS objects. SEDs of six of the objects could be adequately fit with accretion disk models, the other five were better fit with stellar atmospheric models, reddened by foreground extinction. We restricted the SED fitting tool to explore only distances between 350 and 450 pc. Below we present and briefly discuss the best fit models.
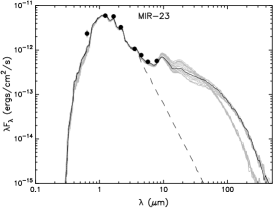
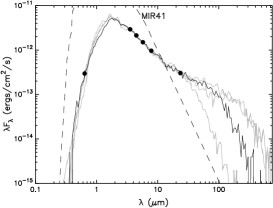
Figure 5 shows results of detailed modeling of the observed SED in the mid-infrared (and FIR and sub-mm for MIR-54) for all the candidate PMS objects. A major criticism against the use of these models has been the non-uniqueness of the solutions obtained from the model library. However we find that for four out of the six PMS objects, viz., MIR-51, 52, 54 and 89 the best fit models are either distinctively better in reproducing all the observed flux densities than the next few models or that the distances for other possible models do not match the distance to Ori I-2. For MIR-23 we find 14 models with – and for MIR-41 we find four models with –, which appear plausible. For MIR-23 we find two independent models for which the inclination is varied to generate the 14 models. For each of these two sources we have obtained the average values and variances of the fitted parameters by taking a weighted average of the apparently acceptable models in a manner similar to Simon et al. (2007). Table 3 presents the parameters corresponding to the best fit models for the six sources which we fitted with accretion disk models.
Robitaille et al. (2006) presented a classification scheme which is essentially analogous to the Class scheme, but refers to the actual evolutionary stage of the object based on its physical properties like disk mass and envelope accretion rate rather than the slope of its near/mid-IR SED. According to the Robitaille et al. classification scheme, MIR-54, is a stage 0/I object, while all the others are stage II objects. At a first glance it is surprising to find that MIR-89, which we classified as a young Class 0/I object both in the IRAC and IRAC-MIPS color-color diagrams, is now identified as an evolved stage II object. The SED model shows that it only has a minuscular envelope and there is no sign of envelope accretion. All reasonable SED models suggest that it is a heavily extincted ( 50m), very low-mass star. This is the sole reason why it appears as a Class 0/I object in the color-color diagrams, because the observed magnitudes are not corrected for extinction in these diagrams. The star still has a rather massive disk compared to the stellar mass, 0.02, and a moderately high disk accretion rate of 3.2 10-8 yr-1. It is located in the bright rim on the eastern edge of the cometary globule Ori I-2, and appears to drive an outflow seen as a fan-shaped nebulosity west of the star, and as the Herbig-Haro objects, HH 992, seen 65′′, 0.12 pc to the east of the star.
MIR-51, which we identified as a Class I/II object based on color-color diagrams, appears more similar to MIR-52 (Class II object) and if anything slightly older, not younger. Both appear to be young stage II objects (/ 10-7 yr-1 and / 10-4) and are embedded inside the globule. This is consistent with MIR-52 having strong H emission and powering an outflow.
The SED models place MIR-23 and 41 as late stage II objects. They have no measurable envelope and very low disk accretion rates (Table 3). The models also suggest no or low foreground extinction. These results of modeling together with the location of these two objects in the region suggest that these objects are therefore more evolved PMS stars belonging to the -Orionis cluster, although we cannot exclude that they could have formed in the globule at an earlier epoch.
We could not obtain any believable dust/envelope models for MIR-10, 17, 25, and 88, which are all outside the globule in regions of low or moderate extinction, or for MIR-49, which is located in the most opaque part of the globule. We therefore fitted these objects with pure stellar atmospheric models reddened by foreground extinction. These fits are not very accurate, since we have no optical data, other than the R magnitudes. Furthermore, MIR-10, 17 and 49 were not detected at 8 µm, while MIR-88 was not detected by 2MASS. We have however used upper limits from these bands to better constrain the fits. MIR-10: At wavelengths shortward of 4.5µm, the observed SED is fitted reasonably well by a stellar photosphere = 5250 K, logZ/H=-0.5, logg = 0.0 and = 1.45m. However, the star shows an excess at 5.8 µm, which suggests that it could be a transitional disk object. MIR-17: Similar to MIR-10 the 2MASS and short wavelength IRAC data for this star can be explained by reddening. Even though it also shows an IR excess at 5.8 µm, when compared with the SED due to stellar photosphere = 3500 K, logZ/H=-0.5, logg = 5.0 and 2m, the 8 µm upper limit suggests that there is no excess at 8 µm. We therefore dismiss MIR-17 as a PMS star. MIR-25: A stellar model with = 3500 K, log Z/H=-2.5, logg = 5.0, and = 0m gives a reasonable fit to the observed data. There might be a small excess at 8 µm, which could continue to longer wavelengths. Based on the available data, we therefore retain MIR-25 as a candidate PMS star, although the evidence for dust excess in this star is rather marginal. MIR-49: The SED of this source is well reproduced by a stellar photosphere with = 3500 K and = 16m. MIR-49 therefore appears to be a heavily reddened background star. MIR-88: The stellar model with = 3500 K, logZ/H=-0.5 , logg = 0.0 =6.1m reproduces the observed SED significantly better than the accretion disk models and there is no evidence for excess emission in the IRAC bands. It is therefore a reddened background star.
Most of the stars, which could not be fit with accretion disk models, appear to be reddened background stars, except perhaps for MIR-10 and 25, both of which could have some long wavelength excess. It is possible that they could be transitional disk objects belonging to the 3 Myr Orionis cluster. Transitional disk objects are stars, for which the inner disk has been cleared out, see e.g. (Forrest et al., 2004), and which therefore do not show any excess until 6 or 8 µm.
For MIR-54 the models completely fail to reproduce the observed sub-millimeter flux densities, irrespective of the values of any of the input parameters. We discuss MIR-54 in more detail in Section 5.2.
Based on our SED modeling we conclusively identify six PMS stars. All the PMS stars in the Ori I-2 region appear to be low luminosity stars of spectral types K and M. The PMS stars outside the globule have very low disk masses and disk accretion rates, 10-10 to a few times 10-11 yr-1 (Table 3). This is not surprising since these stars are most likely members of the -Orionis cluster, which has an age of 3 Myr (Caballero, 2008).
5.2 MIR-54, a low-mass Class 0/I object
MIR-54 is the mid-infrared counterpart to IRAS 05355-0146, which was detected in all four IRAS bands. MIR-54 is within 13′′ of the nominal IRAS position. It is the only source in Ori I-2 detected at 24 and 70 µm as well as in the sub-millimeter. The MIPS 70 µm flux density for MIR-54 is Jy. The IRAS flux densities are much higher than what we observe with MIPS. This is to be expected, since the large IRAS beam will include emission from the hot bright rim as well. The luminosity for the IRAS source, i.e. MIR-54, has therefore been severely over estimated in the past.
We can obtain a more precise estimate of the bolometric luminosity by doing a greybody fit to the MIPS and SCUBA data. This is illustrated in Figure 6 where we show a two-component greybody fit to the observed flux densities between 24 and 850 µm. Based on the observed size of the source in the mid-infrared and sub-mm, we have assumed to be 10′′ and 13′′ for the warm and the cold components, respectively. The dust temperatures (), dust emissivity indices () and masses calculated for the best fit model are presented in Figure 6. The total dust and mass gas, was derived from the fitted and using
| (1) |
where is the distance in kpc, Sν is the total flux (in Jy) at frequency and Mtot is given in .
Based on the greybody fitting we obtain dust temperatures of 23 K and 67 K and of 0.9 and 0.8 for the cold and the warm components. Between 24 µm and sub-mm wavelengths, the observed SED of the source is reasonably well fit using this simple two-temperature greybody model and it is consistent with the observed 1.3 mm flux density. However we could not derive a single radiative transfer based model, which reproduces the entire SED starting from 3.6 µm to the sub-mm wavebands (Figure 5). The model is particularly poor at the longer wavelengths. However, both the greybody model and the radiation transfer based models give a luminosity of 1.3–1.8 and mass of 0.19–0.24 . MIR-54 is therefore a deeply embedded (not detected in the near-IR) low-mass, very young object. It excites an H2O maser (Wouterloot & Walmsley, 1986; Codella et al., 1995). It is most likely the exciting source for the large parsec scale outflow, HH 289. Inside the globule this is seen as a low velocity molecular outflow (Cernicharo et al., 1992). The outflow is also visible in the IRAC images (Section 4.2). The SED modeling predicts / 2 10-5 yr-1, which satisfies the criterion (/ 10-6 yr-1) used by Robitaille et al. (2006) to identify Stage 0/I objects. Since MIR-54 powers such a large outflow, it is probably not a Class 0 (or stage 0) protostar, but rather a deeply embedded, somewhat more evolved Class I protostar.
6 Discussion and conclusions
We find clear evidence for triggered star formation in the cometary globule Ori I-2, with four young stars embedded in the front side of the globule. The PMS object furthest away from the bright rim and approximately at the center of the globule, MIR-54, is a young Class I or stage I protostar. It is most likely responsible for the large parsec scale Herbig-Haro outflow, with its counter flow seen as a bright H outflow breaking out on the western side of the globule. However, MIR-52, the heavily obscured H emission line star 20′′ south of MIR-54, also appears to drive an outflow, which is approximately aligned with the outflow from MIR-54. To the east both outflows overlap, and either star could therefore be the exciting star for the large HH outflow. MIR-89, which is located in the bright rim, is a more evolved Class II object, which most likely excites the HH object, HH 992, which we discovered in this study. HH 992 lies outside the globule, 65′′ east of the star and south of the large Herbig-Haro outflow, HH 289. HH 992 breaks up into three knots, and must be rather low excitation, since it is not seen in the H image.
Another candidate young star, MIR-104, which is close to the globule and near MIR-89 (Figure 3) may also have formed in the globule. However, MIR-104 was only detected at 5.8 and 8 µm and we therefore have insufficient information to determine whether it really is a PMS object. If it is, it could have formed inside the globule before the gas was ablated away by the strong UV radiation from Ori.
We identify two infrared excess stars, one of which is far to the south, 2′ from the globule and the other is seen in projection against the bright rim in the tail region of the globule. Both these sources have zero or very little foreground extinction and are probably unrelated to the globule, although we cannot exclude the possibility that they could have formed in the globule in an earlier epoch of star formation. We also find two other candidate PMS stars in the field, which may have weak mid-IR excesses. All these stars appear older, i.e. they are pre-transitional or transitional disk stars, which now are part of -Orionis cluster, which has an age of 3 Myr.
Models of cometary globules can successfully explain their morphology and suggest that they form stars through Radiation Driven Implosion (RDI) (Lefloch & Lazareff, 1994; Miao et al., 2006). This was already qualitatively discussed by Reipurth (1983), who showed that cometary globules are active sites of star formation. In these models cometary globules are denser cores in the molecular cloud surrounding an H II region, which get exposed to the UV radiation from the central OB association, when the H II region expands into it. The UV flux of the OB association ionizes the external layers of the core facing the OB association and an ionization front is formed at the front surface. The gas is heated during the ionization and the temperature increases. The increased pressure due to the hot ionized gas drives an isothermal shock into the cloud, which compresses the neutral gas in the core. At the same time, the ionized and heated gas at the surface of the core flows radially away from the surface and forms an evaporating layer surrounding the surface of the core. Due to the curvature of the front surface of the core the shock waves preceding the ionization front converge and collide at their focus, causing the interior of core to be compressed to much higher densities. This causes the central part of the core to become gravitationally unstable, triggering the formation of a star.
The observations of Ikeda et al. (2008) of the isolated cometary globule BRC 37 in the H II region IC 1396 appears to match this model rather well. Their observations show a string of PMS objects along the symmetry axis of the globule, with the oldest being in front of the globule, and the youngest object still embedded in the head of the globule, suggesting sequential formation of young stars as the ionization front proceeds towards the tail of the globule. For some of the other cometary globules in the same H II region, like IC 1396 N (BRC 38), this scenario is less clear. Getman et al. (2007) found an elongated clustering of X-ray sources aligned with the globule, with the youngest stars still embedded inside it, consistent with the RDI model for triggered star formation. However Beltran et al. (2009), who studied the same cometary globule using deep J, H, K′, and narrowband H2 2.12 µm imaging and previously published mm imaging did not find any color or age gradient in the south-north direction, i.e. in the direction of the globule. They therefore conclude that not all star formation in this globule can be explained in terms of triggering. We can think of two possible explanations for why IC 1396 N does not appear to show the same type of age progression and sequential triggering as seen in BRC 37. If the X-ray sources in front of the globule are late Class II objects, i.e. transitional disk like objects, or Class III objects, they will show no color excess in the near-IR and therefore appear as field stars. Secondly, IC 1396 N is not a well defined isolated cometary globule with a simple head/tail structure, suggesting that it could consist of more than one cometary globule.
Ori I-2, the cometary globule studied in this paper, does appear more similar to BRC 38. It shows clear evidence for triggered star formation, with the youngest object, MIR-54, being furthest away from the front side of the globule. The two other young Class II objects are definitely older and closer to the bright rim and the ionizing star, Orionis. All three stars are also close to the symmetry axis of the globule, as predicted by the RDI model. MIR-89 and possibly MIR-104, which both lie on the eastern side of the globule, do not appear to have formed by focussed compression along the symmetry axis of the globule. Other processes, like Rayleigh-Taylor instabilities in the bright rim, may also play a role and form low-mass stars like MIR-89. A similar situation is seen in the Horsehead, a bright rimmed elephant trunk structure east of Orionis, which also shows some evidence for sequential star formation triggered by the expanding H II region (Mookerjea et al., 2009). These young PMS stars are also low-mass stars, which appear to have formed in the bright rim by Rayleigh-Taylor instabilities, since hardly any of them lie close to the symmetry axis of the Horsehead.
Several, if not all of the young stars in Ori I-2 drive outflows. It is interesting to note that all of the outflows are roughly perpendicular to the symmetry axis of the globule. It maybe a coincidence, but other cometary globules with embedded protostars, like BRC 37, show a similar behavior. If this is generally true, it would provide additional support to the focussed RDI model, which predicts that the gas inside a cometary globule will be compressed in a ridge along the symmetry axis of the globule. When density condensations, i.e. cores in this ridge become gravitationally unstable and collapse, the collapse would preferentially be towards the symmetry axis, therefore aligning the protoplanetary disk along the symmetry axis. Since outflows are driven by disks, one would therefore see outflows which are perpendicular to the symmetry axis of the cometary globule.
Ori I-2 is thus a low mass star forming cometary globule. The star formation in this region appears to be triggered by a combination of RDI and Rayleigh-Taylor instabilities in the rim of the globule. In the deep R-band images for the first time we detect HH 992, which based on its non-detection in the H image is most likely an extremely low excitation HH object. Follow-up optical and infrared spectroscopic observations to understand the true nature of HH 992 as well as MIR-52, the sole H emission star in the field, are needed. We find that many of the young stars drive outflows which are aligned perpendicular to the symmetry axis of the globule. Higher spatial resolution imaging of the outflows in Ori I-2 in near-infrared and millimeter would provide structural details of the outflows and lead to correct identification of the sources exciting these outflows.
References
- Alcalá et al. (2008) Alcalá, J.M., Covino, E., & Leccia, S. 2008, in Handbook of Star Forming Regions, Vol. I, Ed. Bo Reipurth, Astron. Soc. Pac., p. 801
- Allen et al. (2004) Allen, L. E., et al. 2004, ApJS, 154, 36
- Bally et al. (2009) Bally, J., et al. 2009, ApJ, 300, 300
- Beltran et al. (2009) Beltran, M. T., Massi, F., Lopez, R., Girart, J. M., & Estalella, R. 2009, arXiv:0902.4543
- Bessell & Brett (1988) Bessell, M. S., & Brett, J. M. 1988, PASP, 100, 1134
- Bok, Cordwell & Cromwell (1971) Bok, B. J., Cordwell, C. S., & Cromwell, R. H. 1971, in Dark Nebulae, Globules and Protostars, Proceedings of a Symposium held in Tucson, March 26 – 27, 1970. Ed. B. T. Lynds (Tucson: University of Arizona Press) p. 33
- Bontemps (1996) Bontemps, S. 1996, Ph.D. Thesis,
- Caballero (2008) Caballero, J. A. 1998, MNRAS, 383,750
- Cernicharo et al. (1992) Cernicharo, J., Bachiller, R., Duvert, G., Gonzalez-Alfonso, E., & Gomez-Gonzalez, J. 1992, A&A, 261, 589
- Codella et al. (1995) Codella, C., Palumbo, G. G. C., Pareschi, G., Scappini, F., Caselli, P., & Attolini, M. R. 1995, MNRAS, 276, 57
- Cohen et al. (1981) Cohen, J. G., Persson, S. E., Elias, J. H., & Frogel, J. A. 1981, ApJ, 249, 481
- Gutermuth et al. (2008) Gutermuth, R. A., et al. 2008, ApJ, 674, 336
- Flaherty et al. (2007) Flaherty, K. M., Pipher, J. L., Megeath, S. T., Winston, E. M., Gutermuth, R. A., Muzerolle, J., Allen, L. E., & Fazio, G. G. 2007, ApJ, 663, 1069
- Forrest et al. (2004) Forrest, W. J., et al. 2004, ApJS, 154, 443
- Getman et al. (2007) Getman, K. V., Feigelson, E. D., Garmire, G., Broos, P., & Wang, J. 2007, ApJ, 654, 316
- Hartmann et al. (2005) Hartmann, L., Megeath, S. T., Allen, L., Luhman, K., Calvet, N., D’Alessio, P., Franco-Hernandez, R., & Fazio, G. 2005, ApJ, 629,881
- Herbig (1974) Herbig, G. H. 1974, PASP, 86, 604
- Hester et al. (1996) Hester, J. J., et al. 1996, AJ, 111, 2349
- Hodapp (1994) Hodapp, K.-W. 1994, ApJS, 94, 615
- Hogerheijde & Sandell (2000) Hogerheijde, M. R., & Sandell, G. 2000, ApJ, 534, 880
- Holland et al. (1999) Holland, W. S., et al. 1999, MNRAS, 303, 659
- Ikeda et al. (2008) Ikeda, H., et al. 2008, AJ, 135, 2323
- Indebetouw et al. (2005) Indebetouw, R., et al. 2005, ApJ, 619, 931
- Jenness & Lightfoot (1999) Jenness, T., & Lightfoot, J.F. 1999, Starlink User Note 216.6, Rutherford Appleton Laboratory, Particle Physics & Astronomy Research Council
- Lefloch & Lazareff (1994) Lefloch, B., & Lazareff, B. 1994, A&A, 289, 559
- Mader et al. (1999) Mader, S. L., Zealey, W. J., Parker, Q. A., & Masheder, M. R. W. 1999, MNRAS, 310, 331
- Martin & Barrett (1978) Martin, R. N., & Barrett, A. H. 1978, ApJS, 36, 1
- Megeath et al. (2004) Megeath, S. T., et al. 2004, ApJS, 154, 367
- Meyer et al. (1997) Meyer, M. R., Calvet, N., & Hillenbrand, L. A. 1997, AJ, 114, 288
- Miao et al. (2006) Miao, J., White, G. J., Nelson, R., Thompson, M., & Morgan, L. 2006, MNRAS, 369, 143
- Mookerjea et al. (2009) Mookerjea, B., Sandell, G., Jarrett, T. H., & McMullin, J. P. 2009, A&A, submitted
- Muzerolle et al. (2004) Muzerolle, J., et al. 2004, ApJS, 154, 379
- Ogura & Sugitani (1998) Ogura, K., & Sugitani, K. 1998, Pub.. Astron. Soc. Aust., 15, 91
- Reipurth & Bouchet (1984) Reipurth, B., & Bouchet, P. 1984, A&A, 137, L1
- Reipurth (1983) Reipurth, B. 1983, A&A, 117,183
- Robitaille et al. (2007) Robitaille, T. P., Whitney, B. A., Indebetouw, R., & Wood, K. 2007, ApJS, 169, 328
- Robitaille et al. (2006) Robitaille, T. P., Whitney, B. A., Indebetouw, R., Wood, K., & Denzmore, P. 2006, ApJS, 167, 256
- Sandell, Jessop & Jenness (2001) Sandell, G., Jessop, N., & Jenness, T. 2001, ”The SCUBA map reduction Cookbook”, Starlink Cookbook 11.2 ,Rutherford Appleton Laboratory, Particle Physics & Astronomy Research Council
- Sandell et al. (1999) Sandell, G., et al. 1999, ApJ, 519, 236
- Sault, Teuben & Wright (1995) Sault, R.J., Teuben, P.J., & Wright, M.C.H., 1995, in ASP Conf. Ser. 77: Astronomical Data Analysis Software and Systems IV, Eds. R.A. Shaw, H.E. Payne, & J.J.E. Hayes (Astronomical Society of the Pacific: San Francisco), p. 433
- Simon et al. (2007) Simon, J. D., Bolatto, A. D., Whitney, B. A., Robitaille, T. P., Shah, R. Y. Makovoz, D., Stanimirović, S., Barbá, R. H., & Rubio, M. 2007, ApJ, 669, 327
- Stern et al. (2005) Stern, D., et al. 2005, ApJ, 631, 163
- Sugitani et al. (1989) Sugitani, K., Fukui, Y., Mizuni, A., & Ohashi, N. 1989, ApJ, 342, L87
- Sugitani et al. (1995) Sugitani, K., Tamura, M., & Ogura, K. 1995, ApJ, 455, L39
- Tamura et al. (1998) Tamura, M., Itoh, Y., Oasa, Y., & Nakajima, T. 1998, Science, 282, 1095
- Walter et al. (2008) Walter, F.M., Sherry, W.H., Wolk, S.J., & Adams, N.R. 2008, in Handbook of Star Forming Regions, Vol. I, Ed. Bo Reipurth, Astron. Soc. Pac., p. 732
- Wouterloot & Walmsley (1986) Wouterloot, J. G. A., & Walmsley, C. M. 1986, A&A, 168, 237
| Source | Optical | 2MASS | IRAC | MIPS | |||||||
|---|---|---|---|---|---|---|---|---|---|---|---|
| Ori I-2 | mag | mag | mag | mag | mJy | mJy | mJy | mJy | mJy | ||
| MIR-1 | 5:37:55.30 | -1:43:39.2 | 17.5 | 14.710.03 | 14.00 0.03 | 13.82 0.06 | 1.080.01 | 0.71 0.01 | 0.48 0.01 | 0.32 0.02 | … |
| MIR-2 | 5:37:55.41 | -1:45:22.1 | 20.3 | … | … | … | 0.180.01 | 0.13 0.00 | … | … | … |
| MIR-3 | 5:37:55.43 | -1:43:16.4 | 16.3 | 14.660.04 | 14.15 0.04 | 14.14 0.06 | 0.720.01 | 0.44 0.01 | 0.30 0.01 | 0.17 0.02 | … |
| MIR-4 | 5:37:55.47 | -1:47:24.7 | 17.2 | 14.840.03 | 14.05 0.04 | 13.85 0.05 | 0.950.02 | 0.59 0.01 | 0.43 0.03 | … | … |
| MIR-5 | 5:37:55.55 | -1:46:04.4 | 22.1 | … | … | … | 0.080.01 | 0.07 0.00 | … | … | … |
| MIR-6 | 5:37:55.93 | -1:45:56.4 | 21.2 | … | … | … | 0.070.00 | 0.05 0.00 | … | … | … |
| MIR-7 | 5:37:55.94 | -1:42:33.4 | 17.3 | 14.780.03 | 14.13 0.04 | 13.85 0.05 | aaOutside the area mapped in 3.6 and 5.8 µm | 0.62 0.01 | aaOutside the area mapped in 3.6 and 5.8 µm | … | … |
| MIR-8 | 5:37:56.30 | -1:42:55.4 | 15.2 | 12.520.03 | 11.81 0.02 | 11.63 0.02 | 7.650.16 | 4.81 0.02 | 3.03 0.03 | 1.78 0.02 | … |
| MIR-9 | 5:37:56.39 | -1:45:15.2 | 23.3 | … | … | … | 0.090.00 | 0.06 0.00 | … | … | … |
| MIR-10 | 5:37:57.04 | -1:47:40.9 | 18.2 | 16.720.13 | 16.18 0.15 | 16.81… | 0.130.00 | 0.08 0.00 | 0.10 0.01 | … | … |
| MIR-11 | 5:37:57.28 | -1:44:10.5 | … | … | … | … | … | … | … | 0.17 0.02 | … |
| MIR-12 | 5:37:57.80 | -1:44:29.5 | 14.0 | 12.690.03 | 12.38 0.02 | 12.37 0.03 | 3.660.02 | 2.32 0.01 | 1.49 0.02 | 0.86 0.02 | … |
| MIR-13 | 5:37:57.99 | -1:47:27.4 | … | … | … | … | 0.050.00 | 0.04 0.00 | … | … | … |
| MIR-14 | 5:37:58.01 | -1:45:23.4 | 22.2 | … | … | … | 0.080.00 | 0.05 0.00 | … | … | … |
| MIR-15 | 5:37:58.12 | -1:44:40.7 | 17.9 | 16.630.12 | 16.27 0.16 | 14.96… | 0.120.00 | 0.07 0.00 | … | … | … |
| MIR-16 | 5:37:58.29 | -1:42:37.4 | 19.3 | … | … | … | aaOutside the area mapped in 3.6 and 5.8 µm | 0.13 0.00 | aaOutside the area mapped in 3.6 and 5.8 µm | 0.29 0.02 | … |
| MIR-17 | 5:37:58.38 | -1:47:30.3 | 20.0 | 16.730.13 | 16.31 0.16 | 15.50 0.22 | 0.180.00 | 0.12 0.00 | 0.14 0.01 | … | … |
| MIR-18 | 5:37:58.64 | -1:47:30.6 | 21.5 | … | … | … | 0.150.00 | 0.10 0.00 | … | … | … |
| MIR-19 | 5:37:58.77 | -1:44:56.3 | 18.1 | 16.810.14 | 16.34 0.17 | 15.95… | 0.110.00 | 0.07 0.00 | … | … | … |
| MIR-20 | 5:37:58.78 | -1:45:50.0 | 15.6 | 13.100.03 | 12.40 0.02 | 12.19 0.02 | 4.320.02 | 2.70 0.01 | 1.95 0.02 | 1.06 0.02 | … |
| MIR-21 | 5:37:58.86 | -1:47:28.1 | 23.1 | … | … | … | 0.110.00 | 0.07 0.00 | … | … | … |
| MIR-22 | 5:37:59.07 | -1:44:14.2 | … | … | … | … | … | … | … | 0.14 0.02 | … |
| MIR-23 | 5:37:59.13 | -1:43:54.2 | 16.9 | 14.530.03 | 13.77 0.04 | 13.63 0.05 | 1.260.01 | 1.16 0.10 | 1.04 0.02 | 1.50 0.02 | … |
| MIR-24 | 5:37:59.24 | -1:46:35.5 | … | … | … | … | 0.040.00 | 0.03 0.00 | … | … | … |
| MIR-25 | 5:37:59.35 | -1:45:17.9 | 16.9 | 15.260.04 | 14.70 0.04 | 14.57 0.07 | 0.400.01 | 0.26 0.01 | 0.16 0.01 | 0.16 0.02 | … |
| MIR-26 | 5:37:59.36 | -1:44:32.1 | 20.5 | 17.040.16 | 16.44 0.18 | 15.54 0.22 | 0.160.00 | 0.11 0.00 | 0.09 0.01 | … | … |
| MIR-27 | 5:37:59.49 | -1:45:52.2 | 19.0 | 16.150.07 | 15.57 0.10 | 15.25 0.16 | 0.230.00 | 0.15 0.00 | 0.10 0.01 | … | … |
| MIR-28 | 5:37:59.53 | -1:46:49.2 | … | … | … | … | 0.120.00 | 0.08 0.00 | … | … | … |
| MIR-29 | 5:38:00.00 | -1:44:30.6 | 18.3 | 15.980.07 | 15.24 0.07 | 15.23 0.17 | 0.350.00 | 0.19 0.00 | … | … | … |
| MIR-30 | 5:38:00.04 | -1:46:22.5 | 18.6 | … | … | … | 0.050.00 | 0.06 0.00 | … | … | … |
| MIR-31 | 5:38:00.44 | -1:42:59.4 | 19.5 | … | … | … | 0.060.00 | 0.05 0.00 | … | … | … |
| MIR-32 | 5:38:00.90 | -1:46:44.9 | … | … | … | … | 0.070.00 | 0.04 0.00 | … | … | … |
| MIR-33 | 5:38:01.03 | -1:44:33.7 | … | … | … | … | 0.150.00 | 0.11 0.00 | … | … | … |
| MIR-34 | 5:38:01.06 | -1:47:14.1 | 16.4 | 14.910.04 | 14.30 0.04 | 14.46 0.07 | 0.510.00 | 0.31 0.00 | 0.24 0.01 | 0.15 0.02 | … |
| MIR-35 | 5:38:01.07 | -1:44:50.8 | 22.5 | … | … | … | 0.090.00 | 0.07 0.00 | … | … | … |
| MIR-36 | 5:38:01.07 | -1:43:51.1 | … | … | … | … | 0.050.00 | 0.05 0.00 | … | … | … |
| MIR-37 | 5:38:01.60 | -1:44:32.5 | … | … | … | … | 0.060.00 | 0.04 0.00 | … | … | … |
| MIR-38 | 5:38:01.83 | -1:45:50.1 | 15.1 | 12.450.03 | 11.82 0.02 | 11.62 0.03 | 7.880.03 | 4.40 0.02 | 4.07 0.03 | 3.86 0.03 | … |
| MIR-39 | 5:38:02.10 | -1:44:10.9 | 23.2 | … | … | … | 0.060.00 | 0.04 0.00 | … | … | … |
| MIR-40 | 5:38:02.24 | -1:47:30.1 | … | … | … | … | 0.050.00 | 0.05 0.00 | … | … | … |
| MIR-41 | 5:38:02.33 | -1:47:40.4 | 19.1 | 14.090.03 | 13.49 0.03 | 13.10 0.03 | 3.480.11 | 3.21 0.30 | 2.88 0.03 | 2.55 0.06 | 2.40 0.05 |
| MIR-42 | 5:38:02.35 | -1:43:47.3 | … | … | … | … | 0.080.00 | 0.05 0.00 | … | … | … |
| MIR-43 | 5:38:02.36 | -1:44:01.8 | 22.7 | … | … | … | 0.020.00 | 0.03 0.00 | … | … | … |
| MIR-44 | 5:38:02.87 | -1:42:36.7 | 17.4 | 13.120.03 | 12.58 0.02 | 12.23 0.03 | bbThe star is at the edge of the 3.6 µm-map and only partially detected | 3.34 0.02 | 2.13 0.04 | 1.26 0.03 | … |
| MIR-45 | 5:38:03.42 | -1:45:15.1 | … | … | … | … | 0.090.00 | 0.04 0.00 | … | … | … |
| MIR-46 | 5:38:03.57 | -1:44:15.6 | … | … | … | … | 0.080.00 | 0.06 0.00 | … | … | … |
| MIR-47 | 5:38:03.87 | -1:45:57.5 | 17.6 | 16.010.07 | 15.40 0.08 | 15.40 0.17 | 0.280.00 | 0.16 0.00 | … | … | … |
| MIR-48 | 5:38:04.10 | -1:46:25.1 | 18.5 | … | … | … | 0.090.00 | 0.05 0.00 | … | … | … |
| MIR-49 | 5:38:04.33 | -1:44:37.9 | … | 17.27… | 16.68 0.26 | 15.20 0.16 | 0.630.01 | 0.54 0.01 | 0.43 0.01 | … | … |
| MIR-50 | 5:38:04.43 | -1:45:50.3 | … | … | … | … | 0.150.00 | 0.09 0.00 | 0.76 0.01 | … | … |
| MIR-51 | 5:38:04.56 | -1:45:53.0 | 17.3 | 15.260.04 | 14.72 0.04 | 14.64 0.10 | 0.660.01 | 0.76 0.10 | 1.67 0.37 | 2.72 0.03 | … |
| MIR-52 | 5:38:04.78 | -1:45:32.2 | 19.9 | 13.560.04 | 12.73 0.04 | 12.16 0.03 | 7.180.03 | 5.13 0.12 | 4.00 0.38 | 2.91 0.03 | 11.37 0.05 |
| MIR-53 | 5:38:05.10 | -1:45:41.9 | 22.8 | … | … | … | 0.090.00 | 0.02 0.00 | … | … | … |
| MIR-54 | 5:38:05.15 | -1:45:12.4 | … | … | … | … | 3.100.02 | 4.97 0.04 | 15.73 0.06 | 13.63 0.06 | 231.90 0.44 |
| MIR-55 | 5:38:05.19 | -1:46:18.9 | 20.7 | … | … | … | 0.080.00 | 0.06 0.00 | … | … | … |
| MIR-56 | 5:38:05.40 | -1:47:05.8 | 22.5 | … | … | … | 0.100.00 | 0.06 0.00 | … | … | … |
| MIR-57 | 5:38:05.50 | -1:42:43.1 | 21.7 | … | … | … | … | 0.10 0.00 | … | … | … |
| MIR-58 | 5:38:05.83 | -1:42:36.3 | 14.1 | 12.450.03 | 11.94 0.02 | 11.84 0.03 | 5.860.28 | 3.47 0.02 | 2.26 0.03 | 1.28 0.02 | … |
| MIR-59 | 5:38:05.86 | -1:47:04.1 | 19.1 | 16.950.15 | 16.26 0.16 | 15.70 0.23 | 0.130.00 | 0.08 0.00 | … | … | … |
| MIR-60 | 5:38:05.90 | -1:43:05.7 | 19.8 | … | … | … | 0.070.00 | 0.05 0.00 | … | … | … |
| MIR-61 | 5:38:06.06 | -1:46:00.2 | 18.2 | 15.930.07 | 15.34 0.07 | 15.06 0.13 | 0.390.00 | 0.20 0.00 | … | … | … |
| MIR-62 | 5:38:06.26 | -1:43:59.6 | … | … | … | … | 0.060.00 | 0.04 0.00 | … | … | … |
| MIR-63 | 5:38:06.38 | -1:45:02.1 | 20.2 | 16.710.13 | 16.23 0.15 | 15.40 0.18 | 0.290.00 | 0.02 0.00 | … | … | … |
| MIR-64 | 5:38:06.38 | -1:46:36.4 | 16.6 | 13.970.03 | 13.24 0.02 | 12.99 0.03 | 2.060.01 | 1.30 0.01 | 0.93 0.02 | 0.47 0.02 | … |
| MIR-65 | 5:38:06.65 | -1:46:55.5 | 20.8 | … | … | … | 0.100.00 | 0.07 0.00 | … | … | … |
| MIR-66 | 5:38:06.77 | -1:47:14.8 | 21.6 | … | … | … | 0.060.00 | 0.05 0.00 | … | … | … |
| MIR-67 | 5:38:06.84 | -1:47:03.8 | … | … | … | … | 0.040.00 | 0.03 0.00 | … | … | … |
| MIR-68 | 5:38:06.99 | -1:43:04.0 | 20.1 | 16.890.14 | 16.07 0.14 | 15.77 0.26 | 0.140.00 | 0.10 0.00 | … | … | … |
| MIR-69 | 5:38:07.25 | -1:45:59.7 | 20.7 | … | … | … | 0.130.00 | 0.06 0.00 | … | … | … |
| MIR-70 | 5:38:07.27 | -1:47:13.0 | 23.3 | … | … | … | 0.050.00 | 0.04 0.00 | … | … | … |
| MIR-71 | 5:38:07.64 | -1:42:46.8 | 18.5 | 16.940.15 | 16.15 0.14 | 15.86… | 0.120.00 | 0.07 0.00 | … | … | … |
| MIR-72 | 5:38:07.65 | -1:44:17.9 | 16.2 | 13.690.03 | 13.01 0.03 | 12.76 0.04 | 2.390.02 | 1.78 0.01 | 1.25 0.02 | 0.65 0.02 | … |
| MIR-73 | 5:38:08.01 | -1:45:07.7 | S | 8.480.03 | 8.55 0.03 | 8.57 0.02 | 99.10.2 | 59.6 0.2 | 41.4 0.1 | 21.8 0.1 | 6.32 0.05 |
| MIR-74 | 5:38:08.11 | -1:42:43.5 | 20.1 | 16.940.15 | 16.20 0.15 | 15.47 0.19 | 0.160.01 | 0.11 0.00 | 0.04 0.01 | … | … |
| MIR-75 | 5:38:08.19 | -1:43:16.0 | 16.3 | 14.770.03 | 14.27 0.04 | 14.08 0.06 | 0.640.01 | 0.45 0.01 | 0.30 0.01 | 0.12 0.02 | … |
| MIR-76 | 5:38:08.68 | -1:43:01.1 | 18.2 | 15.940.06 | 15.16 0.06 | 14.80 0.10 | 0.340.00 | 0.22 0.00 | 0.08 0.01 | … | … |
| MIR-77 | 5:38:08.88 | -1:43:28.3 | 22.6 | … | … | … | 0.030.00 | 0.03 0.00 | … | … | … |
| MIR-78 | 5:38:08.92 | -1:44:48.2 | 18.2 | 16.610.11 | 16.11 0.14 | 16.81… | 0.110.00 | 0.07 0.00 | … | … | … |
| MIR-79 | 5:38:09.14 | -1:45:06.7 | … | … | … | … | 0.060.00 | 0.05 0.00 | … | … | … |
| MIR-80 | 5:38:09.40 | -1:44:20.7 | … | … | … | … | 0.070.00 | 0.13 0.00 | … | … | … |
| MIR-81 | 5:38:09.66 | -1:47:16.8 | 17.0 | 15.120.04 | 14.64 0.04 | 14.41 0.08 | 0.510.00 | 0.33 0.00 | 0.27 0.01 | 0.14 0.02 | … |
| MIR-82 | 5:38:09.69 | -1:44:51.0 | … | … | … | … | 0.030.00 | 0.04 0.00 | … | … | … |
| MIR-83 | 5:38:09.78 | -1:44:42.6 | 19.4 | … | … | … | 0.060.00 | 0.05 0.00 | … | … | … |
| MIR-84 | 5:38:09.93 | -1:45:47.5 | 16.2 | 14.580.03 | 14.19 0.03 | 14.12 0.06 | 0.670.01 | 0.44 0.01 | 0.30 0.01 | 0.21 0.02 | … |
| MIR-85 | 5:38:09.96 | -1:45:53.0 | … | … | … | … | 0.020.00 | 0.02 0.00 | … | … | … |
| MIR-86 | 5:38:09.97 | -1:47:00.6 | 20.3 | … | … | … | 0.110.00 | 0.07 0.00 | … | … | … |
| MIR-87 | 5:38:10.01 | -1:43:35.6 | 17.8 | 16.230.09 | 15.94 0.13 | 15.75 0.25 | 0.160.00 | 0.10 0.00 | … | … | … |
| MIR-88 | 5:38:10.02 | -1:45:38.1 | 23.5 | … | … | … | 0.700.09 | 0.35 0.10 | 0.12 0.01 | 0.15 0.02 | … |
| MIR-89 | 5:38:10.16 | -1:45:15.6 | … | … | … | … | 0.140.00 | 0.58 0.10 | 0.73 0.01 | 2.91 0.02 | 21.40 0.05 |
| MIR-90 | 5:38:10.30 | -1:44:15.4 | … | … | … | … | 0.050.00 | 0.06 0.00 | … | … | … |
| MIR-91 | 5:38:10.31 | -1:43:44.8 | … | … | … | … | 0.110.00 | 0.07 0.00 | … | … | … |
| MIR-92 | 5:38:10.35 | -1:45:59.4 | … | … | … | … | 0.010.00 | 0.02 0.00 | … | … | … |
| MIR-93 | 5:38:10.41 | -1:45:26.4 | 19.2 | 16.020.09 | 15.13 0.08 | 14.62 0.11 | 0.630.01 | 0.35 0.00 | 0.29 0.01 | 0.51 0.02 | … |
| MIR-94 | 5:38:10.52 | -1:43:13.7 | 18.6 | 17.110.18 | 16.03 0.14 | 15.54… | 0.120.00 | 0.08 0.00 | … | … | … |
| MIR-95 | 5:38:10.69 | -1:44:07.4 | … | … | … | … | 0.100.00 | 0.06 0.00 | … | … | … |
| MIR-96 | 5:38:10.70 | -1:45:03.9 | 23.7 | … | … | … | 0.080.00 | 0.05 0.00 | … | … | … |
| MIR-97 | 5:38:10.79 | -1:44:11.6 | 22.9 | … | … | … | 0.090.00 | 0.06 0.00 | … | … | … |
| MIR-98 | 5:38:10.80 | -1:44:44.5 | 19.2 | … | … | … | 0.070.00 | 0.04 0.00 | … | … | … |
| MIR-99 | 5:38:10.85 | -1:46:57.6 | … | … | … | … | 0.090.00 | 0.07 0.00 | … | … | … |
| MIR-100 | 5:38:10.85 | -1:46:52.1 | … | … | … | … | 0.100.00 | 0.05 0.00 | … | … | … |
| MIR-101 | 5:38:10.98 | -1:44:03.1 | … | … | … | … | 0.070.00 | 0.06 0.00 | … | … | … |
| MIR-102 | 5:38:11.08 | -1:46:09.5 | … | … | … | … | 0.030.00 | 0.04 0.00 | … | … | … |
| MIR-103 | 5:38:11.21 | -1:45:35.0 | 16.9 | 15.540.06 | 15.39 0.08 | 15.15 0.15 | 0.270.00 | 0.17 0.00 | 0.07 0.01 | … | … |
| MIR-104 | 5:38:11.66 | -1:44:56.5 | … | … | … | … | … | … | 0.10 0.01 | 0.30 0.02 | … |
| MIR-105 | 5:38:11.71 | -1:46:57.4 | … | … | … | … | 0.070.00 | 0.05 0.00 | … | … | … |
| MIR-106 | 5:38:11.71 | -1:44:48.1 | 23.1 | … | … | … | 0.060.00 | 0.04 0.00 | … | … | … |
| MIR-107 | 5:38:11.81 | -1:43:01.1 | 17.6 | 14.720.03 | 14.01 0.04 | 13.80 0.05 | 1.070.01 | 0.74 0.01 | 0.45 0.01 | 0.25 0.02 | … |
| MIR-108 | 5:38:11.97 | -1:46:38.8 | … | … | … | … | 0.170.00 | 0.12 0.00 | … | … | … |
| MIR-109 | 5:38:11.99 | -1:45:44.5 | 21.2 | … | … | … | 0.050.00 | 0.03 0.00 | … | … | … |
| MIR-110 | 5:38:12.01 | -1:45:06.5 | 18.2 | 16.560.12 | 16.46 0.19 | 15.72 0.23 | 0.080.00 | 0.05 0.00 | … | … | … |
| MIR-111 | 5:38:12.04 | -1:43:36.6 | … | … | … | … | 0.060.00 | 0.04 0.00 | … | … | … |
| MIR-112 | 5:38:12.16 | -1:46:56.6 | 23.7 | … | … | … | 0.060.00 | 0.06 0.00 | … | … | … |
| MIR-113 | 5:38:12.44 | -1:46:53.8 | … | … | … | … | 0.090.00 | 0.08 0.00 | … | … | … |
| MIR-114 | 5:38:12.62 | -1:47:07.5 | 17.5 | 15.600.05 | 15.29 0.08 | 14.95 0.12 | 0.320.00 | 0.20 0.00 | 0.16 0.01 | 0.13 0.02 | … |
| MIR-115 | 5:38:13.32 | -1:47:17.5 | 17.4 | 15.650.05 | 15.17 0.09 | 14.97 0.13 | 0.310.00 | 0.21 0.00 | 0.14 0.01 | … | … |
| MIR-116 | 5:38:13.37 | -1:42:41.9 | 13.8 | 12.400.03 | 12.10 0.03 | 12.02 0.03 | 4.740.03 | 3.14 0.01 | 1.93 0.02 | 1.10 0.02 | … |
| MIR-117 | 5:38:13.57 | -1:43:36.1 | 16.4 | 15.150.04 | 14.67 0.06 | 14.98 0.15 | 0.440.01 | 0.30 0.00 | 0.14 0.01 | … | … |
| MIR-118 | 5:38:13.59 | -1:44:27.8 | … | … | … | … | 0.080.00 | 0.04 0.00 | … | … | … |
| MIR-119 | 5:38:13.69 | -1:45:15.3 | 19.7 | … | … | … | 0.120.00 | 0.07 0.00 | … | … | … |
| MIR-120 | 5:38:14.08 | -1:43:50.9 | 14.2 | 12.190.03 | 11.63 0.02 | 11.51 0.03 | 7.790.03 | 4.90 0.02 | 3.21 0.03 | 1.84 0.02 | … |
| MIR-121 | 5:38:14.68 | -1:44:53.1 | 23.5 | … | … | … | 0.120.00 | 0.07 0.00 | … | … | … |
| MIR-122 | 5:38:14.90 | -1:46:07.9 | … | … | … | … | 0.060.00 | 0.07 0.00 | … | … | … |
| MIR-123 | 5:38:14.92 | -1:47:04.1 | 18.4 | 16.900.14 | 16.52 0.21 | 16.35… | 0.090.00 | 0.06 0.00 | … | … | … |
| MIR-124 | 5:38:15.01 | -1:45:58.6 | 20.4 | … | … | … | 0.130.00 | 0.10 0.00 | … | … | … |
| MIR-125 | 5:38:15.45 | -1:45:56.1 | 20.4 | … | … | … | 0.100.00 | 0.09 0.00 | … | … | … |
| Name | (2000.0) | (2000.0) |
|---|---|---|
| HH 992A | 05:38:14.53 | -01:45:16.6 |
| HH 992B | 05:38:14.67 | -01:45:16.3 |
| HH 992C | 05:38:14.70 | -01:45:17.6 |
| Source | ||||||||
|---|---|---|---|---|---|---|---|---|
| K | M⊙ | M⊙ | M⊙ yr-1 | M⊙ yr-1 | L⊙ | |||
| MIR-23 | 311018 | 0.130.01 | 1.7(-4)5.3(-5) | 2.9(-6)9.2(-7) | 0.0 | 1.9(-11)6.2(-13) | 0.030.001 | 0.10.03 |
| MIR-41 | 3750184 | 0.560.12 | 5.0(-3)3(-3) | 2.0(-6)1.8(-6) | 0.0 | 1.4(-8)7.1(-9) | 0.680.003 | 3.10.8 |
| MIR-51 | 4500 | 1.56 | 2.0(-4) | 3.3(-4) | 1.9(-7) | 8.2(-10) | 6.5 | 1.9 |
| MIR-52 | 2980 | 0.14 | 5.2(-5) | 9.7(-4) | 1.0(-7) | 3.1(-11) | 0.24 | 4.8 |
| MIR-54 | 3380 | 0.30 | 2.5(-3) | 1.9(-1) | 5.9(-6) | 1.1(-8) | 1.36 | 12 |
| MIR-89 | 3370 | 0.24 | 4.5(-3) | 2.1(-9) | 0.0 | 3.3(-8) | 0.3 | 50 |