Pre-main sequence stars in the Cepheus flare region
Abstract
We present results of optical spectroscopic and photometric observations of 77 pre-main sequence (PMS) stars in the Cepheus flare region. A total of 64 of these are newly confirmed PMS stars, originally selected from various published candidate lists. We estimate effective temperatures and luminosities for the PMS stars, and comparing the results with pre-main sequence evolutionary models we estimate stellar masses of 0.2–2.4 M☉ and stellar ages of 0.1–15 Myr. Among the PMS stars, we identify 15 visual binaries with separations of 2–10 arcsec. From archival IRAS, 2MASS, and Spitzer data, we construct their spectral energy distributions and classify 5% of the stars as Class I, 10% as Flat SED, 60% as Class II, and 3% as Class III young stellar objects (YSOs). We identify 12 CTTS and 2 WTTS as members of NGC 7023, with mean age of 1.6 Myr. The 13 PMS stars associated with L 1228 belong to three small aggregates: RNO 129, L 1228 A, and L 1228 S. The age distribution of the 17 PMS stars associated with L 1251 suggests that star formation has propagated with the expansion of the Cepheus flare shell. We detect sparse aggregates of 6–7 Myr-old PMS stars around the dark clouds L 1177 and L 1219, at a distance of pc. Three T Tauri stars appear to be associated with the Herbig Ae star SV Cep at a distance of 600 pc. Our results confirm that the molecular complex in the Cepheus flare region contains clouds of various distances and star forming histories.
1 Introduction
Star forming regions in our Galactic environment offer a unique opportunity for understanding the birth of planetary systems. There is growing evidence that not only the stellar content and structure of young stellar groups, but also the evolution of protostellar envelopes and accretion disks depend on the star forming environment (e.g. Hester & Desch, 2005; Dullemond et al., 2006). Cross-comparing various star forming environments is important for understanding the origins and early evolution of stars and planets. In this paper we present our results of spectroscopic and photometric studies of a population of pre-main sequence stars associated with the molecular clouds of the Cepheus flare, located at 200–400 pc from the Sun.
A detailed review on the ISM and young stellar populations in the Cepheus flare region can be found in Kun, Kiss, & Balog (2008). Here we briefly review the highlights that are relevant for this study. The Cepheus flare (Hubble, 1934) molecular cloud complex consists of a large amount of dense ISM between and above (Lynds, 1962; Taylor, Dickman & Scoville, 1987; Clemens & Barvainis, 1988; Dobashi et al., 2005). Though the CO maps of the region presented by Lebrun (1986) and Grenier et al. (1989) indicate a coherent cloud complex, there is evidence for multiple cloud layers over the Cepheus flare region. For instance, stars illuminating reflection nebulae or displaying 100 µm excess due to their dusty environment, can be found at various distances (e.g. Racine, 1968; Kun, Vinkó & Szabados, 2000), suggesting the presence of more than one dust layer between about 200 and 800 pc. Wolf diagrams of the region indicate extinction layers at 200, 300, and about 450 pc (Kun, 1998). Radial velocity measurements of the interstellar matter suggest the presence of several gas layers (e.g. Heiles, 1967; Yonekura et al., 1997). Olano et al. (2006) modeled the space distribution and kinematics of the interstellar neutral and molecular gas by an expanding shell, centered on , at a distance of about 300 pc. The presence of the Cepheus flare Shell (CFS), an old supernova remnant, readily explains the divergent cloud distances and the wide range of radial velocities. The giant radio continuum feature Loop III (Berkhuijsen, 1973; Spoelstra, 1973), conspicuous in the WMAP K-band polarization map (Page et al., 2007), is nearly concentric with the molecular shell. Several giant far-infrared loops, possibly old supernova shells, have been identified in the IRAS images of the Cepheus flare region (Kiss et al., 2004).
Signposts of low-mass star formation in the Cepheus flare region have been detected in the molecular clouds L 1082 (B 150, GF 9), L 1148/L 1158, L 1172/L1174 (associated with the young cluster NGC 7023), L 1228, L 1177 (CB 230), L 1219 (B 175), L 1221, L 1251, and L 1261 (CB 244) (see review of Kun et al., 2008). Recently, Kirk et al. (2009) presented a list of 133 young stellar objects and candidates, based on Spitzer observations of L 1148/L 1158, L 1172/L1174, L 1228, L 1221, and L 1251. Independent distance estimations of individual clouds suggest various distances between 150 and 500 pc, but are clustered around 300 pc. The young open cluster NGC 7129, associated with the dark cloud L 1181, is projected on the Cepheus flare region at (,)=(105.4,+9.9), but is more distant than the bulk of clouds (800–1250 pc, see Kun et al. (2008). The central region of the complex is lacking signatures of active star formation. The physical connection between the star-forming clouds remains rather uncertain.
Scarce information is available on the pre-main-sequence (PMS) stellar population of the region. Herbig & Bell (1988) list only 14 young objects in the Cepheus flare region: RNO 124 and PV Cep (associated with the cloud complex L 1148/L 1158), HD 200775, EH Cep, FU Cep, FV Cep (members of NGC 7023), LkH 234, BD +65°1637, V350 Cep, [SVS76] NGC 7129 6 (members of NGC 7129), AS 507 (associated with L 1261), and the apparently isolated Herbig Ae/Be stars BH Cep, BO Cep, and SV Cep. Six further stars in NGC 7129 (MEG 1–MEG 3, [HL85] 14: Miranda et al. 1993; GGD 33a: Miranda et al. 1994, and V391 Cep: Semkov 1993) show T Tauri-like emission spectra, but no spectral types have been given for them in the literature. Tachihara et al. (2005) identified 16 weak-line T Tauri stars in the region, by spectroscopic and photometric follow-up studies of X-ray emitting stars found in the ROSAT database. These stars are not obviously associated with any dark cloud. Understanding star formation in each dark cloud and relating star formation rates across the dark clouds requires a comprehensive deep survey.
Here, we use optical and infrared observations to develop a better picture of star formation in this region. To constrain the nature of the candidate young stars, we combine new optical spectroscopy and BVRI photometry with archival infrared data from IRAS, 2MASS, and Spitzer. We describe our observations and data reduction in Sect. 2. We use these data to estimate ages, luminosities, masses, and disk properties of individual young stars and to analyze the distributions of these physical parameters among each cloud. Section 3 contains the main results, namely the HR diagrams and spectral energy distributions of the target stars. We discuss the implications of our results for the star formation history of the region in Sect. 4.
2 Observations and data reduction
2.1 Target selection
Several lists of potential PMS stars, such as H emission stars detected by objective prism surveys, irregular variables, far- and mid-infrared sources can be found in the literature. The targets of our studies are the stars brighter than about mag from the lists as follows: irregular variables associated with NGC 7023 (Rosino & Romano, 1962) and NGC 7129 (Semkov, 2003), H emission stars associated with L 1228 (Ogura & Sato, 1990), L 1251 (Kun & Prusti, 1993), NGC 7129 (Magakian et al., 2004), and distributed over the whole area of the Cepheus flare (Kun, 1998), nebulous stars associated with L 1251 (Eiroa et al., 1994); IRAS point sources of T Tauri-like flux ratios, distributed over the whole region (Kun, 1998), near-infrared sources associated with L 1251 (Rosvick & Davidge, 1995), and Spitzer sources associated with L 1228 S (Padgett et al., 2004). In addition we found four new band-excess stars in the 2MASS (Cutri et al., 2003) database, not coinciding with previously identified PMS star candidates (2MASS 21223461+6921142, 21225427+6921345, 21544662+6708255, and 22283821+7119023). Only one of them (2MASS 21225427+6921345) was sufficiently bright in the optical wavelengths for our spectroscopic observations. In all, we observed spectra of 170 stars, including 13 confirmed PMS stars of the region. Spectral types for some of these latter stars were presented by Cohen & Kuhi (1979) and Mora et al. (2001), however no previous studies have presented spectroscopy of the red part of the optical spectrum nor photometry for these stars.
The accuracy of the target coordinates given in the source papers and in the SIMBAD database is typically several arcseconds. Therefore we used the published finding charts of the objects with the DSS to refine the coordinates, and then used these improved coordinates to find the associated 2MASS source (usually with positional accuracy of 02).
2.2 Spectroscopy
2.2.1 CAFOS spectra
Spectra of 155 stars were observed using the CAFOS instrument on the 2.2-m telescope of Calar Alto Observatory between 1999 August 7–11, 2004 August 10–15, 2005 September 11–14, and 2008 August 26–31. At some target positions two stars can be found within a few arcseconds. We obtained spectra of both stars provided both were sufficiently bright. During the observing run in 1999 we used the G–100 grism, covering the wavelength range 5000–7000 Å. Observations in 2004–2008 were performed through the R–100 grism, covering the wavelength interval 5800–9000 Å. The spectral resolution of CAFOS observation, using a 1.5-arcsec slit, was at Å. We estimated the exposure time required for obtaining at 6600 Å based on the available optical magnitudes of the target stars. The spectrum of a He–Ne–Rb lamp was regularly observed for wavelength calibration. We reduced and analysed the spectra using standard IRAF111IRAF is distributed by the National Optical Astronomy Observatories, which are operated by the Association of Universities for the Research in Astronomy, Inc., under cooperative agreement with the National Science Foundation. http://iraf.noao.edu/ routines.
The wavelength range of spectra taken with the R–100 grism was suitable for determining several flux ratios defined for spectral classification by Kirkpatrick, Henry & McCarthy (1991) (A, B, C, B / A, B / C), Martín & Kun (1996) (I2, I3), and Preibisch et al. (2001) (T1, T2). We measured these spectral features on the spectra of our stars, and calibrated them against the spectral type and luminosity class by measuring them in a series of standard stars published by Le Borgne et al. (2003). Each flux ratio resulted in an estimate of spectral type, and we adopted as final spectral type the average of those inferred from the individual flux ratios. The accuracy of our spectral classification, estimated from the range of spectral types obtained from different flux ratios, is subclass. We have not tried to correct the classification for the veiling. The above spectral indices can be used for classification of stars later than about K5. The brighter, and thus possibly earlier type, stars of the region were therefore observed with other instruments, covering shorter wavelengths. To classify K-type stars in the CAFOS+R–100 sample we used the Ca I lines at 6122 and 6161 Å. Spectral classification criteria for the spectra obtained with G–100 grism included the Mg I, Na I, and Ca I lines. Preliminary results of the classification of these stars were presented in Eredics & Kun (2003).
2.2.2 FLWO spectra
With the help of the FLWO staff (P. Berlind, M. Calkins) we acquired low-resolution optical spectra of 46 target stars with FAST, a high throughput slit spectrograph mounted on the Fred L. Whipple Observatory 1.5-m telescope on Mount Hopkins, Arizona (Fabricant et al., 1998). In addition to the candidate PMS stars, we observed the spectrum of VDB 141, a star illuminating a reflection nebula near L 1177, whose spectral type is not included in Racine’s (1968) list of reflection nebulae. We used a 300 g mm-1 grating blazed at 4750 Å, a 3″ slit, and a thinned Loral 512 2688 CCD. These spectra cover 3800–7500 Å at a resolution of 6 Å. We reduced and analysed the spectra with IRAF. After trimming the CCD frames at each end of the slit, we corrected for the bias level and flat-field for each frame, applied an illumination correction, and derived a full-wavelength solution from calibration lamps acquired immediately after each exposure. The wavelength solution for each frame has a probable error of 0.5–1.0 Å. To construct final 1-D spectra, we extracted object and sky spectra using the optimal extraction algorithm within APEXTRACT. Most spectra have moderate signal-to-noise per pixel (). Using the method described by Balog & Kenyon (2002), we detected H emission in the spectra of 22 stars. The spectral classification was performed by visually comparing the spectra of MK standard stars with our candidates following the procedure described by Jaschek & Jaschek (1987).
2.2.3 The final list of PMS stars
We accepted an object as a classical T Tauri star if it fulfilled the criterion established by Barrado y Navascués & Martín (2003), i.e. EW(H) exceeded the saturation limit of the chromospheric activity, depending on the spectral type. The H emission of such stars is thought to originate from the gas accreted by the star from the disk. Many of our target stars claimed to be H emission stars based on objective prism observations (Ogura & Sato, 1990; Kun, 1998) proved to be M-type dwarfs with EW(H) Å, evolved stars, or stars without H emission. Part of these latter stars may be PMS objects with variable H emission. Possibly such an object is K98c Em* 132, a K-type star whose H absorption line is filled in by emission (see Fig. 1). We excluded these stars from the further study, unless the LiI 6708 line was conspicuous in their spectrum or some evidence of youth (strong X-ray emission, infrared excess) could be found in the literature. Strong Li I absorption in low resolution spectra alone is not sufficient criterion of the PMS nature, given that blending with several neighboring lines may result in a large apparent equivalent width. Therefore we regard the M-type stars whose EW(H) 10 Å, and EW(Li I) 0.4 Å, candidate weak-line T Tauri stars (WTTS) (cf. Tachihara et al., 2005). Earlier (G and K) spectral types need lower EW(H) for the CTTS classification. Our input list contains a few A- and F-type stars, whose candidate PMS status is based on their IRAS associations and which display H in absorption, but EW(H) is lower than the value characteristic of the spectral type, suggesting that the photospheric absorption is partly filled by emission. We regard these stars candidate Herbig Ae stars. According to the above criteria, 77 of the observed 170 stars have shown spectra characteristic of pre-main sequence stars. These stars are listed in Table Pre-main sequence stars in the Cepheus flare region. The observed stars rejected as PMS objects are listed in Table Pre-main sequence stars in the Cepheus flare region. We show examples of non-PMS stars from the candidate list by Kun (1998) in Fig. 1.
The spectra of the stars listed in Table Pre-main sequence stars in the Cepheus flare region are shown in Figs. 2–4. Figure 2 shows the spectra of the PMS stars, normalized to the continua, observed with CAFOS+R–100. Fig. 3 shows those observed with CAFOS+G–100. The FAST spectra of stars classified as PMS objects, normalized to the value of the continuum at 6560 Å, are shown in Fig. 4. The insets show the shape of the H line in more detail, i.e. the section of the spectrum between 6545 and 6580 Å. The vertical size of the enlarged section is scaled to the peak intensity of the line.
Results of the spectroscopic observations are presented in Tables 3 and 4. The instruments of observation, the derived spectral types, the type of the H emission line shape, according to the scheme introduced by Reipurth, Pedrosa & Lago (1996), and a list of further emission lines identified in the spectra are listed in Table 3. We show in Table 4 the equivalent widths of the H, Li I, and Ca II infrared triplet lines in Å, as well as v(10%), the width of the H line 10% above the continuum, deconvolved by the response of the instrument, in km s-1. Whereas Li I is an important indicator of youth, EW(H), EW(Ca II 8542), and v(10%) are used as accretion indicators (Muzerolle et al., 1998; Natta et al., 2004; Dahm, 2008). The equivalent widths were determined by fitting a Gaussian or multiple Gaussians to the lines using the IRAF task ‘splot’. The uncertainties, derived from repeated measurements, are about 10%. The real uncertainties of the Li I equivalent widths may be higher due to the blending of the line with neighboring Fe I lines (at 6703.5, 6705.1, 6707.4, and 6710.3 Å). We used the ‘deblend’ command of the ‘splot’ task of IRAF to separate the Li I line from the Ca I 6718 and [S II] 6717 lines. The last column of Table 4 shows the PMS type of the object, based on our data.
2.3 photometry
Photometric observations in the bands of the young stars identified by our spectroscopic observations were undertaken during one night in 2004 December, two nights in 2005 June, and eight nights in 2006 September and October using the 1-m RCC-telescope of the Konkoly Observatory. We used a Princeton Instruments VersArray:1300B camera, that utilizes a back-illuminated, 13001340 pixel Roper Scientific CCD. The pixel size is 20 m, corresponding to 0.31 arcsec on the sky. Integration times were between 30 s and 600 s. To calibrate the photometry we observed the open cluster NGC 7790 several times each night, at various airmasses, as well as NGC 188 once each night. We reduced the images in IRAF. After bias subtraction and flatfield correction PSF-photometry was performed using the ‘daophot’ package. The field of view, 6.76.9 arcmin, contained several stars suitable for establishing the point spread function of the images. The transformation formulae between the instrumental and standard magnitudes and color indices as a function of the airmass were established each night by measuring the instrumental magnitudes of some 80 photometric standard stars published by Stetson (2000) for NGC 7790 and 40 stars in NGC 188. Each target was observed at least twice, on two different nights, and several stars on three or more nights. The photometric errors, obtained as quadratic sums of the formal errors of the instrumental magnitudes and those of the coefficients of the transformation equations are about mag for stars brighter than about 16th mag, and about mag for the fainter stars.
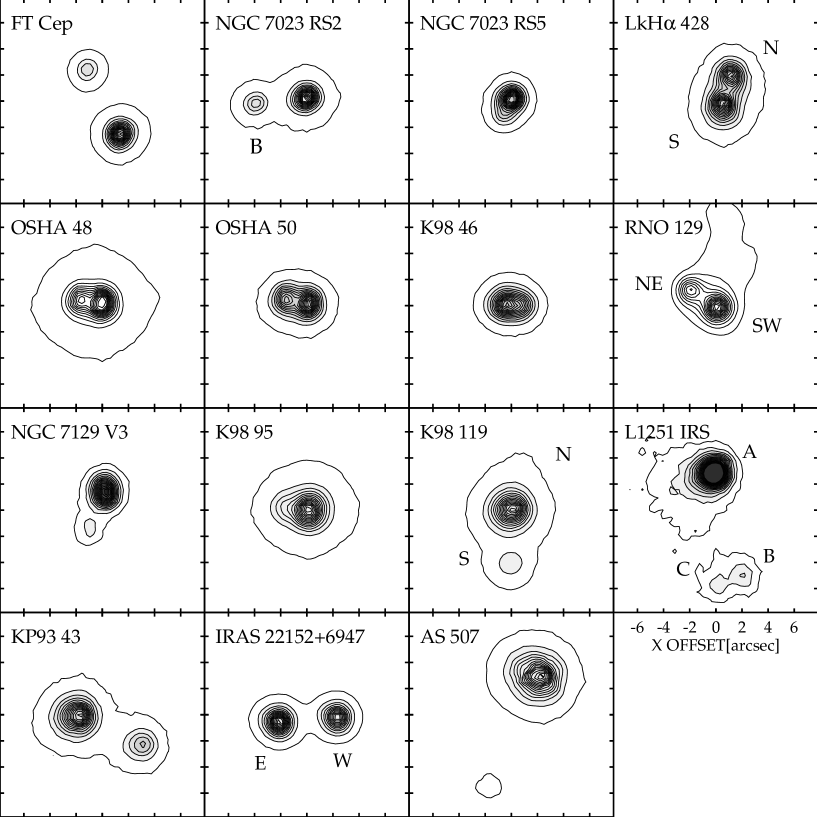
The results of the photometry are presented in Table 5. The magnitudes listed are averages of 2–4 independent measurements. In several cases magnitude differences well above the formal errors, indicative of variability, were detected. We show in parentheses the mean absolute deviation of the magnitudes, and indicate the variability in Col. 6. During the psf photometry faint visual companions were revealed near some objects. We designate these stars in Table 5 by adding a letter to the name of the primary, and give the angular distance from the primary and the position angle in Col. 6 of Table 5. Figure 5 shows the images of the visual double stars observed.
2.4 Infrared archive data
We supplemented our observational data with the near infrared data of the 2MASS All Sky Catalog (Cutri et al., 2003) and the far-infrared data of the IRAS PSC (IPAC, 1988) and FSC (Moshir et al., 1990). One of the target stars, LkH 425, is not included in the 2MASS point source catalog. A nonstellar object (artifact?) appears in the 2MASS images next to this star. We took JHK photometric data for this star from Sellgren (1983).
Spitzer IRAC and MIPS fluxes are available for parts of L 1228 and L 1251, as well as for RNO 124 and RNO 129 in the c2d data archive (Evans et al., 2003)222http://data.spitzer.caltech.edu/popular/c2d/20071101_enhanced_v1/. NGC 7129 was observed by IRAC and MIPS as part of the Spitzer young stellar cluster survey (Gutermuth et al., 2009). Four cluster members included in the Spitzer survey are common with our targets. The magnitudes of these stars are listed in Table 4 of Gutermuth et al. (2009). IRAC and MIPS photometric data for NGC 7023 are presented in Kirk et al. (2009). All of our program stars in NGC 7023 but SX Cep are included in their Table 6. The identifiers of our stars in both papers are shown in Col. 4 of Table Pre-main sequence stars in the Cepheus flare region.
To obtain IRAC and MIPS 24 m photometric data for SX Cep we downloaded the basic calibrated data (BCD) frames processed with the SSC IRAC Pipeline v14.0 for Prog ID 30574 and created mosaics from the BCD frames using a custom IDL program. For details see Gutermuth et al. (2008). Aperture photometry was carried out using PhotVis version 1.10 which is an IDL-GUI based photometry visualization tool. See Gutermuth et al. (2004) for further details on PhotVis. The radii of the source aperture, and of the inner and outer boundaries of the sky annulus were 2.4, 2.4 and 7.2 arc-second respectively. For MIPS the frames were processed using the MIPS Data Analysis Tool (Gordon et al., 2005). PSF fitting in the IRAF/DAOPHOT package was used to obtain the following photometry for SX Cep: , , , , .
3 Results
3.1 Visual binaries, spectroscopic and photometric variability
Figure 5 shows the images of the visual double stars detected during our observations. Photometry was performed separately for the components, whereas we observed only the spectrum of the brighter component of FT Cep, NGC 7023 RS 5, OSHA 50, [K98c] Em* 46, NGC 7129 S V3, [K98c] Em* 95, and AS 507. The uncertainty ellipse of IRAS 22152+6947 contained two nearly equally bright stars separated by 44. The eastern component is a G2 dwarf, while the western component is an F5 star with weak H emission. We include the F5 star in our final list of PMS stars. Our observations find RNO 129, OSHA 48, LkH 428, and [K98c] Em* 119 to be new binary T Tauri stars.
Variability of several stars has already been established (e.g. Rosino & Romano, 1962; Shevchenko & Yakubov, 1989; Grankin et al., 2007). We observed strong night-to-night variation of FT Cep and most of the stars in L 1251. Spectra of some stars were observed at more than one epoch, and significant variations were found in the equivalent width of the H line in some cases. Figure 6 shows the three most conspicuous cases.
3.2 Surface distribution of the PMS stars
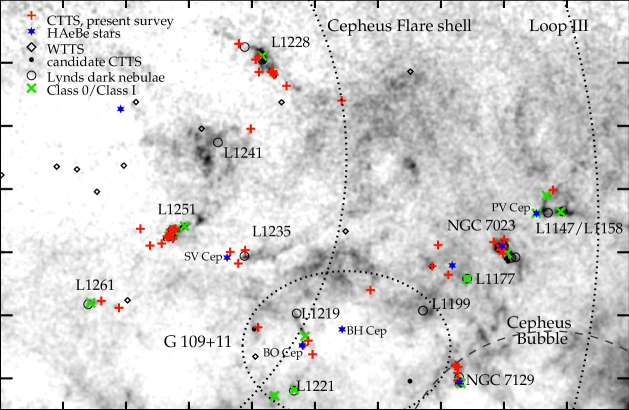
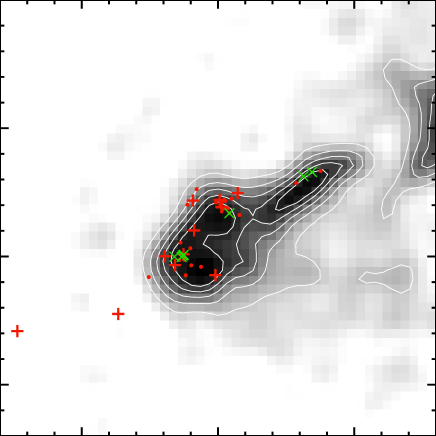
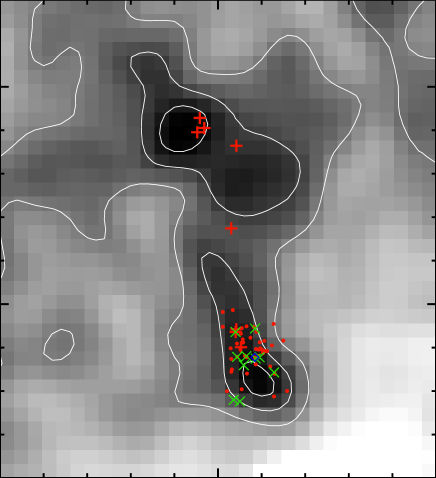
Figure 7 shows the distribution of the PMS stars overplotted on the extinction map of the region published by Dobashi et al. (2005). In addition to our target stars, known Class I objects, Herbig Ae/Be stars and WTTSs are also indicated. Dotted lines indicate the nominal boundaries of the Cepheus flare Shell (Olano et al., 2006), a section of Loop III, and the far-infrared loop G 109+11 (Kiss et al., 2004). The dashed line shows a section of the Cepheus Bubble, located at some 800 pc, and possibly associated with NGC 7129 (Ábrahám et al., 2000). For better visibility, parts of the map centered on NGC 7023, L 1228, L 1251, and NGC 7129 are shown enlarged in Figs. 8–11.
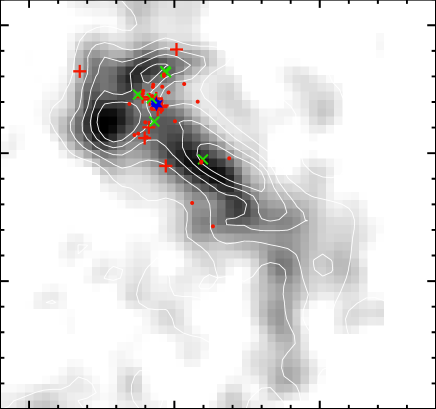
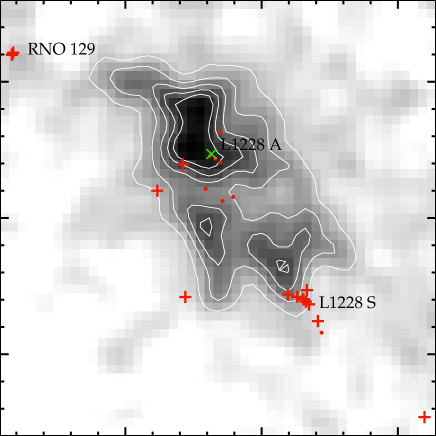
The clusters of young stars are concentrated near the edges of the cloud complex, and avoid the central part of the region. All known star forming clouds but L 1221 are associated with optically visible young stars. L 1172/L 1174 displays head–tail structure, with the optically visible cluster in the head, indicative of star formation propagating from higher towards lower Galactic longitudes. The 13 stars associated with L 1228 (Fig. 9) apparently belong to three small aggregates: L 1228 S (Padgett et al., 2004), L 1228 A (Bally et al., 1995), and RNO 129 (Movsessian & Magakian, 2004). Most of the young stars of L 1251 form two small clusters, associated with two dense C18O cores, L 1251 C and L 1251 E (Sato et al., 1994). On-going star formation has been observed in both cores (e.g. Beltrán et al., 2001; Reipurth et al., 2004; Lee et al., 2006, 2007; Kirk et al., 2009). The strong X-ray source [KP93] 2-43 (Simon, 2006) is projected on a lower density part of the cloud between the two cores. The cometary shape of L 1251, and the presence of three PMS stars on its high longitude side suggest star formation propagating from the higher towards the lower Galactic longitudes. Two CTTSs and a WTTS are projected near L 1261. The extinction map of the NGC 7129 region, displayed in Fig. 11 shows that its associated cloud, L 1181 contains two star-forming clumps. The cluster is embedded in the low-latitude clump, whereas V391 Cep and four newly confirmed CTTSs (NGC 7129 S V1–V3, and [K98c] Em* 72) are associated with another clump at the high-latitude part of the cloud.
In addition to the clusters associated with known star-forming clouds, PMS stars can be found widely scattered at the low-latitude side of the region, between L 1177 and L 1219, apparently along the periphery and inside of the shell G 109+11. A small group can be seen close to L 1235 and SV Cep. The A1 type H emission star coinciding with IRAS 22219+7901 (TYC 4608-2063-1), and a group of WTTSs are projected on the cleared central region of the CFS.
3.3 Line-of-sight distribution of the PMS stars
Various distance values can be found in the literature for the star forming clouds of the Cepheus flare. A comprehensive table of published distance estimates is presented in Table 3 of Kun et al. (2008). We adopt the distances for the clouds and the associated PMS stars listed in Table 6.
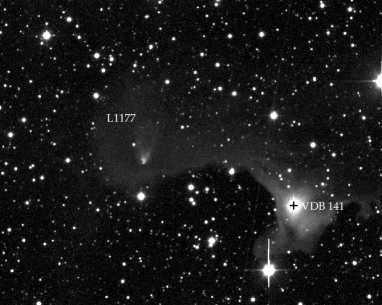
The distances of PMS stars far from the known star forming clouds require further consideration. A small aggregate can be found around , close to the star forming cloud L 1177. The members of this group are [K98c] Em* 53, [K98c] Em* 58, 2MASS 21225427+6921345, the HAe star BD +68°1118, and a candidate PMS star, 2MASS 21223461+6921142. We estimated the distance of this aggregate by the assumption that BD +68°1118 is a member and lies on the ZAMS. This assumption results in a distance of 390 pc. The star BD +67°1300 (VDB 141) illuminates part of the L 1177 dark cloud (see Fig. 12), and provides us another distance estimate. Our FAST spectrum for BD +67°1300 indicates a spectral type of K0III. The absolute magnitudes of K0 giants, tabulated by Wainscoat et al. (1992), together with the photometric data of BD +67°1300 and its associated 2MASS source, found in the NOMAD333http://www.nofs.navy.mil/nomad catalogue, result in a distance pc. The large dispersion of the absolute magnitudes of K giants, (Wainscoat et al., 1992), corresponds to a 1 range of distances of . We derive the luminosities of the stars near L 1177 using a distance of 390 pc. This value is close to the distance of L 1219/B 175, surrounded by a group of PMS stars (BH Cep, BO Cep, IRAS 22129+6949, IRAS F22144+6923, IRAS 22152+6947, [K98c] Em* 119, [TNK2005] 37 (Tachihara et al., 2005)). We assume that these stars are associated with L 1219 at 400 pc. The candidate PMS star 2MASS 22283821+7119023 is probably a further member of this group. Both L 1177 and L 1219 are bordered by a high density rim on the low-latitude side (cf. Bally & Reipurth, 2001, see also Fig. 12), indicative of shocks propagating from the direction of low Galactic latitudes. Their similar morphologies and distances suggest that both clouds and the associated star formation may be influenced by the large Galactic shell G 109+11 (Kiss et al., 2004). Therefore we refer to this group of PMS stars as the G 109+11 association.
Another small aggregate ([K98c] Em* 95, 108, and 109) can be seen projected near the HAe star SV Cep, and at the same time close to the head of the starless dark cloud L 1235. Whereas L 1235 is situated at 300 pc (Kun et al., 2008), SV Cep is much more distant (715 pc: Friedemann et al. 1992; pc: Kun et al. 2000; pc: Montesinos et al. 2009). Plotting these stars in the HRD with a distance of 300 pc, we obtain ages between 10 and 20 million years, inconsistent with typical CTTSs. Assuming that the stars are as distant as SV Cep (600 pc), we estimate ages of 1–5 Myr, similar to that of SV Cep (Montesinos et al., 2009). Therefore we assume that these stars formed in the same cloud as SV Cep.
We assume that the apparently isolated stars IRAS 20535+7439 and RNO 135 belong to the cloud complex at 300 pc, and [K98c] Em* 73 is a member of the G 109+11 association at 400-pc. We have no guideline for finding the distance and luminosity of IRAS 22219+7901. If we assume that it is a main sequence star, we estimate a distance of 1.3 kpc.
3.4 Interstellar extinction and luminosities
We derived the interstellar extinction suffered by the program stars from their and color excesses. The unreddened color indices of the spectral types were adopted from Kenyon & Hartmann (1995). We determined from both color excesses independently, using Cardelli et al.’s (1989) extinction law with , and then accepted the average of both values as the visual extinction of the star. For visual binaries that are resolved in our optical images, but unresolved in 2MASS, we used only to determine . We corrected the observed magnitudes using the relations according to the same extinction law. The extinction law with proved inadequate in the case of the most heavily reddened stars, above mag: the unreddened SEDs of these stars over the V–J region poorly fitted the shape of the photospheric SED. Therefore we rederived the extinctions of these stars using , using the relations given by Cardelli et al. (1989). gave definitely better results for most of the lightly reddened stars: for instance, in L 1251 we used for [KP93] 2-1, 46, [KP93] 3-10, [RD95] A, [RD95] B, and [ETM94] Star 3, and for the other members. Exceptions are the apparently lightly reddened stars associated with small reflection nebulae or exhibiting Class I SEDs, namely NGC 7023 RS 10, [K98c] Em*58, and [K98c] Em*119. The apparently low reddening of these stars results from the contribution of scattered light to their color indices. We corrected their fluxes for the extinction using . The difference between the two values, derived from and , allowed us to estimate the uncertainty as mag. Bolometric magnitudes were derived by applying the bolometric corrections, , tabulated by Hartigan et al. (1994). Effective temperatures of the spectral types were adopted from Kenyon & Hartmann (1995). Luminosities were derived using the distances listed in Table 6. The and values are listed in Table 7.
3.5 Hertzsprung–Russell diagrams
The Hertzsprung–Russell diagrams of the pre-main sequence stars are plotted in Figs. 13–17, separately for L 1228, NGC 7023, L 1251, and NGC 7129. The G 109+11 association, the stars associated with L 1155/L 1157, SV Cep, and L 1261, as well as the isolated stars IRAS 20535+7439 and RNO 135 are plotted with varied symbols in Fig. 17. Since we could not find absorption features suitable for spectral classification in the spectrum of PV Cep, we accepted a spectral type of K0, reported by Magakian & Movsessian (2001). Evolutionary tracks and isochrones, as well as the position of the birthline and zero-age main-sequence (Palla & Stahler, 1999) are also shown. Masses and ages, derived from these diagrams, are listed in Table 7.
3.6 Accretion signatures
Both the emission spectra and the shape of the SED carry information on the mass accretion rate from the disk onto the star. The accretion rates of our PMS stars were estimated from the H line width using the formula of Natta et al. (2004), and from the H and Ca II luminosities using the formulae of Dahm (2008). Since our spectra are not flux calibrated, we derived the emission line luminosities from the equivalent widths, using the extinction-corrected and magnitudes for determining the underlying stellar flux for the H and Ca II lines, respectively. In order to convert the luminosity to accretion rate according to the relationship
| (1) |
we took the stellar mass, , and radius, from the HRD, and adopted for the inner radius of the gaseous disk (Gullbring et al., 1998). The accretion rates, , obtained from the H and Ca II 8542 Å lines are listed in Table 7.
Figure 18 shows the relationship between the accretion rates, , resulted from and , respectively. Given the empirical nature of both relationships the large scatter is not surprising. An additional source of uncertainty of the results is that our spectroscopic and photometric observations were obtained at different epochs. We notice that for stars exhibiting double-peaked H emission line accretion rates derived from are systematically larger than those derived from . Double-peaked H lines (Types II and III in Table 3) have among the strongest emission lines in the sample. All but one ([K98c] Em* 109) belong to the types IIB or IIIB, i.e. the absorption dip is on the blue side of the main peak, indicating the contribution of wind to the line shape. A reason for the discrepancy may be that, due to the absorption by the wind, the peak of the H emission is lower than it would be without the contribution of wind. Thus the effects of the wind are a smaller equivalent width and, since the 10% level of the peak is also lower, a larger line width at this level. We also note that the H lines of these stars are wider than those used by Natta et al. (2004) for calibrating the relationship. Accretion rates derived from and are consistent with each other according to Fig. 19. We note, however, that there is a large scatter in from Ca II at fixed from H, thus we cannot state that there is a 1:1 relation between them.
We examined the dependence of accretion rate on stellar mass. Figure 20 shows the result. The accretion rates plotted are averages of both methods derived from the H emission line. The line fitted to the data is , compatible with similar relationships found for other nearby star forming regions (; Natta et al., 2006; Herczeg & Hillenbrand, 2008). The correlation, however, is rather weak: the Pearson correlation coefficient is 0.48. The large scatter of this plot (exceeding three orders of magnitude at a fixed ) partly originates from plotting together stars of several regions, having different ages and accretion histories. For instance, most of the (older) dispersed stars appear below the fitted line, whereas the stars of L 1251 show higher accretion rates than the average. However, no clear dependence of on the stellar age can be found in our data set. As Tilling et al. (2008) pointed out, biases are hard to remove in quantifying the vs. relation.
3.7 Spectral energy distributions
The optical, near- and mid-infrared parts of the spectral energy distributions (SEDs) of the programme stars were constructed using all available photometric data, each corrected for the interstellar extinction. The fluxes corresponding to zero magnitude were obtained from Glass (1999) for the bands, and from the 2MASS All Sky Data release web document444 for the bands. IRAS fluxes are also plotted when available. IRAS fluxes of 2MASS 21225427+6921345 were obtained by Scanpi555http://scanpiops.ipac.caltech.edu:9000/applications/Scanpi/index.html. The resulting SEDs are shown in Figs. 21–25, separately for the clusters/aggregates of the region. Photospheric SEDs have been drawn by dashed lines. Their values were determined from the dereddened magnitudes, and from the color indices corresponding to the spectral types. We also plotted for comparison the median SED of the T Tauri stars of the Taurus star forming region (D’Alessio et al., 1999), the best-studied sample population of 1–2 Myr old low-mass stars.
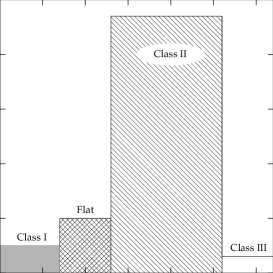
The shape of the SED allows us a qualitative classification of the circumstellar environment of the young stars. According to the slope between 2 and 24 µm, , Class I (), Flat (), Class II (), and Class III () YSOs are distinguished (Lada, 1991; Evans et al., 2009). Class I infrared sources are probably among the youngest PMS stars, close to the end of the main accretion phase of their evolution. Their circumstellar environment is composed of a disk and an envelope. Class II sources are CTTSs surrounded by optically thick accretion disks, and the low infrared excesses of Class III stars originate from optically thin disks.
Four stars, namely PV Cep, NGC 7023 RS 10, [K98c] Em* 58, and GGD 33a exhibit SEDs characteristic of Class I objects. The luminosities of these stars, derived from the optical observations, are very low, indicating that we observe the light of these stars scattered from edge-on disk or envelope. The underestimated luminosity is also reflected in the discrepancy between the accretion rates obtained from and . PV Cep and GGD 33a are associated with Herbig–Haro objects (Gómez, Whitney, & Kenyon, 1997; Eiroa, Gómez de Castro, & Miranda, 1992), suggesting that they are probably real Class I objects, embedded in massive envelopes. The small reflection nebula associated with NGC 7023 RS 10 may also be an indicator of the envelope. The nature of [K98c] Em* 58 is uncertain. It may either be an edge-on disk or an unresolved binary system. The histogram of for our stars is shown in the left panel of Fig. 26. Five percent of the studied stars belong to the Class I, 13% exhibit Flat SEDs, 60% are Class II, 3% Class III, and 18% (14 stars) remain unclassified due to the lack of both 24 and 25 µm fluxes.
Cieza et al. (2007) introduced a two-dimensional way of classification of SEDs, based on , the longest wavelength at which the observed SED is photospheric, and , the slope of the SED for . µm may indicate accreting stars, with the inner edge of the disk at the dust sublimation radius. SEDs with in the IRAC wavelength range may result from more evolved, purely irradiated disks with inner holes. The right panel of Fig. 26 shows the histogram of for our target stars. We found for some 45% of the studied objects, while cannot be determined for 22% due to the lack of IRAC data. These stars obviously have µm. Thus slightly less than half of our studied stars exhibit near-infrared excesses. Remarkably SEDs of various shape (cf. Evans et al., 2009) occur in each small cluster of the region. For instance, we find both Flat SEDs (KP93 2-2) and transitional/annular disks (KP93 2-3) in L 1251, and both Class I (NGC 7023 RS 10) and purely photospheric (HZ Cep) SEDs in NGC 7023. On the contrary, the seven observed SEDs of L 1228 S are less diverse: none of them show NIR excess, indicating either evolved disks, or star forming conditions different from those in the other parts of the region.
4 Discussion
4.1 Distribution of stellar and disk properties
Figure 27 shows the histogram of the effective temperatures and masses, derived from the HRD, and mass accretion rates, derived from the H line (average from both methods). It is apparent that due to the magnitude limit of our observations spectral types later than about M2, and masses lower than about 0.2 M☉ are largely missing from our sample. Comparison of the mass distribution with the shape of the Salpeter IMF shows that the incompleteness of our sample starts at around 0.5 M☉. The median mass of the observed stars is 0.8 M☉. The median accretion rate for our sample, derived from the H emission line, is M☉/yr. Gullbring et al. (1998) measured a median accretion rate of M☉/yr for 17 CTTSs in Taurus, and Natta et al. (2006) measured a median accretion rate of M☉/yr for 43 members of Oph (upper limits excluded). These figures show that our target selection resulted in a limited interval of effective temperatures and masses, and in the detection of the most actively accreting members of the population. Median stellar parameters, as well as median and for various parts of the Cepheus flare are summarized in Table 8.
4.2 A possible origin of star formation in the Cepheus flare
The CFS/Loop III system may represent a link between the apparently distinct star forming clouds (Olano et al., 2006; Kun, 2007). L 1147/L 1158 and NGC 7023 are located outside the CFS, but close to the periphery of Loop III. The giant, nearly concentric shells are suggestive that multiple supernova explosions occurred inside the Cepheus void, that is, the presence of OB stars there in the past few million years. Looking for the remnants of such an association we find the small R-association consisting of the classical Cepheid SU Cas and a small group of A and B type stars at a distance of 258 pc (Turner & Evans, 1984). We have no sufficient data for deciding whether this small group is a remnant of a large OB association. The G 109+11 association at 400-pc may result from a star formation event due to the impact of the shell G 109+11 6–7 million years ago. The expansion of the shell towards higher latitudes might have triggered star formation in L 1177. The 50-Myr old association Cep OB6 at a distance of 300 pc and towards low-latitudes from the Cepheus flare may be the source of the shell (Bally & Reipurth, 2001).
5 Conclusions
From spectroscopic and photometric observations, we estimated the effective temperatures and luminosities of 78 PMS stars in the Cepheus flare region, 65 of which are newly confirmed PMS stars. Comparing the results with pre-main sequence evolutionary models we estimate stellar masses of 0.2–2.4 M☉ and stellar ages of 0.1–15 Myr. From archival IRAS, 2MASS, and Spitzer data, we constructed the spectral energy distributions; 5% of the stars are Class I, 5% Flat, 81% Class II, and 9% Class III.
Star forming clouds and PMS stars of the region belong to the complexes as follows.
-
•
Star formation associated with the large expanding system of Cepheus flare Shell/Loop III occurs in the clouds L 1148/L 1158, L 1172/L 1174, L 1251, L 1228 and L 1261/L 1262. The latter two clouds are located on the approaching side of the expanding shell.
-
•
A sparse association consisting of 6–7 Myr old PMS stars at the low-latitude part of the region (, ) can be found at a distance of 380–400 pc. The shapes of the clouds in this part of the region suggest shocks from the direction of the Galactic plane.
-
•
Low-mass PMS stars are associated with the Herbig Ae star SV Cep, located at 600 pc.
-
•
NGC 7129, at 800 pc from the Sun, is probably associated with the Cepheus Bubble, created by the older subgroup of the association Cep OB2. Stars have been formed in at least two clumps of its natal cloud L 1181.
The A1-type H emission star associated with IRAS 22219+7901 is probably more distant than the Cepheus flare clouds. Its nature remains uncertain.
References
- Ábrahám et al. (2000) Ábrahám, P., Balázs, L. G., & Kun, M. 2000, A&A, 354, 645
- Balázs et al. (2004) Balázs, L. G., Ábrahám, P., Kun, M., et al. 2004, A&A, 425, 133
- Bally et al. (1995) Bally, J., Devine, D., Fesen, R. A., & Lane, A. P. 1995, ApJ, 454, 345
- Bally & Reipurth (2001) Bally, J., & Reipurth, B. 2001, ApJ, 552, L159
- Balog & Kenyon (2002) Balog, Z., & Kenyon, S. J. 2002, AJ, 124, 2083
- Barrado y Navascués & Martín (2003) Barrado y Navascués, D., & Martín, E. L. 2003, AJ, 126, 2997
- Beltrán et al. (2001) Beltrán, M. T., Estalella, R., Anglada, G., et al. 2001, AJ, 121, 1156
- Berkhuijsen (1973) Berkhuijsen, E. M. 1973, A&A, 24, 143
- Le Borgne et al. (2003) Le Borgne, J.-F., Bruzual, G., Pello, R., et al. 2003, A&A, 402, 433
- Cardelli et al. (1989) Cardelli, J. A., Clayton, G. C., & Mathis, J. S. 1989, ApJ, 345, 245
- Cieza et al. (2007) Cieza, L., Padgett, D. L., Stapelfeldt, K. R. et al. 2007, ApJ, 667, 308
- Clemens & Barvainis (1988) Clemens, D. P., & Barvainis, R. 1988, ApJS, 68, 257
- Cohen & Kuhi (1979) Cohen, M., & Kuhi, L. V. 1979, ApJS, 41, 743
- Cutri et al. (2003) Cutri, R. M., Skrutskie, M. F. van Dyk, S. et al. 2003, VizieR On-line Data Catalog: II/246
- Dahm (2008) Dahm, S. E. 2008, AJ, 136, 521
- D’Alessio et al. (1999) D’Alessio, P., Calvet, N., Hartmann, L., et al. 1999, ApJ, 527, 893
- Dobashi et al. (2005) Dobashi, K., Uehara, H., Kandori, R., et al. 2005, PASJ, 57, S1
- Dullemond et al. (2006) Dullemond, C. P., Natta, A., & Testi, L. 2006, ApJ, 645, L69
- Eiroa et al. (1992) Eiroa, C., Gómez de Castro, A. I., & Miranda, L. F. 1992, A&AS, 92, 721
- Eiroa et al. (1994) Eiroa, C., Torrelles, J. M., Miranda, L. F., Anglada, G., & Estalella, R. 1994, A&AS, 108, 73
- Eredics & Kun (2003) Eredics, M., & Kun, M. 2003, Comm. Konkoly Obs., 13, 27
- Evans et al. (2009) Evans, N., Calvet, N., Cieza, L. et al. 2009, arXiv:0901.1691
- Evans et al. (2003) Evans, N. J., II, Allen, L. E., Blake, G. A., et al. 2003, PASP, 115, 965
- Fabricant et al. (1998) Fabricant, D., Cheimets, P., Caldwell, N., & Geary, J. 1998, PASP, 110, 79
- Friedemann et al. (1992) Friedemann, C., Reimann, H.-G., & Gürtler, J. 1992, A&A, 255, 246
- Glass (1999) Glass, I. S. 1999, Handbook of Infrared Astronomy, Cambridge Univ. Press, p. 63
- Gómez et al. (1997) Gómez, M., Whitney, B. A., & Kenyon, S. J. 1997, AJ, 114, 1138
- Gordon et al. (2005) Gordon, K. D., et al. 2005, PASP, 117, 503
- Grankin et al. (2007) Grankin, K. N., Melnikov, S. Y., Bouvier, J., et al. 2007, A&A, 461, 183
- Grenier et al. (1989) Grenier, I. A., Lebrun, F., Arnaud, M., Dame, T. M., & Thaddeus, P. 1989, ApJ, 347, 231
- Gullbring et al. (1998) Gullbring, E., Hartmann, L., Briceño, C., & Calvet, N. 1998, ApJ, 492, 323
- Gutermuth et al. (2004) Gutermuth, R. A., Megeath, S. T., Muzerolle, J., et al. 2004, ApJS, 154, 374
- Gutermuth et al. (2008) Gutermuth, R. A., Myers, P. C., Megeath, S. T. et al. 2008, ApJ, 674, 336
- Gutermuth et al. (2009) Gutermuth, R. A., Megeath, S. T., Myers, P. C., Allen, L. E., Pipher, J. L., & Fazio, G. G. 2009, ApJS, 184, 18
- Hartigan et al. (1994) Hartigan, P., Strom, K. M., & Strom, S. E. 1994, ApJ, 427, 961
- Heiles (1967) Heiles, C. 1967, ApJS, 15, 97
- Herbig & Bell (1988) Herbig, G. H., & Bell, K. R. 1988, Lick Obs. Bull. No. 1111 (Santa Cruz: Lick Obs.)
- Herczeg & Hillenbrand (2008) Herczeg, G. J., & Hillenbrand, L. A. 2008, ApJ, 681, 594
- Hester & Desch (2005) Hester, J. J., & Desch, S. J. 2005, in: Chondrites and the Protoplanetary Disk, Ed. A. N. Krot, E. R. D. Scott, and Bo Reipurth, ASP Conf. Ser., 341, 107
- Hubble (1934) Hubble, E. 1934, ApJ, 79, 8
- Jaschek & Jaschek (1987) Jaschek, C., & Jaschek, M. 1987, The Classification of Stars, Cambridge Univ. Press
- IPAC (1988) Joint IRAS Science W.G. 1988, IRAS Catalog of Point Sources, Version 2.0, NASA RP-1190
- Kenyon & Hartmann (1995) Kenyon, S. J., & Hartmann, L. 1995, ApJS, 101, 117
- Kirk et al. (2009) Kirk, J. M., Ward-Thompson, D., Di Francesco, J., Bourke, T. L., Evans II, N. J., et al. 2009, ApJS, submitted (arXiv:0903.4063)
- Kirkpatrick, Henry & McCarthy (1991) Kirkpatrick, J. D., Henry, T. J., & McCarthy, D. W. 1991, ApJS, 77, 417
- Kiss et al. (2004) Kiss, Cs., Moór, A., & Tóth, L. V. 2004, A&A, 418, 131
- Kun (1998) Kun, M. 1998, ApJS, 115, 59
- Kun (2007) Kun, M. 2007, Proc. IAU Symp. 237, Triggered Star Formation in a Turbulent ISM, Ed. B. G. Elmegreen and J. Palous, Cambridge Univ. Press, p. 119
- Kun et al. (2008) Kun, M., Kiss, Z. T., & Balog, Z. 2008, Handbook of Star-Forming Regions, ed. B. Reipurth (San Francisco: ASP), Vol. 1, p. 134
- Kun & Prusti (1993) Kun, M. & Prusti, T. 1993, A&A, 272, 235
- Kun et al. (2000) Kun, M., Vinkó, J. & Szabados, L. 2000, MNRAS, 319, 777
- Lada (1991) Lada, C. J. 1991, in: The Physics of Star Formation and early Stellar Evolution, eds. C.J. Lada & N. D. Kylafis, Kluwer, p. 329
- Lebrun (1986) Lebrun, F. 1986, ApJ, 306, 16
- Lee et al. (2006) Lee, J.-E., Di Francesco, J., Lai, S. P. et al. 2006, ApJ, 648, 491
- Lee et al. (2007) Lee, J.-E., Di Francesco, J., Bourke, T. L., et al. 2007, ApJ, 671, 1748
- Lynds (1962) Lynds, B. T. 1962, ApJS, 7, 1
- Magakian & Movsessian (2001) Magakian, T. Yu. & Movsessian, T. A. 2001, Astrophysics, 44, 419
- Magakian et al. (2004) Magakian, T. Yu., Movsessian, T. A., & Nikogossian, E. H. 2004, Astrophysics, 47, 519
- Martín & Kun (1996) Martín, E. L., & Kun, M. 1996, A&AS, 116, 467
- Meehan et al. (1998) Meehan, L. S. G., Wilking, B. A., Claussen, M. J., et al. 1998, AJ, 115, 1599
- Miranda et al. (1993) Miranda, L. F., Eiroa, C. & Gómez de Castro, A. I. 1993, A&A, 271, 564
- Miranda et al. (1994) Miranda, L. F., Eiroa, C., Fernández, M., & Gómez de Castro, A. I. 1994, A&A, 281, 864
- Monnier et al. (2006) Monnier, J. D., Berger, J.-P., Millan-Gabet, R., et al. 2006, ApJ, 644, 444
- Montesinos et al. (2009) Montesinos, B., Eiroa, C., Mora, A., & Merín, B. 2009, A&A, 495, 901
- Mora et al. (2001) Mora, A., Merín, B., Solano, E., et al. 2001, A&A, 378, 116
- Moshir et al. (1990) Moshir, M., Copan, G., Conrow, T., et al. 1990, IRAS Faint Source Catalogue, version 2.0,
- Movsessian & Magakian (2004) Movsessian, T. A., & Magakian, T. Yu. 2004, Astron. Rep., 48, 988
- Muzerolle et al. (1998) Muzerolle, J., Hartmann, L., & Calvet, N. 1998, AJ, 116, 453
- Natta et al. (2004) Natta, A., Testi, L., Muzerolle, J., et al. 2004, A&A, 424, 603
- Natta et al. (2006) Natta, A., Testi, L., & Randich, S. 2006, A&A, 452, 245
- Ogura & Sato (1990) Ogura, K. & Sato, F. 1990, PASJ, 42, 583
- Olano et al. (2006) Olano, C. A., Meschin, P. I., & Niemela, V. S. 2006, MNRAS, 369, 867
- Padgett et al. (2004) Padgett, D. L., Rebull, L. M., Noriega-Crespo, A., et al. 2004, ApJS, 154, 433
- Page et al. (2007) Page, L., Hinshaw, G., Komatsu, E., et al. 2007, ApJS, 170, 335
- Palla & Stahler (1999) Palla, F., & Stahler, S. W. 1999, ApJ, 525, 772
- Preibisch, Guenther, & Zinnecker (2001) Preibisch, T., Guenther, E., & Zinnecker, H. 2001, AJ, 121, 1040
- Racine (1968) Racine, R. 1968, AJ, 73, 233
- Reipurth et al. (1996) Reipurth, B., Pedrosa, A., & Lago, M. T. V. T. 1996, A&AS, 120, 229
- Reipurth et al. (2004) Reipurth, B., Rodríguez, L. F., Anglada, G., & Bally, J. 2004, AJ, 127, 1736
- Rosino & Romano (1962) Rosino, L., & Romano, G. 1962, Asiago Contrib. 127
- Rosvick & Davidge (1995) Rosvick, J. M., & Davidge, T. J. 1995, PASP, 107, 49
- Sato et al. (1994) Sato, F., Mizuno, A., Nagahama, T., et al. 1994, ApJ, 435, 279
- Schaefer (1986) Schaefer, B. E. 1986, ApJ, 307, 644
- Semkov (1993) Semkov, E. H. 1993, IBVS, 3918
- Sellgren (1983) Sellgren, K. 1983, AJ, 88, 985
- Semkov (2003) Semkov, E. H. 2003, IBVS, 5406
- Shevchenko & Yakubov (1989) Shevchenko, V. S., & Yakubov, S. D. 1989, Soviet Ast., 33, 370
- Shevchenko et al. (1989) Shevchenko, V. S., Ibragimov, M. A., & Yakubov, S. D. 1989, Soviet Ast., 33, 487
- Simon (2006) Simon, T. 2006, AJ, 131, 501
- Spoelstra (1973) Spoelstra, T. A. Th. 1973, A&A, 24, 149
- Stetson (2000) Stetson, P. B. 2000, PASP, 112, 925
- Straizys et al. (1992) Straizys, V., Cernis, K., Kazlauskas, A., & Meistas, E. 1992, Balt. Astr., 1, 149
- Strom et al. (1976) Strom, S. E., Vrba, F. J., & Strom, K. M. 1976, AJ, 81, 638
- Tachihara et al. (2005) Tachihara, K., Neuhäuser, R., Kun, M., & Fukui Y. 2005, A&A, 437, 919
- Taylor et al. (1987) Taylor, D. K., Dickman, R. L., & Scoville, N. Z. 1987, ApJ, 315, 104
- Tilling et al. (2008) Tilling, I., Clarke, C. J., Pringle, J. E., & Tout, C. A. 2008, MNRAS, 385, 1530
- Turner & Evans (1984) Turner, D. G., & Evans, N. R. 1984, ApJ, 283, 254
- Veron-Cetty, & Veron (2006) Veron-Cetty, M.-P. & Veron, P. 2006, A&A, 455, 773
- Wainscoat et al. (1992) Wainscoat, R. J., Cohen, M., Volk, K., et al. 1992, ApJS, 83, 111
- Yonekura et al. (1997) Yonekura, Y., Dobashi, K., Mizuno, A., et al. 1997, ApJS, 110, 21
- Zdanavičius et al. (2009) Zdanavičius, K., Zdanavičius, J., Straižys, V., & Maskoliunas, M. 2009, Balt. Astr., 18, 33


| Names | IRAS | 2MASS | Spitzer Id.∗ | Membership | Cand. Type | Ref. |
|---|---|---|---|---|---|---|
| RNO 124, HBC 695, K98c Em* 6 | 20359+6745 | 20361986+6756316 | 3 | L 1152 | CTTS | 3 |
| PV Cep, HBC 696, RNO 125, K98c Em* 9 | 20453+6746 | 20455394+6757386 | 135 | L 1155 | CTTS | 3 |
| GSC 04472-00143 | 20535+7439 | 20530638+7450348 | IRAS | 8 | ||
| OSHA 42, K98c Em* 30 | F20598+7728 | 20584668+7740256 | 123 | L 1228 | H | 5,8 |
| RNO 129 A | 20590373+7823088 | L 1228 | red, nebulous | 18 | ||
| RNO 129 SW, Bern 48, K98c Em* 32, OSHA 44 | 21004+7811 | 20591409+7823040 | L 1228 | IRAS | 5,18 | |
| RNO 129 NEaaBinarity of the star embedded in RNO 129 was reported by Magakian et al. (2004). Our observations have shown that both components are PMS stars. | 21004+7811 | 20591409+7823040 | L 1228 | IRAS | 5,18 | |
| FT Cep, NGC 7023 RS 1, K98c Em* 26 | 20587+6802 | 20592284+6814437 | 15 | NGC 7023 | variable, H | 3 |
| K98c Em* 35, PRN2004 S5 | F21016+7651 | 21005285+7703149 | 124 | L 1228 | H, MIR | 8,12 |
| F21022+7729 | 21011339+7741091 | L 1228 | IRAS | 8 | ||
| NGC 7023 RS 2, NGC 7023 S J | 21012637+6810385 | 27 | NGC 7023 | variable | 1,4 | |
| NGC 7023 RS 2 BbbBinarity of NGC 7023 RS2 and LkH428 was reported by Rosino & Romano (1962). Our observations have shown that both components of these doubles are PMS stars. | 21012706+6810381 | 137 | NGC 7023 | variable | 1 | |
| OSHA 48 A, PRN2004 S6 | 21012919+7702373 | 30 | L 1228 | H | 5,12 | |
| OSHA 48 B | 21012919+7702373 | L 1228 | H | 5,12 | ||
| OSHA 49, K98c Em* 40, PRN2004 S7 | F21023+7650 | 21013097+7701536 | 32 | L 1228 | H | 5,8,12 |
| OSHA 50, K98c Em* 41, PRN2004 S8 | 21013267+7701176 | 33 | L 1228 | H | 5,8,12 | |
| PW Cep, LkH425, NGC 7023 RS 3, NGC 7023 S E | 21013590+6808219 | 104 | NGC 7023 | variable, H | 1,4 | |
| SX Cep, NGC 7023 S L | 21013754+6811309 | NGC 7023 | variable | 1,4 | ||
| NGC 7023 RS 5, NGC 7023 S N | 21014250+6812572 | 38 | NGC 7023 | variable | 1,4 | |
| HZ Cep, RS S 3, NGC 7023 S D | 21014358+6809361 | NGC 7023 | variable | 1,4 | ||
| FU Cep, LkH 427, HBC 304, NGC 7023 S C | 21009+6758 | 21014672+6808453 | NGC 7023 | CTTS | 2,4 | |
| PRN2004 S3 | 21014960+7705479 | 42 | L 1228 | MIR excess | 12 | |
| OSHA 53, K98c Em* 43, PRN2004 S9 | F21028+7645 | 21020488+7657184 | 43 | L 1228 | H | 5,8,12 |
| FV Cep, LkH 275, HBC 306, K98c Em* 38 | F21017+6813 | 21022039+6825240 | 46 | NGC 7023 | CTTS | 3 |
| LkH 428 N, NGC 7023 RS 8 | 21022829+6803285 | 125 | NGC 7023 | H | 1 | |
| LkH 428 SbbBinarity of NGC 7023 RS2 and LkH428 was reported by Rosino & Romano (1962). Our observations have shown that both components of these doubles are PMS stars. | 21022829+6803285 | 52 | NGC 7023 | H | 1 | |
| FW Cep, NGC 7023 RS 9 | 21023299+6807290 | 55 | NGC 7023 | variable | 1 | |
| NGC 7023 RS 10 | 21023+6754 | 21025943+6806322 | 57 | NGC 7023 | variable, IRAS | 1 |
| K98c Em* 46 | F21037+7614 | 21030242+7626538 | L 1228 | H, IRAS | 8 | |
| EH Cep, LkH 276, HBC 307, K98c Em* 42 | 21027+6747 | 21032435+6759066 | 60 | NGC 7023 | CTTS | 3 |
| OSHA 59, K98c Em* 49 | F21066+7710 | 21055189+7722189 | L 1228 | H | 5,8 | |
| K98c Em* 53 | 21153595+6940477 | H | 8 | |||
| BD , GSC 04461-01336 | 21169+6842 | 21173917+6855097 | L 1177? | IRAS | 8 | |
| K98c Em* 58 | F21202+6835 | 21205785+6848183 | H, IRAS | 8 | ||
| 2MASS 21225427+6921345 | 21225427+6921345 | K-band excess | 17 | |||
| RNO 135, K98c Em* 61 | 21326+7608 | 21323108+7621567 | L 1241? | H, IRAS | 8 | |
| NGC 7129 S V1 | 21401174+6630198 | NGC 7129 | variable | 9 | ||
| NGC 7129 S V2 | 21402277+6636312 | NGC 7129 | variable | 9 | ||
| V391 Cep, K98c Em* 71 | F21394+6621 | 21402755+6635214 | NGC 7129 | CTTS | 8,19 | |
| NGC 7129 S V3 | 21403852+6635017 | NGC 7129 | variable | 9 | ||
| K98c Em* 72 | F21404+6608 | 21413315+6622204 | NGC 7129 | H | 8 | |
| HBC 731, SVS76 NGC 7129 6 | 21425961+6604338 | NGC 7129 30 | NGC 7129 | CTTS | 2,3 | |
| HBC 732, V350 Cep, MMN2004b 13 | 21430000+6611279 | NGC 7129 31 | NGC 7129 | CTTS | 3,10,11 | |
| GGD 33A | 21430320+6611150 | NGC 7129 5 | NGC 7129 | HH, H | 10 | |
| MMN2004b 17 | 21431161+6609114 | NGC 7129 43 | NGC 7129 | H | 11 | |
| K98c Em* 73 | 21443229+7008130 | H | 8 | |||
| BH Cep, HBC 734, K98c Em* 83 | 22006+6930 | 22014287+6944364 | L 1219? | HAeBe | 3 | |
| K98c Em* 95 | 22131219+7332585 | L 1235? | H | 8 | ||
| GSC 04467-00835 | 22129+6949 | 22140608+7005043 | L 1219 | IRAS | 8 | |
| TYC2 4467-324-1 | 22144+6923 | 22154189+6938566 | L 1219 | IRAS | 8 | |
| TYC 4467-836-1 | 22152+6947 | 22163111+7002393 | L 1219 | IRAS | 8 | |
| BO Cep, HBC 735, K98c Em* 100 | F22156+6948 | 22165406+7003450 | L 1219? | HAeBe | 3 | |
| K98c Em* 109 | 22190169+7346072 | L 1235? | H | 8 | ||
| K98c Em* 108 | 22190203+7319252 | L 1235? | H | 8 | ||
| SV Cep, HBC 736, K98c Em* 113 | 22205+7325 | 22213319+7340270 | HAeBe | 3 | ||
| TYC 4608-2063-1 | 22219+7908 | 22220233+7923279 | IRAS | 8 | ||
| K98c Em* 119 N | 22256+7102 | 22265660+7118011 | H | 8 | ||
| K98c Em* 119 S | 22256+7102 | 22265660+7118011 | H | 8 | ||
| KP93 2-1, XMMU J223412.2 +751809 | 22331+7502 | 22341189+7518101 | 142 | L 1251 | H | 6,13 |
| KP93 39, XMMU J223516.6 +751848 | 22351668+7518471 | 76 | L 1251 | H | 6,13 | |
| RD95 B, VLA 10? | 22343+7501 | 22352442+7517037 | 143? | L 1251 | IR, radio? | 14,15,16 |
| RD95 A, VLA 7, VLA B | 22343+7501 | 22352497+7517113 | 143? | L 1251 | IR, radio | 14,15,16 |
| RD95 2 | 22352542+7517562 | 77 | L 1251 | K-band excess | 16 | |
| RD95 5 | 22352722+7518019 | 79 | L 1251 | K-band excess | 16 | |
| KP93 2-2, XMMU J223605.8 +751831 | 22350+7502 | 22360559+7518325 | 80 | L 1251 | H | 6,13 |
| KP93 3-10 | 22355+7505 | 22363545+7521352 | 81 | L 1251 | IRAS | 6 |
| KP93 2-43, XMMU J223727.7 +751525 | 22372780+7515256 | L 1251 | H | 6,13 | ||
| KP93 2-3, XMMU J223750.1 +750408 | 22374953+7504065 | 83 | L 1251 | H | 6,13 | |
| ETM94 IRAS 22376+7455 Star 3, | 22381872+7511538 | 86 | L 1251 | H | 6,10 | |
| XMMU J223818.8 +751154 | ||||||
| KP93 2-44, ETM94IRAS 22376+7456 Star 1, | 22384249+7511455 | 107 | L 1251 | H | 6,7,13 | |
| XMMU J223842.5+751146 | ||||||
| KP93 2-45, XMMU J223927.3 +751029 | 22392717+7510284 | 96 | L 1251 | H | 6,13 | |
| KP93 2-46, XMMU J223942.9 +750644 | 22385+7457 | 22394030+7513216 | 97 | L 1251 | H | 6,13 |
| GSC 04601-03483 | F22424+7450 | 22433926+7506302 | L 1251 | IRAS | 8 | |
| K98c Em* 128 | 22490470+7513145 | L 1251 | H | 8 | ||
| TYC 4601-1543-1 | 22480+7533 | 22491626+7549438 | L 1251 | IRAS | 8 | |
| K98c Em* 137 | 23143398+7350022 | L 1261 | H | 8 | ||
| AS 507, HBC 741, V395 Cep, K98c Em* 140 | 23189+7357 | 23205208+7414071 | L 1261 | CTTS | 3 |
References. — (1) Rosino & Romano (1962); (2) Strom et al. (1976); (3) Herbig & Bell (1988); (4) Sellgren (1983); (5) Ogura & Sato (1990); (6) Kun & Prusti (1993); (7) Eiroa et al. (1994); (8) Kun (1998); (9) Semkov (2003); (10) Miranda et al. (1994); (11) Magakian et al. (2004); (12) Padgett et al. (2004); (13) Simon (2006); (14) Beltrán et al. (2001); (15) Meehan et al. (1998); (16) Rosvick & Davidge (1995); (17) Cutri et al. (2003); (18) Movsessian & Magakian (2004); (19) Semkov (1993).
| Name | 2MASS | Instrument | Comment | Ref. |
|---|---|---|---|---|
| K98c Em* 2 | 20200929+7351431 | CAFOS+R100 | dMe | |
| K98c Em* 3 | 20220638+7301104 | CAFOS+R100 | dMe | |
| K98c Em* 4 | 20233729+6807137 | CAFOS+R100 | planetary nebula | |
| K98c Em* 7 | 20422058+7229495 | FAST | no H emission | |
| F20432+7457, 4C 74.26 | 20423730+7508024 | CAFOS+R100 | quasar | 1 |
| OSHA 1 | 20433097+7903247 | CAFOS+R100 | no H emission | |
| OSHA 2 | 20441641+7659130 | CAFOS+R100 | no H emission | |
| OSHA 3 | 20445359+7542255 | CAFOS+R100 | no H emission |
Note. — Table Pre-main sequence stars in the Cepheus flare region is published in its entirety in the electronic edition of the Astrophysical Journal. A portion is shown here for guidance regarding its form and content.
References. — (1) Veron-Cetty, & Veron (2006)
| Id. | Instrument | Sp.T. | H shapeaaThe type of the H emission line is indicated using the scheme introduced by Reipurth, Pedrosa & Lago (1996), i.e. type I lines are symmetric, IIR and IIB are double-peaked with a secondary peak higher than half of the primary located on its red and the blue side, respectively. Type III lines are double-peaked with a secondary peak lower than half of the primary, and IVB and IVR denotes the P Cygni and reversed P Cygni type profiles, respectively. | Other emission lines |
|---|---|---|---|---|
| RNO 124 | CAFOS+R100 | K0 | I | O I 6300, 6363, He I 5875, 6678, O I 7773, 8446, Ca II triplet, Pa 11,12,14 |
| PV Cep | CAFOS+R100 | cont. | IIIB | O I 6300, 6363, Fe II 6456, 6516, He I 5875, 6678, S II 6716, 6731, Fe II 7155 |
| K I 7664, 7698, O I 7773, 8446, Ca II triplet, Pa 11,12,13,14,19 | ||||
| IRAS 20535+7439 | CAFOS+R100, FAST | F8 | IVR | |
| OSHA 42 | CAFOS+R100 | M0 | I | O I 6300, 6363, He I 6678, S II 6716, 6731 |
| O I 7773, 8446, Ca II triplet | ||||
| RNO 129 A | CAFOS+R100 | M1 | I | O I 6300, 6363 |
| RNO 129 SW | CAFOS+R100, FAST | M1.5 | IIIB | O I 6300, 6363, S II 6716, 6731 |
| Fe II 7155, Ca II triplet | ||||
| RNO 129 NE | CAFOS+R100, FAST | M2 | IIIB | Ca II H&K, Balmer ser., Fe II 4351, Fe I 4922, 5016 |
| O I 6300, 6363, S II 6716, 6731, Fe II 7155 | ||||
| FT Cep | CAFOS+R100 | K1 | I | O I 6300, O I 7773, 8446, Ca II triplet |
| K98c Em* 35 | CAFOS+R100 | M2 | I | |
| F21022+7729 | CAFOS+R100 | M1 | IIB | O I 6300, O I 7773, 8446, Ca II triplet, Pa 11,12,14,19 |
| NGC 7023 RS 2 | CAFOS+R100 | M0IV | IIB | O I 6300 |
| NGC 7023 RS 2 B | CAFOS+R100 | M0 | I | |
| OSHA 48 | CAFOS+R100, FAST | K5 | I | |
| OSHA 48 B | CAFOS+R100 | cont. | I | |
| OSHA 49 | CAFOS+R100, FAST | M1 | I | |
| OSHA 50 | CAFOS+R100, FAST | M0 | I | Ca II H&K, Balmer ser., Fe I 4922, 5016, O I 6300 |
| 6363, He I 5875, 6678, Ca II triplet | ||||
| LkH 425 | CAFOS+R100 | M0 | I | O I 6300, 6363, He I 6678, S II 6716, 6731, O I 8446 |
| Ca II triplet | ||||
| SX Cep | CAFOS+R100 | K7 | abs. | |
| NGC 7023 RS 5 | CAFOS+R100 | M2 | I | O I 6363, O I 8446, Ca II triplet |
| HZ Cep | CAFOS+R100 | M0 | I | |
| FU Cep | CAFOS+R100 | M1 | IIIB | He I 6678, O I 8446, Ca II triplet |
| PRN2004 S3 | CAFOS+R100 | M1 | I | |
| OSHA 53 | CAFOS+R100, FAST | K5 | I | H |
| FV Cep | CAFOS+R100 | K5 | I | He I 6678 |
| LkH 428 N | CAFOS+R100 | K7 | I | O I 8446, Ca II triplet |
| LkH 428 S | CAFOS+R100 | M4.5IV | I | |
| FW Cep | CAFOS+R100 | K5 | I | |
| NGC 7023 RS 10 | CAFOS+R100 | K4 | I | |
| K98c Em* 46 | CAFOS+R100 | M2 | I | |
| EH Cep | CAFOS+R100 | K2 | I | Ca II triplet |
| OSHA 59 | CAFOS+R100, FAST | K5 | I | |
| K98c Em* 53 | CAFOS+R100, FAST | K5 | I | Ca II H&K, Balmer ser., He I 5875, 6678, O I 7773, 8446, Ca II triplet |
| BD +68°1118 | FAST | A2 | I | |
| K98c Em* 58 | CAFOS+R100, FAST | K7 | IIIB | O I 6300, 6363, S II 6716, 6731, Ca II triplet |
| 2MASS 21225427+6921345 | CAFOS+R100 | K3 | I | S II 6717 |
| RNO 135 | CAFOS+R100 | M3IV | I | |
| NGC 7129 S V1 | CAFOS+R100 | K7 | I | He I 6678 |
| NGC 7129 S V2 | CAFOS+R100 | M0 | IIB | |
| V391 Cep, K98c Em* 71 | CAFOS+R100 | K5 | IVB | O I 6300, O I 7773, 8446, 6431, Fe II 6456, He I 6678 |
| Ca II triplet, Fe I 8387, 8514, Pa 11,12,14,19 | ||||
| NGC 7129 S V3 | CAFOS+R100 | K5 | I | |
| K98c Em* 72 | CAFOS+R100 | K4 | IIIB | O I 6300, O I 7773, 8446, Ca II triplet |
| HBC 731 | CAFOS+G100 | K2 | I | |
| V350 Cep | CAFOS+R100 | M0 | I | O I 6300, He I 6678, S II 6716, 6731, Fe II 7711 |
| O I 7773, 8446, Fe I 8327, Ca II triplet | ||||
| GGD 33A | CAFOS+R100 | M0 | IIB | O I 6300, 6363, S II 6716, 6731, Fe I 7282, O I 8446, Ca II triplet |
| MMN2004b 17 | CAFOS+R100 | M1 | I | |
| K98c Em* 73 | CAFOS+R100 | K7 | I | He I 6678, O I 8446, Ca II triplet |
| BH Cep | CAFOS+G100 | F5 | IIB | |
| K98c Em* 95 | CAFOS+R100, FAST | K5 | IIB | O I 7773, 8446, Ca II triplet |
| IRAS 22129+6949 | CAFOS+G100, FAST | K0 | I | |
| IRAS 22144+6923 | CAFOS+R100 | F6 | IIR | O I 8446, Ca II triplet |
| IRAS 22152+6947W | CAFOS+G100, FAST | F5 | abs. | |
| BO Cep | CAFOS+G100 | F5 | IIR | |
| K98c Em* 109 | CAFOS+R100, FAST | K2 | IIR | Balmer ser., He I 5875, 6678, O I 6300, S II 6731, O I 7773, 8446, Ca II triplet |
| K98c Em* 108 | CAFOS+R100, FAST | K2 | I | |
| SV Cep | CAFOS+G100 | A2 | I | |
| IRAS F22219+7908 | CAFOS+R100, FAST | A1 | I | O I 7773, 8446, Ca II triplet |
| K98c Em* 119 N | CAFOS+R100, FAST | K5 | I | He I 6678, O I 8446, S II 6731, Ca II triplet |
| K98c Em* 119 S | CAFOS+R100, FAST | K0 | I | Ca II H&K, H, Fe I 4922, Na I D, O I 6300, O I 8446 |
| He I 5875, 6678, 7065, S II 6716, 6731, Fe II 7155 | ||||
| KP93 2-1 | CAFOS+G100 | K2 | IIB | H, Fe II 4923, O I 6300, 6364, He I 5875, 6678, S II 6717, 6731 |
| KP93 2-39 | CAFOS+G100 | M0 | I | |
| RD95 B | CAFOS+R100 | M0 | I | O I 6300, Ca II triplet |
| RD95 A | CAFOS+R100 | K7 | I | O I 6300, 6363, Ca II triplet |
| RD95 2 | CAFOS+R100 | M2.5IV | I | Ca II triplet |
| RD95 5 | CAFOS+R100 | M0IV | I | O I 6300 |
| KP93 2-2 | CAFOS+R100 | M2 | I | O I 6300, He I 6678, S II 6716, 6731, O I 7773, 8446 |
| IRAS 22355+7505 | CAFOS+G200 | M4 | I | |
| KP93 2-43 | FAST | K5 | I | |
| KP93 2-3 | CAFOS+G100 | K7 | I | |
| ETM94 Star 3 | CAFOS+R100 | K2 | IIB | O I 8446, Ca II triplet |
| KP93 2-44 | CAFOS+G100 | M1.5 | I | H, O I 6300, 6363, NII 6584, S II 6716, 6731 |
| KP93 2-45 | CAFOS+G100 | M1 | I | H, He I 5875, 6678 |
| KP93 2-46 | CAFOS+G100 | K5 | I | |
| IRAS F22424+7450 | CAFOS+R100, FAST | K4 | I | |
| K98c Em* 128 | CAFOS+R100 | M0 | IIIB | He I 6678, O I 7773, Ca II triplet, Pa 11,12,14 |
| IRAS 22480+7533 | CAFOS+R100 | K1 | IIB | O I 7773, 8446, Ca II triplet |
| K98c Em* 137 | CAFOS+R100 | M2 | I | He I 6678 |
| AS 507 | CAFOS+G100 | G2 | I |
| Id. | H line | EW(CaII triplet) | EW(LiI) | PMS Class | |||
|---|---|---|---|---|---|---|---|
| EW | v(10%) | 8499 | 8545 | 8663 | |||
| (Å) | (km s-1) | (Å) | (Å) | (Å) | (Å) | ||
| RNO 124 | 52.2 | 615 | 9.3 | 8.7 | 8.3 | 0.30 | CTTS |
| PV Cep | 71.2 | 481 | 76.5 | 71.6 | 68.0 | CTTS | |
| IRAS 20535+7439 | 3.8 | 399 | 0.32 | CTTS | |||
| OSHA 42 | 82.3 | 516 | 4.9 | 2.9 | 2.3 | CTTS | |
| RNO 129 A | 6.0 | 430 | WTTS | ||||
| RNO 129 SW | 36.8 | 658 | 8.4 | 8.3 | 4.6 | CTTS | |
| RNO 129 NE | 5.0 | 622 | 1.2 | 0.8 | 0.8 | CTTS | |
| FT Cep | 9.6 | 573 | 2.8 | 2.1 | 2.2 | 0.36 | CTTS |
| K98c Em* 35 | 7.4 | 426 | 0.48 | CTTS | |||
| F21022+7729 | 91.0 | 793 | 10.8 | 13.3 | 12.9 | CTTS | |
| NGC 7023 RS 2 | 59.8 | 543 | 0.6 | 0.6 | 0.9 | CTTS | |
| NGC 7023 RS 2 B | 63.9 | 488 | CTTS | ||||
| OSHA 48 | 12.6,2.3 | 399 | 0.48 | CTTS | |||
| OSHA 48 B | 79.6 | 551 | CTTS | ||||
| OSHA 49 | 7.3 | 283 | 0.60 | CTTS | |||
| OSHA 50 | 65.0, 78.8 | 487 | 11.0 | 11.0 | 10.8 | CTTS | |
| LkH 425 | 106.0 | 563 | 21.5 | 22.3 | 18.5 | CTTS | |
| SX Cep | 2.15 | +1.2 | +2.3 | +0.9 | 0.61 | WTTS | |
| NGC 7023 RS 5 | 28.8 | 544 | 0.50 | CTTS | |||
| HZ Cep | 3.9 | 239 | 0.46 | WTTS | |||
| FU Cep | 64.5 | 691 | 3.5 | 3.4 | 3.1 | CTTS | |
| PRN2004 S3 | 9.0 | 526 | CTTS | ||||
| OSHA 53 | 20.5, 28.4 | 515 | CTTS | ||||
| FV Cep | 11.5 | 378 | 0.55 | CTTS | |||
| LkH 428 N | 56.0 | 624 | 2.1 | 2.6 | 1.4 | 0.63 | CTTS |
| LkH 428 S | 7.5 | 361 | 0.50 | CTTS | |||
| FW Cep | 4.0 | 596 | 0.56 | CTTS | |||
| NGC 7023 RS 10 | 8.1 | 272 | +0.5 | +1.6 | +1.0 | CTTS | |
| K98c Em* 46 | 5.3 | 321 | CTTS | ||||
| EH Cep | 13.1 | 665 | 4.0 | 2.8 | 2.9 | 0.32 | CTTS |
| OSHA 59 | 27.0, 13.7 | 632 | 4.1 | 4.3 | 3.5 | 0.38 | CTTS |
| K98c Em* 53 | 58.0 | 565 | 0.55 | CTTS | |||
| BD +68°1118 | 24.1 | HAe | |||||
| K98c Em* 58 | 38.3 | 727 | 3.5 | 2.7 | 2.1 | CTTS | |
| 2MASS J 21225427 | 7.3 | 385 | 0.80 | CTTS | |||
| RNO 135 | 5.0 | 310 | 0.4 | +0.9 | +1.0 | 0.27 | WTTS |
| NGC 7129 S V1 | 19.4 | 620 | CTTS | ||||
| NGC 7129 S V2 | 45.0 | 636 | 2.6 | 2.1 | 3.7 | CTTS | |
| V391 Cep | 62.0 | 455 | 29.8 | 36.3 | 31.4 | CTTS | |
| NGC 7129 S V3 | 76.5 | 684 | 0.86 | CTTS | |||
| K98c Em* 72 | 34.0 | 687 | 12.0 | 11.1 | 8.6 | 0.86 | CTTS |
| HBC 731 | 36.5 | 509 | CTTS | ||||
| V350 Cep | 70.0 | 495 | 15.9 | 19.7 | 17.1 | CTTS | |
| GGD 33A | 93.8 | 764 | 57.1 | 64.9 | 80.8 | CTTS | |
| MMN2004b 17 | 11.0 | 515 | 0.37 | CTTS | |||
| K98c Em* 73 | 87.0 | 618 | 0.8 | 0.5 | 0.42 | CTTS | |
| BH Cep | 2.0 | HAe | |||||
| K98c Em* 95 | 23.8 | 540 | 2.0 | 2.6 | 1.9 | 0.42 | CTTS |
| IRAS 22129+6949 | 9.4, 9.1 | 446 | 0.25 | CTTS | |||
| IRAS 22144+6923 | 7.8 | 676 | 2.5 | 0.9 | 0.9 | 0.22 | CTTS |
| IRAS 22152+6947 | 2.4 | 0.20 | WTTS? | ||||
| BO Cep | 6.8 | 712 | HAe | ||||
| K98c Em* 109 | 52.9 | 770 | 0.54 | CTTS | |||
| K98c Em* 108 | 17.4 | 520 | 0.50 | CTTS | |||
| SV Cep | 8.0 | 0.27 | HAe | ||||
| IRAS F22219+7908 | 31.0, 5.4 | 472 | 1.9 | 1.7 | 1.3 | HAe? | |
| K98c Em* 119 N | 61.8 | 500 | 19.2 | 19.2 | 13.6 | 0.44 | CTTS |
| K98c Em* 119 S | 37.4 | 547 | 0.25 | CTTS | |||
| KP93 2-1 | 81.5 | 803 | CTTS | ||||
| KP93 2-39 | 6.0 | 662 | 0.37 | CTTS | |||
| RD95 B | 27.4 | 461 | 1.6 | 1.2 | 1.5 | CTTS | |
| RD95 A | 24.6 | 537 | 1.3 | 1.1 | 0.6 | CTTS | |
| RD95 2 | 46.6 | 465 | 3.8 | 3.15 | 2.42 | CTTS | |
| RD95 5 | 19.8 | 324 | 0.58 | CTTS | |||
| KP93 2-2 | 69.5 | 538 | 14.7 | 15.3 | 12.6 | CTTS | |
| IRAS 22355+7505 | 30.8 | 620 | CTTS | ||||
| KP93 2-43 | 3.2 | 316 | WTTS | ||||
| KP93 2-3 | 23.6 | 746 | 0.36 | CTTS | |||
| ETM94 Star 3 | 7.1 | 776 | 2.0 | 0.6 | 0.9 | 0.26 | CTTS |
| KP93 2-44 | 12.7 | 479 | 0.44 | CTTS | |||
| KP93 2-45 | 33.2 | 432 | 0.32 | CTTS | |||
| KP93 2-46 | 57.8 | 566 | 0.55 | CTTS | |||
| IRAS F22424+7450 | 0.4 | 0.57 | WTTS | ||||
| K98c Em* 128 | 83.5 | 630 | 3.5 | 3.5 | 3.1 | CTTS | |
| IRAS 22480+7533 | 25.7 | 673 | 2.8 | 3.2 | 2.9 | CTTS | |
| K98c Em* 137 | 44.3 | 484 | CTTS | ||||
| AS 507 | 9.4 | 625 | 0.36 | CTTS | |||
| Id. | B | V | RC | IC | Comment |
|---|---|---|---|---|---|
| RNO 124 | 17.81 (0.25) | 16.02 (0.12) | 14.34 (0.12) | var. | |
| PV Cep | 19.27 (0.85) | 17.46 (0.70) | 15.98 (0.50) | 14.60 (0.40) | var. |
| IRAS 20535+7439 | 13.44 (0.05) | 12.37 (0.03) | 11.76 (0.03) | 11.11 (0.03) | |
| OSHA 42 | 18.36 (0.30) | 16.74 (0.30) | 15.38 (0.15) | 14.06 (0.20) | var. |
| RNO 129 A | 20.76 (0.05) | 18.76 (0.03) | 16.83 (0.04) | 14.89 (0.02) | |
| RNO 129 SW | 17.43 (0.07) | 15.68 (0.07) | 14.17 (0.07) | 12.75 (0.07) | |
| RNO 129 NE | 19.60 () | 17.86 () | 15.85 () | 2.1″, 613 | |
| FT Cep | 19.37 (1.10) | 16.41 (0.83) | 14.79 (0.80) | 13.30 (0.95) | var. |
| FT Cep B | 18.59 (0.07) | 16.97 (0.01) | 15.90 (0.01) | 14.97 (0.02) | 5.4″, 27° |
| K98c Em* 35 | 17.04 (0.07) | 15.64 (0.11) | 14.04 (0.25) | 12.72 (0.25) | var. V |
| F21022+7729 | 20.30 (0.72) | 19.89 (0.65) | 18.09 (0.80) | 16.22 (0.45) | var. |
| NGC 7023 RS 2 | 18.61 (0.05) | 16.50 (0.03) | 14.90 (0.03) | 13.25 (0.07) | |
| NGC 7023 RS 2 B | 20.37 (0.30) | 18.26 (0.42) | 16.63 (0.65) | 14.98 (0.73) | var. |
| OSHA 48 | 15.64 (0.12) | 14.31 (0.05) | 12.75 (0.04) | 11.51 (0.22) | var. |
| OSHA 48 B | 16.88 (0.26) | 15.37 (0.30) | 13.85 (0.15) | 12.66 (0.12) | 1.5″, 86° |
| OSHA 49 | 17.97 (0.06) | 16.58 (0.05) | 14.89 (0.05) | 13.38 (0.08) | |
| OSHA 50 | 18.07 (0.05) | 17.11 (0.05) | 15.38 (0.05) | 13.86 (0.05) | |
| OSHA 50 B | 19.43 () | 18.44 () | 16.599 (0.11) | 14.702 (0.14) | 1.4″, 81° |
| LkH 425 | 17.00 (0.05) | 15.95 (0.02) | 15.04 (0.02) | 13.93 (0.02) | |
| SX Cep | 16.21 (0.16) | 14.67 (0.30) | 13.53 (0.36) | 12.40 (0.38) | var. |
| NGC 7023 RS 5 | 19.09 (0.10) | 17.29 (0.10) | 15.84 (0.51) | 14.35 (0.60) | var. |
| NGC 7023 RS 5 B | 19.08 () | 17.501 () | 1.5″, 158° | ||
| HZ Cep | 17.00 (0.10) | 15.22 (0.06) | 14.01 (0.10) | 12.76 (0.35) | var. |
| FU Cep | 17.70 (1.72) | 16.13 (0.67) | 14.83 (0.51) | 13.47 (0.03) | var. |
| PRN S3 | 21.86 (0.20) | 18.94 (0.21) | 16.73 (0.34) | 15.11 (0.05) | var. |
| OSHA 53 | 15.88 (0.12) | 14.37 (0.16) | 13.35 (0.14) | 12.47 (0.15) | var. |
| FV Cep | 15.58 (0.55) | 14.45 (0.40) | 13.56 (0.29) | 12.63 (0.43) | var. |
| LkH 428 N | 18.84 (0.30) | 16.89 (0.06) | 15.32 (0.01) | 13.68 (0.01) | |
| LkH 428 S | 19.91 (0.30) | 17.73 (0.02) | 15.86 (0.01) | 13.95 (0.05) | 2.1″, 166° |
| FW Cep | 16.17 (0.10) | 14.83 (0.01) | 13.83 (0.03) | 12.98 (0.03) | |
| NGC 7023 RS 10 | 16.92 (0.07) | 15.81 (0.05) | 15.04 (0.05) | 14.46 (0.06) | |
| K98c Em* 46 | 17.11 (0.05) | 15.39 (0.04) | 14.34 (0.02) | 12.99 (0.02) | |
| K98c Em* 46B | 17.50 (0.10) | 15.22 (0.08) | 1.0″, 270° | ||
| EH Cep | 13.28 (0.07) | 12.16 (0.02) | 11.42 (0.02) | 10.81 (0.02) | |
| OSHA 59 | 15.47 (0.07) | 13.99 (0.05) | 13.06 (0.02) | 12.21 (0.02) | |
| K98c Em* 53 | 15.83 (0.10) | 14.83 (0.12) | 13.92 (0.12) | 13.06 (0.14) | var. |
| BD +68°1118 | 10.08 (0.04) | 9.94 (0.04) | 9.811 (0.03) | 9.750 (0.03) | |
| K98c Em* 58 | 18.79 (0.15) | 17.62 (0.20) | 16.77 (0.12) | 16.03 (0.25) | var. |
| 2MASS 21225427+6921345 | 19.27 (0.25) | 17.78 (0.12) | 16.23 (0.10) | ||
| RNO 135 | 18.67 (0.03) | 16.72 (0.01) | 15.13 (0.01) | 13.35 (0.01) | |
| NGC 7129 S V1 | 17.37 (0.35) | 16.18 (0.36) | 15.20 (0.40) | 14.34 (0.50) | var. |
| NGC 7129 S V2 | 19.32 (0.50) | 17.72 (0.45) | 16.53 (0.42) | 15.45 (0.36) | var. |
| V391 Cep | 15.24 (0.06) | 14.16 (0.04) | 13.27 (0.04) | 12.50 (0.03) | |
| NGC 7129 S V3 | 19.55 (0.45) | 17.78 (0.42) | 16.45 (0.50) | 15.34 (0.55) | var. |
| NGC 7129 S V3 B | 16.77 () | 3.2″, 165° | |||
| K98c Em* 72 | 17.22 (0.06) | 15.67 (0.03) | 14.61 (0.04) | 13.57 (0.03) | |
| HBC 731 | 19.34 (0.15) | 17.69 (0.12) | 16.08 (0.23) | var. | |
| V350 Cep | 17.24 (0.10) | 16.20 (0.10) | 15.23 (0.06) | 14.11 (0.07) | |
| GGD 33A | 18.49 () | ||||
| MMN2004b 17 | 18.06 (0.10) | 16.31 (0.04) | 15.23 (0.36) | 14.14 (0.01) | var. |
| K98c Em* 73 | 15.58 (0.05) | 14.59 (0.04) | 13.66 (0.03) | 12.90 (0.03) | |
| BH Cep | 11.54 (0.05) | 11.01 (0.03) | 10.62 (0.03) | 10.32 (0.03) | |
| K98c Em* 95 | 15.25 (0.10) | 13.98 (0.15) | 13.11 (0.12) | 12.39 (0.07) | var. |
| K98c Em* 95 B | 18.379 () | 17.54 () | 16.14 () | 14.502 () | 1.8″, 83° |
| IRAS 22129+6949 | 12.52 (0.01) | 11.63 (0.04) | 11.01 (0.02) | 10.57 (0.02) | |
| IRAS 22144+6923 | 12.40 (0.04) | 11.60 (0.02) | 11.07 (0.02) | 10.63 (0.02) | |
| IRAS 22152+6947 W | 11.74 (0.03) | 11.40 (0.02) | 11.15 (0.03) | 10.84 (0.03) | |
| BO Cep | 11.98 (0.08) | 11.55 (0.07) | 11.16 (0.06) | 10.84 (0.03) | |
| K98c Em* 109 | 16.30 (0.01) | 14.96 (0.02) | 13.94 (0.02) | 13.18 (0.01) | |
| K98c Em* 108 | 14.47 (0.04) | 13.27 (0.03) | 12.43 (0.02) | 11.87 (0.02) | |
| SV Cep | 10.70 (0.10) | 10.52 (0.12) | 10.28 (0.06) | 10.08 (0.05) | |
| IRAS 22219+7908 | 12.65 (0.06) | 12.39 (0.04) | 12.16 (0.02) | 12.05 (0.02) | |
| K98c Em* 119 N | 15.67 (0.08) | 14.81 (0.08) | 14.00 (0.06) | 13.19 (0.07) | |
| K98c Em* 119 S | 18.41 (0.07) | 17.27 (0.07) | 16.22 (0.11) | 15.26 (0.01) | 4″, 184° |
| KP93 2-1 | 17.12 (0.75) | 15.42 (0.42) | 13.80 (1.03) | 12.53 (0.07) | var. |
| KP93 39 | 17.34 (0.25) | 15.89 (0.46) | 14.38 (0.43) | 13.31 (0.12) | var. |
| RD95 B | 22.99 () | 20.22 (0.25) | 17.76 (0.30) | var. | |
| RD95 A | 20.94 () | 19.12 (0.76) | 16.09 (0.60) | var. | |
| 2MASS 22352542+7517562 | 18.93 (0.85) | 17.20 (0.90) | 15.59 (0.75) | 14.15 (0.55) | var. |
| 2MASS 22352722+7518019 | 19.40 (0.60) | 17.66 (0.65) | 15.83 (0.40) | 14.45 (0.45) | var. |
| KP93 2-2 | 19.66 (1.60) | 16.97 (1.85) | 15.29 (0.45) | 13.84 (1.10) | var. |
| IRAS 22355+7505 | 21.26 (0.60) | 19.82 (0.45) | 17.48 (0.34) | 15.09 (0.50) | var. |
| KP93 2-43 | 19.18 (0.09) | 16.87 (0.08) | 15.17 (0.05) | 13.57 (0.05) | |
| KP93 2-43B | 19.37 (0.12) | 18.71 (0.04) | 16.71 (0.05) | 14.86 (0.04) | 5.2″, 2455 |
| KP93 2-3 | 16.50 (0.06) | 15.04 (0.08) | 14.01 (0.03) | 13.13 (0.03) | |
| ETM94 IRAS 22376+7455 Star 3 | 19.80 (0.25) | 17.44 (0.06) | 15.75 (0.06) | 13.983 (0.05) | |
| KP93 2-44 | 17.65 (0.10) | 16.10 (0.07) | 14.90 (0.03) | 13.62 (0.01) | |
| KP93 2-45 | 17.06 (0.12) | 15.79 (0.02) | 14.70 (0.34) | 13.44 (0.45) | var. |
| KP93 2-46 | 19.05 (0.22) | 17.01 (0.02) | 15.24 (0.02) | 13.56 (0.03) | |
| IRAS F22424+7450 | 14.37 (0.07) | 13.22 (0.07) | 12.48 (0.04) | 11.86 (0.02) | |
| K98c Em* 128 | 16.87 (0.12) | 15.66 (0.07) | 14.70 (0.08) | 13.69 (0.04) | |
| IRAS 22480+7533 | 12.95 (0.05) | 12.00 (0.03) | 11.41 (0.02) | 10.87 (0.02) | |
| K98c Em* 137 | 17.66 (0.11) | 16.48 (0.06) | 15.321 (0.03) | 13.76 (0.03) | |
| AS 507 | 11.17 (0.06) | 10.22 (0.06) | 9.63 (0.18) | 9.16 (0.05) | |
| AS 507 B | 16.93 (0.07) | 16.08 (0.04) | 14.69 (0.03) | 12.71 (0.03) | 9″, 156° |
| Cloud | D (pc) | References |
|---|---|---|
| L 1147 / L 1158 | 325 | Straizys et al. (1992) |
| NGC 7023 | 282 | Zdanavičius et al. (2009) |
| L 1228 | 200 | Kun (1998) |
| L 1251 | 320 | average from Kun (1998) and Balázs et al. (2004) |
| L 1219 | 400 | Racine (1968) |
| L 1261 / L 1262 | 180 | Kun (1998) |
| NGC 7129 | 800 | Ábrahám et al. (2000) |
| Star | AV (mag) | Lbol(L☉) | (K) | (M☉) | Age (Myr) | (M☉ yr-1) | ||
|---|---|---|---|---|---|---|---|---|
| V(H) | EW(H) | EW(8542) | ||||||
| L1228 | ||||||||
| F21022 | 5.90 | 0.34 | 3720 | 0.5 | 2.8 | 4.98 | 7.29 | 7.21 |
| OSHA 42 | 3.42 | 0.49 | 3850 | 0.6 | 2.8 | 6.90 | 6.97 | 7.55 |
| K98c Em* 35 | 0.92 | 0.34 | 3580 | 0.35 | 2.0 | 8.36 | 8.30 | |
| OSHA 48 | 2.89 | 2.83 | 4350 | 1.2 | 1.0 | 8.60 | 6.96 | |
| OSHA 49 | 2.26 | 0.38 | 3720 | 0.5 | 3.0 | 9.11 | 8.60 | |
| OSHA 50 | 3.05 | 0.28 | 3850 | 0.60 | 4.5 | 7.82 | 6.97 | 6.87 |
| PRN2004 S3 | 4.04 | 0.21 | 3720 | 0.5 | 4.0 | 7.94 | 8.53 | |
| OSHA 53 | 1.55 | 0.57 | 4350 | 0.95 | 10.0 | 7.56 | 7.67 | |
| OSHA 59 | 1.74 | 0.67 | 4350 | 1.0 | 6.0 | 6.49 | 7.39 | |
| RNO 129 SW | 4.20 | 0.42 | 3720 | 0.5 | 3.0 | 6.58 | 7.12 | 6.69 |
| RNO 129 NE | 4.40 | 0.42 | 3580 | 0.35 | 3.0 | 6.24 | 7.41 | 7.26 |
| RNO 129 A | 4.27 | 0.22 | 3650 | 0.42 | 1.2 | 12.47 | 11.95 | |
| K98c Em* 46 | 0.00 | 0.16 | 3580 | 0.35 | 2.5 | 9.27 | 9.39 | |
| NGC 7023 | ||||||||
| FT Cep | 5.85 | 6.33 | 5080 | 2.1 | 1.2 | 7.03 | 7.08 | 6.90 |
| FU Cep | 1.82 | 0.48 | 3720 | 0.48 | 1.6 | 5.94 | 7.05 | 7.21 |
| LkH 425 | 1.47 | 0.25 | 3850 | 0.6 | 5.0 | 7.12 | 7.46 | 7.15 |
| NGC 7023 RS2 | 3.65 | 1.82 | 3850 | 0.6 | 0.5 | 7.31 | 7.26 | 8.21 |
| NGC 7023 RS2B | 4.41 | 0.60 | 3850 | 0.6 | 2.0 | 7.81 | 7.19 | |
| NGC 7023 RS5 | 2.83 | 0.41 | 3580 | 0.38 | 1.3 | 7.30 | 7.63 | 7.69 |
| HZ Cep | 1.74 | 0.75 | 3850 | 0.6 | 1.5 | |||
| SX Cep | 1.46 | 0.89 | 4060 | 0.8 | 2.1 | |||
| LkH 428 N | 4.47 | 2.02 | 4060 | 0.8 | 0.8 | 6.56 | 6.87 | 7.02 |
| LkH 428 S | 0.68 | 0.15 | 3305 | 0.2 | 1.5 | 8.93 | 8.92 | |
| FV Cep | 1.27 | 0.63 | 4350 | 1.0 | 7.0 | 8.78 | 8.10 | |
| FW Cep | 1.52 | 0.54 | 4350 | 1.0 | 8.5 | 6.82 | 8.68 | |
| NGC 7023 RS 10 | 0.00 | 0.07 | 4590 | 9.66 | 10.22 | |||
| EH Cep | 1.39 | 3.41 | 4900 | 1.8 | 2.9 | 6.18 | 6.76 | 6.84 |
| L1251 | ||||||||
| KP93 2-1 | 4.67 | 6.61 | 4900 | 2.1 | 0.9 | 4.88 | 5.83 | |
| KP93 2-39 | 1.25 | 0.44 | 3850 | 0.6 | 3.0 | 7.46 | 8.63 | |
| KP93 2-2 | 2.01 | 0.43 | 3580 | 0.38 | 1.1 | 7.35 | 7.23 | 6.78 |
| KP93 3-10 | 6.16 | 1.28 | 3370 | 0.2 | 0.1 | 5.48 | 6.24 | |
| RD95 A | 8.88 | 2.24 | 4060 | 0.8 | 0.8 | 7.36 | 7.09 | 7.22 |
| RD95 B | 9.88 | 1.03 | 3850 | 0.6 | 0.9 | 8.05 | 7.11 | 7.53 |
| RD95 2 | 3.19 | 0.62 | 3525 | 0.35 | 0.8 | 8.01 | 6.15 | 6.24 |
| RD95 5 | 3.19 | 0.43 | 3580 | 0.6 | 3.0 | 9.24 | 7.11 | |
| KP93 2-43 | 4.74 | 2.25 | 4350 | 1.2 | 1.0 | 9.31 | 9.31 | |
| ETM94 Star 3 | 6.47 | 4.49 | 4900 | 2.0 | 1.8 | 5.14 | 7.47 | |
| KP93 2-3 | 1.21 | 0.50 | 4060 | 0.8 | 4.0 | 5.42 | 7.91 | |
| KP93 2-44 | 1.08 | 0.31 | 3650 | 0.41 | 2.5 | 7.87 | 8.76 | |
| KP93 2-45 | 1.62 | 0.49 | 3720 | 0.5 | 1.8 | 8.31 | 7.54 | |
| KP93 2-46 | 5.47 | 4.02 | 4350 | 1.2 | 0.5 | 7.09 | 6.24 | |
| IRAS 22424 | 0.44 | 1.00 | 4590 | 1.2 | 7.5 | 9.29 | ||
| IRAS 22480 | 0.79 | 3.00 | 5080 | 1.5 | 4.0 | 6.51 | 6.77 | 6.99 |
| K98c Em* 128 | 1.39 | 0.34 | 3850 | 0.6 | 4.0 | 6.50 | 7.73 | 8.11 |
| G 109+11 association | ||||||||
| BD+68°1118 | 0.99 | 21.40 | 8970 | 2.0 | 7.0 | |||
| K98c Em* 53 | 1.59 | 1.65 | 4350 | 1.2 | 1.5 | 7.10 | 7.37 | 7.60 |
| K98c Em* 58 | 1.34 | 0.10 | 4060 | 0.6 | 5.60 | 9.26 | 9.21 | |
| 2MASS 212254 | 5.66 | 0.87 | 4730 | 1.0 | 20: | 8.72 | 8.88 | |
| K98c Em* 73 | 0.57 | 0.69 | 4060 | 0.8 | 3.0 | 6.61 | 7.20 | 8.47 |
| BH Cep | 0.62 | 8.20 | 6440 | 1.5 | 6.0 | 7.85 | ||
| BO Cep | 0.49 | 4.75 | 6440 | 1.35 | 15.0 | 7.59 | ||
| IRAS 22129 | 0.72 | 5.90 | 5250 | 1.8 | 3.0 | 8.18 | 7.01 | |
| IRAS 22144 | 0.21 | 4.88 | 6360 | 1.5 | 5.0 | 6.08 | 7.44 | |
| IRAS 22152 | 0.00 | 5.07 | 6440 | 1.3 | 10.0 | |||
| K98c Em* 119N | 0.90 | 0.69 | 4350 | 1.0 | 5.0 | 7.70 | 7.60 | 7.20 |
| K98c Em* 119S | 2.89 | 0.33 | 5250 | 0.85 | 7.27 | 8.48 | ||
| SV Cep group | ||||||||
| K98c Em* 95 | 0.40 | 2.22 | 4350 | 1.1 | 3.0 | 7.33 | 7.57 | 7.53 |
| K98c Em* 108 | 1.15 | 3.01 | 4900 | 2.0 | 1.5 | 7.52 | 7.22 | |
| K98c Em* 109 | 3.12 | 2.59 | 4900 | 1.5 | 3.5 | 5.19 | 6.66 | |
| SV Cep | 1.48 | 44.67 | 8970 | 2.4 | 4.0 | 6.63 | ||
| NGC 7129 | ||||||||
| V350 Cep | 1.20 | 1.27 | 3850 | 0.58 | 0.5 | 7.74 | 6.99 | 6.99 |
| GGD 33a | 2.84 | 0.06 | 3850 | 0.4 | 5.52 | 9.13 | 8.29 | |
| MMN2004b 17 | 1.00 | 1.06 | 3720 | 0.45 | 0.5 | 7.56 | 8.41 | |
| HBC 731 | 7.71 | 6.53 | 4900 | 2.0 | 1.0 | 7.62 | 7.45 | |
| V391 Cep | 0.96 | 4.76 | 4350 | 1.15 | 0.2 | 8.10 | 6.80 | 6.25 |
| NGC 7129 S V1 | 0.92 | 0.81 | 4060 | 0.8 | 2.5 | 7.47 | 8.55 | |
| NGC 7129 S V2 | 1.38 | 0.41 | 3850 | 0.6 | 3.0 | 7.12 | 8.63 | 8.61 |
| NGC 7129 S V3 | 3.50 | 1.40 | 4350 | 1.15 | 2.5 | 6.69 | 7.59 | |
| K98c Em* 72 | 3.05 | 5.70 | 4590 | 1.6 | 0.5 | 5.97 | 5.91 | 5.96 |
| Small groups and dispersed stars | ||||||||
| RNO 124 | 6.53 | 0.92 | 5250 | 1.4 | 3.0 | 6.64 | 7.57 | 7.43 |
| PV Cep | 4.87 | 0.90 | 5250 | 1.1 | 7.87 | 7.08 | 6.40 | |
| IRAS F20535 | 1.76 | 4.04 | 6200 | 1.35 | 9.0 | 8.60 | 7.76 | |
| RNO 135 | 2.49 | 0.34 | 3470 | 0.30 | 1.0 | 9.36 | 8.58 | |
| IRAS F22219 | 1.17 | 5.33 | 9230 | 2.0 | 7.94 | 7.67 | ||
| K98c Em* 137 | 2.59 | 0.20 | 3580 | 0.38 | 5.0 | 7.84 | 7.45 | |
| AS 507 | 1.07 | 5.77 | 5860 | 1.55 | 3.1 | 6.55 | 6.70 | |
| Region | AV | Teff | M∗ | Age | N | |||
|---|---|---|---|---|---|---|---|---|
| (mag) | (K) | (M☉) | (Myr) | (M) | µm | |||
| NGC 7023 | 1.6 | 3850 | 0.6 | 1.6 | 7.3 | 0.98 | 3.6 | 14 |
| L 1228 | 3.1 | 3720 | 0.5 | 3.0 | 0.90 | 3.6 | 13 | |
| L 1228 S | 2.3 | 3720 | 0.5 | 3.0 | 8.3 | 0.90 | 5.8 | 7 |
| L 1251 | 3.2 | 3850 | 0.6 | 1.8 | 7.1 | 0.93 | 2.2 | 17 |
| L 1251 C | 4.7 | 3850 | 0.6 | 0.9 | 7.1 | 0.93 | 1.2 | 8 |
| L 1251 E | 1.6 | 4060 | 0.8 | 1.8 | 7.5 | 0.94 | 5.8 | 5 |
| G 109+11 ass. | 1.0 | 5250 | 1.5 | 6.0 | 0.28 | 12 | ||
| SV Cep group | 1.3 | 4900 | 1.7 | 3.0 | 0.68 | 4 | ||
| NGC 7129 | 1.4 | 4060 | 0.8 | 1.0 | 7.5 | 0.29 | 1.6 | 9 |