Optical spectroscopy of Distant Red Galaxies
Abstract
We present optical spectroscopic follow-up of a sample of Distant Red Galaxies (DRGs) with , selected by , in the Hubble Deep Field South (HDFS), the MS 1054–03 field, and the Chandra Deep Field South (CDFS). Spectroscopic redshifts were obtained for 15 DRGs. Only 2 out of 15 DRGs are located at , suggesting a high efficiency to select high-redshift sources. From other spectroscopic surveys in the CDFS targeting intermediate to high redshift populations selected with different criteria, we find spectroscopic redshifts for a further 30 DRGs. We use the sample of spectroscopically confirmed DRGs to establish the high quality (scatter in of ) of their photometric redshifts in the considered deep fields, as derived with EAZY (Brammer et al. 2008). Combining the spectroscopic and photometric redshifts, we find that 74% of DRGs with lie at . The combined spectroscopic and photometric sample is used to analyze the distinct intrinsic and observed properties of DRGs at and . In our photometric sample to , low-redshift DRGs are brighter in than high-redshift DRGs by 0.7 mag, and more extincted by 1.2 mag in . Our analysis shows that the DRG criterion selects galaxies with different properties at different redshifts. Such biases can be largely avoided by selecting galaxies based on their rest-frame properties, which requires very good multi-band photometry and high quality photometric redshifts.
Subject headings:
galaxies: distances and redshifts - galaxies: high redshift - infrared: galaxies1. Introduction
Studies of the history of star formation and mass assembly in galaxies requires samples of galaxies over a range of lookback times. Since large spectroscopic surveys of purely magnitude-limited samples (e.g., VVDS, Le Fèvre et al. 2004) become progressively less efficient at probing higher redshifts, a variety of photometric criteria have been developed to efficiently select distant galaxies. The application of one or combination of several of these criteria should allow us to construct samples that are representative for the whole galaxy population at the considered redshift.
The Lyman-break technique (Steidel & Hamilton 1993) was the first to be routinely used, identifying relatively unobscured, actively star-forming galaxies at based on their rest-frame UV colors. Similar criteria were designed to probe star-forming galaxies at and , referred to as BX and BM galaxies respectively (Adelberger et al. 2004). The advent of near-infrared (NIR) instruments on 8-10m class telescopes encouraged the study of NIR-selected galaxies at high redshift. The NIR flux is less affected by dust obscuration and small amounts of recent star formation and is therefore a better tracer of stellar mass than the optical fluxes. The two most commonly used color criteria in the NIR to probe distant galaxies are based on the BzK bands (Daddi et al. 2004, identifying galaxies at ) and color (Franx et al. 2003, designed to select red galaxies at ). The latter class of galaxies, so-called Distant Red Galaxies (DRGs), are characterized by the simple color criterion . They are found to be massive ( for ) systems (van Dokkum et al. 2004; Förster Schreiber et al. 2004) and range from dusty star-forming to quiescent types (Labbé et al. 2005; Papovich et al. 2006; Kriek et al. 2006; Wuyts et al. 2007).
In all of the surveys mentioned above, spectroscopic confirmation is indispensable. The high-redshift nature of a color-selected population can only be directly verified by measuring redshifts from their spectra. Apart from establishing the redshift range probed, the presence of emission and/or absorption lines provides valuable information on the nature of the galaxies. Moreover, having a spectroscopic redshift reduces the number of free parameters in Spectral Energy Distribution (SED) modeling by one and allows for a more accurate determination of the rest-frame colors. Finally, the availability of spectroscopic redshifts allows us to address the quality of photometric redshift estimates, on which many analyses of the high-redshift galaxy population rely.
Large samples of optically selected galaxies have been spectroscopically confirmed and their stellar populations, metallicity and kinematics such as large-scale outflows have been studied extensively based on the obtained optical and NIR spectra (e.g., Steidel et al. 1996; Shapley et al. 2003; Erb et al. 2006). The samples of NIR-selected distant galaxies with spectroscopic confirmation to date are considerably smaller, the reason being twofold. First, their faint nature in the rest-frame UV makes optical spectroscopic follow-up challenging. Second, NIR spectroscopic follow-up (e.g., Kriek et al. 2006) is time-consuming due to the lack of NIR Multi-object spectrographs and the brightness of the night sky at m. Especially the number of spectroscopically confirmed DRGs to date is limited, and their redshifts were often obtained by surveys with other selection criteria (e.g., Reddy et al. 2006; Conselice et al. 2007).
In this paper, we report on optical spectroscopic follow-up of DRGs, extending initial results by van Dokkum et al. (2003, hereafter vD03). The sample is defined in §2. In §3, we give an overview of the observations, followed by a description of the data reduction in §4. Success rate and bias are discussed in §5.1. §5.4 presents the spectroscopic redshift distribution and §6 discusses the quality of photometric redshifts. In §7 we consider how the observed broad-band properties of DRGs at differ from their high-redshift counterparts. Finally, §8 summarizes the paper.
Vega magnitudes are used throughout this paper.
2. Sample selection
2.1. Pure selected sample
During 9 observing runs from February 2002 to November 2003 we obtained optical spectra for NIR-selected galaxies in the following three fields: HDFS, MS 1054–03, and CDFS-GOODS. Very deep and imaging of the 2.5’x2.5’ HDFS (Labbé et al. 2003) and the 5’x5’ field around cluster MS 1054–03 (Förster Schreiber et al. 2006) were obtained as part of the FIRES survey (Franx et al. 2000). The FIREWORKS -band selected catalog containing 10’x15’ imaging of the CDFS-GOODS (Dickinson 2001) in 17 passbands from to MIPS 24 m is presented by Wuyts et al. (2008).
Sources for optical spectroscopy were selected with the simple color criterion (DRGs) and, with lower priority, galaxies with and were placed in the masks. The masks were usually shared with other high-redshift candidates and bright fillers. Finally, 11 sources selected by their flux excess in a narrow-band filter centered at 4190 Å were placed in one of the masks targeting the MS 1054–03 field. In some rare cases, targets were selected with in an older catalog, and have in the final catalog. This explains why objects #1195 and #1458 from vD03 are not part of the DRG sample presented in this paper.
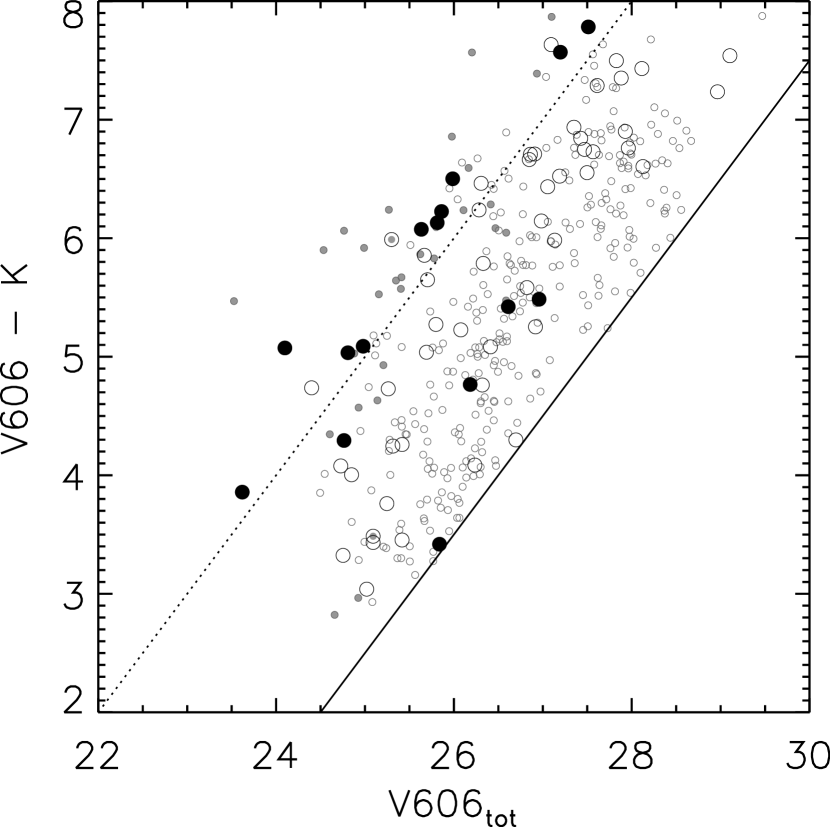
A total of 64 DRGs were placed in the spectroscopic masks, all of them having . Figure 1 illustrates their location (large symbols) in a versus color-magnitude diagram with respect to all DRGs with (small symbols) in the three fields. The figure demonstrates that the DRGs selected for optical spectroscopic follow-up span the whole 5 magnitudes in color occupied by the total DRG sample. Furthermore, they exhibit a similar range of magnitudes, with a median of 26.3.
2.2. DRGs from other surveys
The CDFS-GOODS field is likely the most heavily studied deep field on the sky. Several spectroscopic surveys have been conducted, each with their own selection criteria, resulting in a vast database of spectroscopic redshifts from nearby to the most distant currently attainable. We cross-correlated our FIREWORKS -band selected catalog for the CDFS field with an up-to-date list of reliable redshifts, most of which were provided by GOODS-FORS2 (v3.0, Vanzella et al. 2008), the K20 survey (Mignoli et al. 2005), the VVDS survey (Le Fèvre et al. 2004), the CXO survey (Szokoly et al. 2004), the GMASS survey (Cimatti et al. 2008), and Fadda et al. (in prep). For each DRG with a matching object within a (reasonably large) search radius of , we checked the reliability of both the redshift identification and the cross-correlation by eye, resulting in a list of 30 additional DRGs with spectroscopic confirmation (see Table 1).
Since different photometric criteria were applied to select these objects (e.g., an X-ray selection for the CXO survey), the spectroscopically confirmed DRGs in the literature are not necessarily representative for the whole population of galaxies with . We therefore decide to mark them throughout the paper as having spectroscopic redshifts, but treat them as a seperate class, i.e., they are not taken into account to compute the fraction of interlopers or to estimate the AGN fraction based on the optical spectra. We note that Reddy et al. (2006) present optical spectroscopy for 19 DRGs in the GOODS-North field, but all of them were selected by optical (BM/BX or LBG) color criteria. Similarly, the spectroscopically confirmed DRGs in the Extended Groth Strip presented by Conselice et al. (2007) all stem from the R-band selected DEEP2 survey (Davis et al. 2003).
3. Observations
A variety of optical spectrographs on 8-10m class telescopes was used to identify redshifts of the optically very faint DRGs: the Low Resolution Imaging Spectrograph (LRIS, Oke et al. 1995) and DEIMOS (Faber et al. 2003) on the W.M. Keck Telescope, FORS2 (Nicklas et al. 1997) on VLT and GMOS (Hook et al. 2003) on Gemini South. An overview of the spectroscopic observations is presented in Table 3.
Specifications for the February 2002 run, targeting the MS 1054–03 field with LRIS, are described by vD03. During the other LRIS runs, the 400 lines mm-1 grism (3400 Å blaze) was used on the blue arm and the 400 lines mm-1 grating (8500 Å blaze) on the red arm. The D680 dichroic was used in January 2003, whereas in March and November 2003 the D560 dichroic was inserted. The total exposure time with LRIS, spread over 2 masks in MS 1054–03 and one in CDFS, amounted to 30.5 ks. Series of 3 or 4 exposures (typically 1800 s each), dithered in steps along the slit, enabled a more efficient sky subtraction.
In January 2003, we observed MS 1054–03 with DEIMOS using a 600 lines mm-1 grism in conjunction with the gg495 order-blocking filter. The exposure time was 18 ks. Two other masks, containing a handful of objects as fillers, were exposed for 36.24 ks altogether. For the latter the grism was blazed at 7700 Å and the og550 filter was inserted. Similar to the LRIS observations, we dithered along the slit.
FORS2 observations with the grism GRIS_300V, partly in combination with filter gg375, took place in September 2002, December 2002, March 2003 and October 2003. A total of 88.37 ks exposure time was spread over masks in the HDFS, MS 1054–03 and the CDFS. The same dithering strategy as for the LRIS spectroscopy was used. In September 2003, we observed the HDFS with the GMOS spectrograph on Gemini South. In order to allow for smaller slit lengths and consequently a larger number of objects in the mask, no dithering was applied along the slit. Instead, a 600 lines mm-1 grating was blazed at 4500 Å during half of the exposures and at 4530 Å during the second half. For all DRGs observed with GMOS we obtained 28.8 ks total exposures. One red galaxy was exposed for an additional 9.6 ks as a filler in a mask with optically brighter objects.
Using the described instrument settings, we obtained spectra for a total of 64 DRGs. No slits containing DRGs were lost due to failures in the reduction process or other technical problems. Exposure times per object varied from a minimum of 7.9 ks to a maximum of 75.34 ks. In the course of the 9 observing runs seeing conditions were highly variable, ranging from to , with a typical value of . The 1 to 1.1 wide slits gave a typical resolution of 7.5 Å, 3.6 Å, 10.5 Å and 4.6 Å (FWHM) for LRIS, DEIMOS, FORS2, and GMOS respectively.
4. Reduction
Multi-object spectroscopic data obtained by LRIS, DEIMOS, FORS2 and GMOS generally undergo the same reduction steps. For a detailed description of the standard LRIS reduction process, we refer the reader to van Dokkum & Stanford (2003). Briefly, the observations were divided in sessions of four dithered exposures. We used standard IRAF tasks to subtract the bias and apply the flatfielding and fringe correction to each of the slit exposures. Next, cosmic rays were cleaned and skylines subtracted. The wavelength calibration was based on arc lamp images, and we used the location of a bright skyline to apply a zero-point correction. Finally, the 4 reduced slit exposures were aligned, averaged, and the S-distortion was removed.
The part of the slit where the target object (and possibly a second object) is located, needs to be masked during several reduction steps. It is of great importance that the correct part of the slit is masked. As the NIR-selected galaxies are extremely faint in the optical, it is impossible to measure their positions in the slit on the raw science frames. We determined the object position in the slit from the mask design and verified the predicted position for bright filler objects on the raw science frames. The maskwidth was set to .
In the case of the GMOS run, where no dithering was applied, the use of 2 gratings blazed at 4500 Å and 4530 Å helped to distinguish hot pixels (at fixed CCD position) from real spectral features (at fixed wavelength). Nevertheless, the lack of dithering resulted in a lower quality of the spectra. Ten out of 64 DRGs targeted by our survey were observed only with GMOS.
5. Results from optical spectroscopy of DRGs
5.1. Redshift measurements, success rate, and bias
DRGs, while prominent in the NIR, are generally very faint at optical wavelengths, which probe their rest-frame UV emission. The median magnitude of all DRGs targeted by our spectroscopic survey is 26.3, and that of the subsample for which a redshift was successfully identified is 25.8. Given their faint nature in the rest-frame UV, it comes as no surprise that continua, if detected, have a too low signal-to-noise ratio to allow for redshift identifications based on absorption lines. Therefore, all spectroscopic redshifts for DRGs in our sample are based on emission lines. We measured their central wavelength using the IRAF SPLOT task. In cases where only a single emission line was detected, we use the following arguments to favor Ly over [OII]3727 as identification: the presence of a break (lower continuum on the blue side of the spectral feature), and absence of features at the wavelength where one would expect H and [OIII]5007 if the emission line were [OII]3727. The typical redshift uncertainty is , as estimated from the dispersion of repeated SPLOT measurements of emission line wavelengths of galaxies whose emission line(s) were detected in multiple independent observations.
Out of 64 galaxies satisfying the DRG criterion without further selection bias, the optical spectroscopic follow-up resulted in 14 redshift identifications (a success rate of 22%). Furthermore, NIR spectroscopy with NIRSPEC (McLean et al. 1998) on the W. M. Keck Telescope presented by van Dokkum et al. (2004) provided a redshift for one targeted DRG that did not show emission lines in its optical spectrum. The 15 redshifts for purely selected DRGs are listed in Table 4. Spectroscopic redshifts obtained for 49 non-DRGs during our spectroscopic campaign are listed in Table 2.
We investigate a possible bias of the subsample of DRGs with a successful redshift determination in Figure 1. The 15 spectroscopically confirmed galaxies that were selected purely on the basis of their red () color are plotted with large filled circles. The other DRGs targeted by our survey are marked with large empty circles. With smaller circles, we plot all other DRGs with in the observed fields (small empty circles) and the subsample for which a redshift was obtained by other spectroscopic surveys (small grey circles). The successful targets in our spectroscopic campaign of DRGs are biased toward brighter magnitudes in both and with respect to both the whole spectroscopically observed sample and the complete sample of DRGs in the three considered fields.
One could expect a bias toward brighter magnitudes based on signal-to-noise arguments. However, the possible presence of emission lines makes the relation between success rate and broad-band flux less direct. A redshift may be more easily obtained from a faint emission line spectrum than from a brighter absorption spectrum. We discuss the spectral types in §5.2. Remarkably, Figure 1 suggests a larger dependence of the success rate on the magnitude than on the magnitude, even though the spectra were obtained in the optical. Out of the 10 (20) brightest targeted DRGs in , a redshift was successfully derived from the optical spectra for 60% (45%) of them. Considering the brightest 10 (20) targets in , the success rates drop to 50% (25%). As noted before, all redshifts were based on the presence of emission lines. Although caution should be taken due to small number statistics and variable seeing conditions between the observing runs, this might hint toward an increasing prevalence of DRGs with Ly emission with brighter -band flux.
5.2. Spectral types
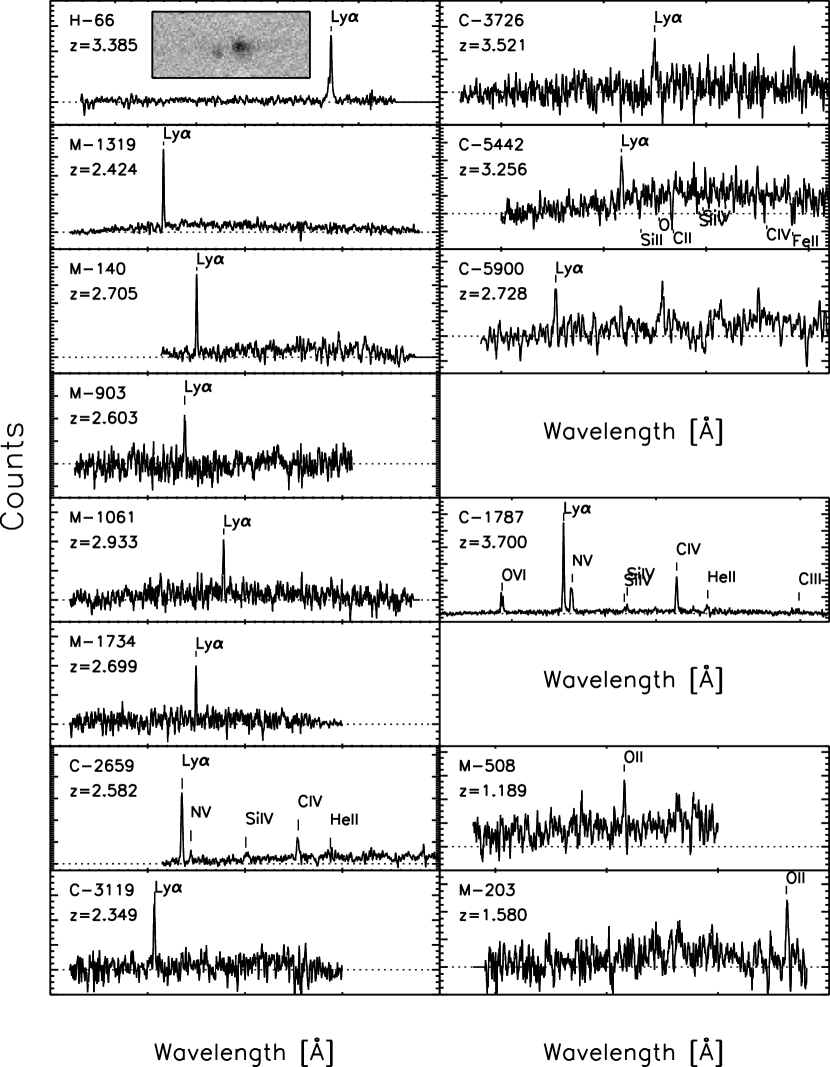
Figure 2 presents the 1D spectra of our successful redshift identifications. As stated in §5.1, continua, if detected, have a very low signal-to-noise ratio. Since all spectroscopic redshifts for DRGs in our sample are based on emission lines, we should keep in mind that we are likely dealing with a biased representation of the whole population of galaxies with . At least 22% of DRGs show line emission bright enough to be detected in several hours exposure time on a 8-10 m telescope. The remaining sources may lack emission lines, or have a redshift that places the emission lines outside the covered wavelength range (see §5.4). We note that, for a sample of K-bright galaxies at , many of which are DRGs, Kriek et al. (2006) found that % lack emission lines in their NIR spectra (equivalent width H 10 Å).
Galaxies M-203 and M-508 show [OII]3727 in emission at . All other spectra presented in Figure 2 feature Ly in emission, possibly in combination with interstellar absorption lines (C-5442) or confirmed by NV, SiIV, CIV and other emission lines indicating the presence of an AGN (C-1787, C-2659). The presence of Ly indicates that at least a quarter of the DRGs must host regions of star formation that are not heavily obscured, complementary to an old underlying or dusty young population that according to SED modeling (e.g., Labbé et al. 2005; Wuyts et al. 2007; Williams et al. 2009) is responsible for their red rest-frame optical color. Differences between the rest-frame UV and rest-frame optical morphologies of DRGs also indicate that these galaxies do not have homogeneous stellar populations (Toft et al. 2005).
As illustrated by the inset 2D GMOS spectrum of H-66 in Figure 2, a smaller feature is visible near the Ly emission line of the target, offset from H-66 in the spatial direction by and in the wavelength direction by 13.7 Å. The relatively high dispersion of GMOS allows for an accurate measurement of the emission line centers: 5330.8 Å (H-66) and 5317.1 Å (serendipitous object). Interpreting both lines as Ly at identical cosmological distance, the shift in wavelength corresponds to a relative velocity of km s-1. At the projected spatial offset corresponds to 2.6 kpc.
Ly at 4781 Å was detected in both the LRIS and 2 FORS2 spectra of M-1061. However, the spectrum is offset by from the predicted position in the slit as calculated from the center of the K-band flux. An identical offset is measured between the centers of flux on the - and -band images. Whether the optical and NIR light correspond to different parts of the same galaxy, or come from physically unrelated sources, remains uncertain. NIR spectroscopy could confirm the redshift of the DRG unambiguously if H is detected at m. At the offset of corresponds to 11.6 kpc. We verified that our results would not be affected by excluding M-1061 from our spectroscopic redshift sample.
C-1787 was also observed by Norman et al. (2002). These authors found that at , C-1787 was the most distant type-2 QSO known at the time of discovery, showing a bright X-ray counterpart in the 1 Ms Chandra imaging of the CDFS. The detection of OVI, Ly, NV, SiIV, NIV, CIV, HeII, and CIII in our FORS2 spectrum of the source confirms its nature.
5.3. AGN fraction
Interpreting a detection of CIV in emission as evidence for an AGN, we find active nuclei in 13% of the DRGs with spectroscopic redshifts. Under the assumption that all DRGs without redshift identification lack emission lines in their spectra, the estimated (unobscured) AGN fraction among the observed DRGs could be as low as . For comparison, 4 out of 28 (14%) of our spectroscopically observed DRGs in the CDFS have a X-ray detection in the 1Ms Chandra exposure on that field (Giacconi et al. 2002). The X-ray detected fraction among all DRGs with in the CDFS amounts to 9%. The estimated AGN fraction based on our optical spectroscopy is surprisingly low compared to the AGN fraction of 20 - 30% implied by recent multi-wavelength studies by Reddy et al. (2005), Papovich et al. (2006), and Daddi et al. (2007). This might imply a prevalence of obscured AGN among DRGs.
5.4. Redshift distribution
We next discuss the distribution of spectroscopic redshifts obtained for DRGs. Three questions need to be addressed. How efficient is the DRG selection criterion to isolate galaxies at , for which it was designed? What is the typical redshift of DRGs? And to what range of redshifts are they confined?
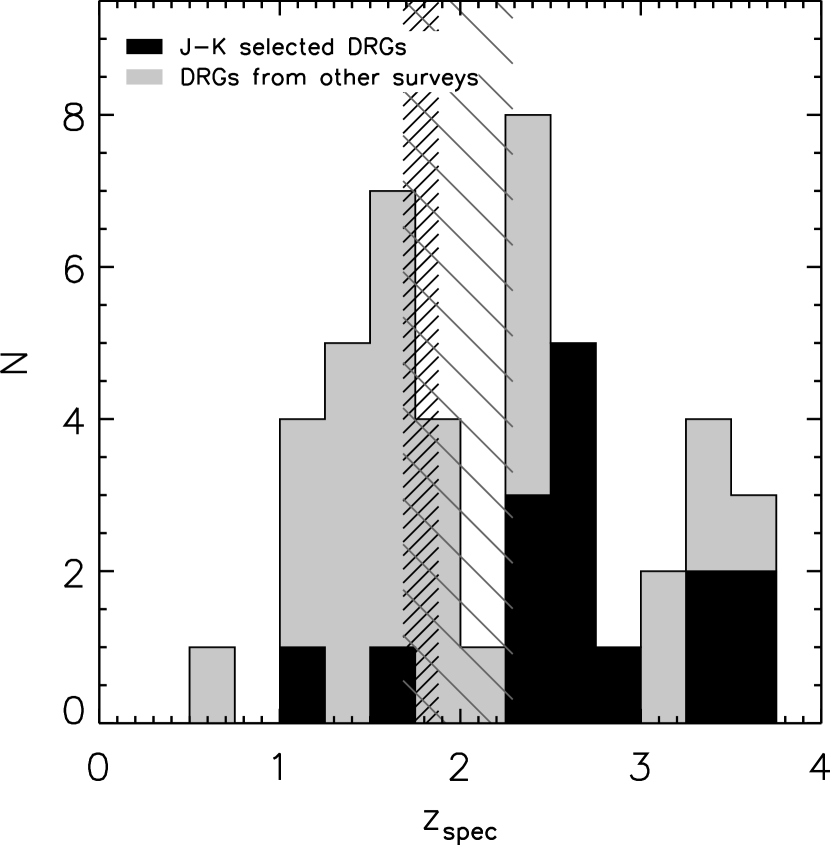
The solid histogram in Figure 3 shows the redshift distribution of spectroscopically confirmed DRGs from our purely selected sample. The closely hatched bar at marks the region in redshift space where spectroscopic confirmation with LRIS is complicated because for galaxies at these redshifts [OII]3727 lies redward of the covered wavelength range while Ly has not entered the blue sensitive region of the detector yet. Since optical spectroscopic surveys of faint galaxies often rely on these relatively bright emission lines as sole redshift indicators, we caution that our spectroscopically confirmed sample may be biased against galaxies in this redshift range, even if they have significant [OII] or Ly line emission. The corresponding region for the FORS2 spectrograph, whose sensitivity in the blue reaches down to Å, is indicated with the widely hatched area. Two out of 15 sources (13%) are located below , at and . The median of the purely selected DRGs lies at with a distribution ranging to .
Considering the DRGs whose redshifts were obtained as part of other surveys, we find that all those with a X-ray detection (Szokoly et al. 2004) lie above . Cross-correlation with the K20 survey ( selected), the VLT/FORS2 survey ( and selected), and a sample of -selected red galaxies by Roche et al. (2006) added 9 extra low-redshift () interlopers. Cross-correlation with NIR spectroscopy of -selected sources by Kriek et al., IRS spectroscopy of 24 m-selected sources by Fadda et al. (in prep), and optical spectroscopy of 4.5 m-selected sources by the GMASS survey added 14 spectroscopically confirmed DRGs in the redshift range . Several of the Fadda et al. (in prep) sources lie in the ’no man’s land’ of optical spectroscopy (hatched bars in Fig. 3). No bias against these redshifts is present in their sample since the redshifts were identified from MIR spectra. Finally, applying the color selection to spectroscopic samples of the MUSYC survey and VLT/VIMOS survey (Popesso et al. 2009) resulted in 3 more spectroscopically confirmed DRGs at . Combining the spectroscopic redshifts from our and other surveys, we find that the spectroscopically confirmed DRGs at have a median -band magnitude that is 0.7 magnitude brighter and a median magnitude that is 0.7 magnitude fainter than those at . A similar trend is found when studying the full DRG sample (including those that only have a photometric redshift estimate, see §7). Our result is in qualitative agreement with Conselice et al. (2007) who studied a sample of bright NIR-selected DRGs. Using a combination of photometric redshifts and spectroscopic redshifts from the DEEP2 survey, the latter being -band selected and reaching to , they conclude that at the bright end () 64% of the DRGs in their sample are located at . Quadri et al. (2007) also found that their (photometric) redshift distribution of DRGs shifts toward lower redshift when imposing a brighter -band cut.
We note that the two low-redshift interlopers from our survey are the faintest in of all spectroscopically confirmed DRGs. The suggested -band dependence of the success rate to identify redshifts (see §5.1) is thus not trivially related to a redshift dependence of the success rate.
We caution that biases against galaxies without emission lines, and galaxies in the ’no man’s land’ of optical spectroscopy indicated with the hatched bars in Fig. 3 might affect the presented redshift distribution. Therefore, we return to the questions raised at the start of this section in §7, using photometric and spectroscopic redshifts for a complete DRG sample.
6. Photometric redshifts
In order to better address the observed and intrinsic properties, and fraction of low-redshift () DRGs, we complement the spectroscopic sample presented above with photometric redshift estimates for the remaining DRGs in the HDFS, MS 1054–03, and the CDFS. Although photometric redshifts have been tested for optically-bright galaxies (Wuyts et al. 2008; Brammer et al. 2008), the number of DRGs with redshifts in these fields has been very limited. The reliance on photometric redshifts has been one of the main uncertainties in, e.g., the results on the mass assembly over cosmic time (Marchesini et al. 2009). In this section, we assess the reliability of published photometric redshifts for these fields, focussing primarily on DRGs. We first summarize the method and templates used to estimate redshifts from broad-band photometry. Next, we analyse the quality of the photometric redshifts by comparison to the available spectroscopic redshifts.
6.1. Method and template sets
Using the publicly available code EAZY111Code and documentation are available at http://www.astro.yale.edu/eazy (Brammer et al. 2008), photometric redshifts were derived for all -band selected sources in the HDFS, MS 1054–03, and the CDFS. Briefly, the program fits a non-negative linear combination of synthetic templates to the -to-8 m broad-band photometry. Using the -band magnitude as a prior, and applying a template error function that downweights the rest-frame UV and rest-frame NIR of the templates in the fit, one obtains a redshift probability distribution. We adopt as best estimate the value of the redshift marginalized over this probability distribution (see Eq. 5 in Brammer et al. 2008), and the confidence intervals are derived from the same distribution.
Our template set consists of 6 principal components that, in superposition, span the entire range of galaxy colors. The 6 templates were constructed from PÉGASE models (Fioc & Rocca-Volmerange 1997) as described by Brammer et al. (2008), and are identical to those used by, amongst others, Wuyts et al. (2008), Williams et al. (2009), Marchesini et al. (2009), and Damen et al. (2009).
6.2. Quality of photometric redshifts
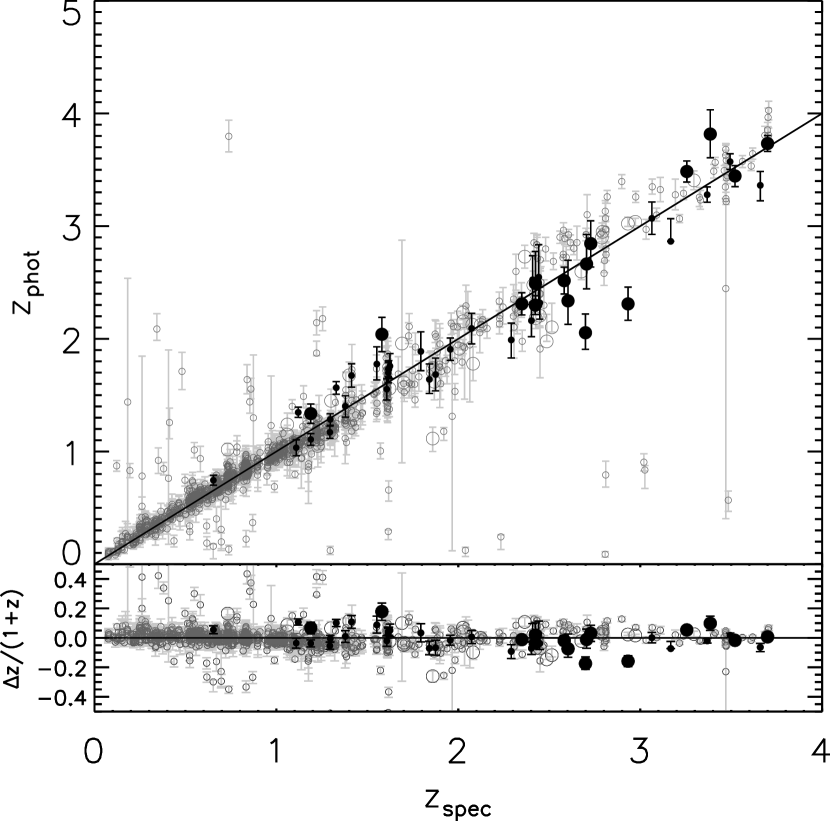
We quantify the performance of the photometric redshift code EAZY by Brammer et al. (2008) by a direct comparison with the available spectroscopic redshifts (see Figure 4). DRGs are marked in black, with large symbols representing objects targeted by our spectroscopic survey. Galaxies with are plotted in grey. Their spectroscopic redshifts are compiled from the literature on the 3 fields, carefully cross-correlating galaxies from the spectroscopic surveys to objects in the -band selected catalogs and conservatively limiting ourselves to those sources with highest quality . The non-DRGs for which we measured redshifts during our survey (Table 2) are also plotted in grey.
Ideally, one algorithm and set of templates provides simultaneously accurate redshift estimates for galaxies of different types and at a range of cosmological distances. Here, we focus on the quality of DRGs, but place it in context by comparing the distribution of for DRGs to that of the whole population of galaxies and the subsample at .
The results are quantified with 3 statistical measures in Table 5: the median of quantifies systematic offsets, the normalized median absolute deviation (equal to the rms for a gaussian distribution) is a measure of scatter robust against outliers. Third, we list the fraction of catastrophic outliers ().
We find a tight correlation between and for the DRGs, without any systematic offset, and characterised by a , depending on the precise sample definition. There are no catastrophic outliers among the DRGs. It is reassuring that, despite the lack of AGN templates, the template set performs equally well for those DRGs with an X-ray detection as for the others. This might mean that the optical-to-NIR SEDs of these DRGs with an X-ray detection is dominated by stellar light, and that the AGN is obscured.
Considering all 1517 galaxies with a spectroscopic redshift, 83% (90%) of which lie below , we again find a small scatter () and no systematic offsets. The fraction of catastrophic outliers is small, 3% of all galaxies has . A third of these have a value of the quality parameter (see Brammer et al. 2008), whereas less than 2% of the sources with was flagged with . The quality of photometric redshifts remains high, even for the subsample of galaxies at , where .
We conclude that a similar high quality of photometric redshifts is reached for the spectroscopically confirmed DRGs as for the total galaxy sample with spectroscopy. However, as noted earlier, the subsample of DRGs with spectroscopic confirmation is biased toward sources with emission lines. NIR multi-object spectrographs that will come on-line soon will be able to establish the accuracy for the DRG sample as a whole in a time-efficient manner, targeting either rest-frame optical emission lines (e.g., Kriek et al. 2007) or Balmer/4000 Å breaks in the continuum (Kriek et al. 2006).
7. The nature of low-redshift DRGs
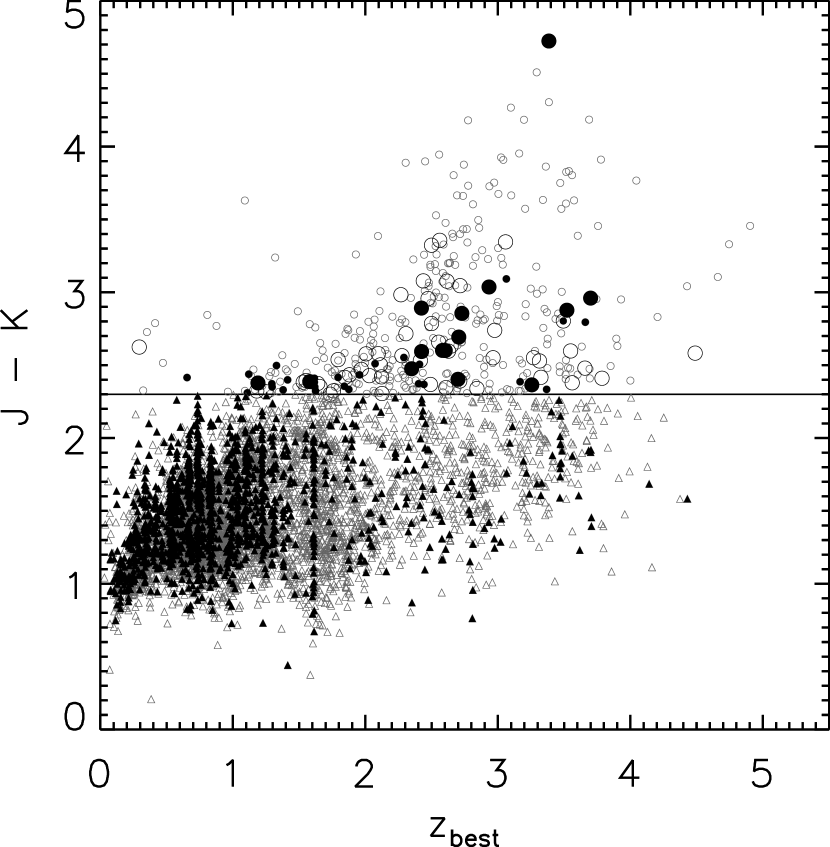
Having established confidence in the estimates for DRGs, we can now revisit the questions raised in §5.4 (what is the typical redshift and redshift range of galaxies selected as DRGs, and how efficient is the criterion at selecting galaxies), and in addition address how the low-redshift DRGs stand out with respect to their high-redshift counterparts. To this purpose, we plot the color of all galaxies with in the considered fields versus (empty symbols), or (filled symbols) when available (Figure 5). The median redshift of DRGs in this combined spectroscopic and photometric sample is , with the central 68% of DRGs located in the redshift interval . The efficiency of the criterion in selecting galaxies above is found to be 74%. The efficiency progressively increases with redder color. Only 11% (2.6%) of the galaxies with 2.6 (2.9) was assigned a redshift below . Less than half of the DRGs at have a color that is consistent at the level with being photometrically scattered into the DRG selection window, making it unlikely that all of the low-redshift interlopers are due to photometric uncertainties. It is evident from Fig. 5 that the high efficiency of the DRG criterion to select galaxies does not mean that all of the -selected galaxies at have such red colors. The fraction of galaxies that are DRGs increases with stellar mass (Wuyts et al. 2007) and reaches 69% at masses above (van Dokkum et al. 2006).
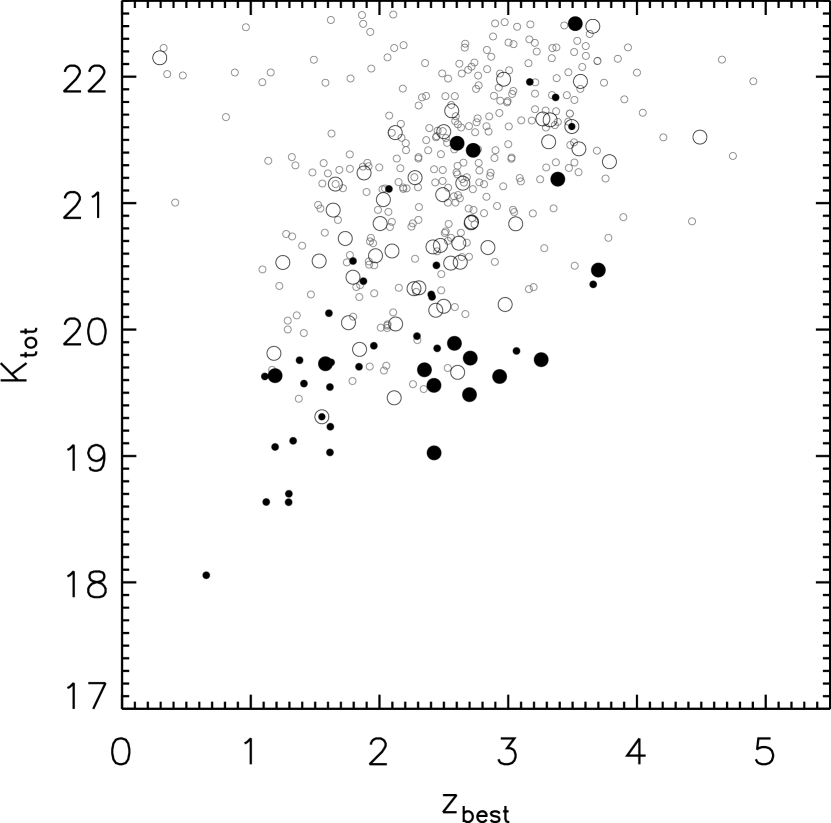
We now proceed to examine the nature of DRGs at . First, we consider the observed -band magnitude of DRGs as a function of redshift (Figure 6). Apart from the spectroscopically confirmed redshifts from our (large filled circles) and other (small filled circles) surveys, we plot the other DRGs (empty circles) in the considered fields using their photometric redshift estimates. Both the spectroscopic and the photometric sample of DRGs show a correlation between -band magnitude and redshift. In our sample to , we find a median for DRGs, compared to a median for DRGs. Consequently, the fraction of low-redshift () DRGs increases toward brighter -band magnitudes, consistent with Quadri et al. (2007).
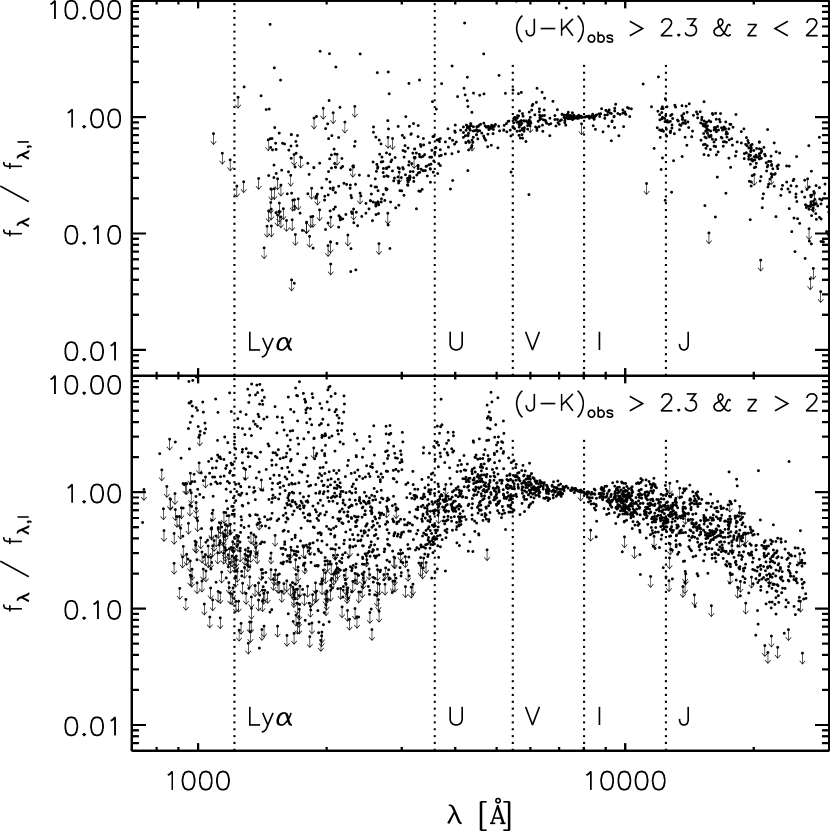
In order to investigate the difference in intrinsic properties between low- and high-redshift DRGs, we plot their rest-frame SEDs, normalized to the rest-frame -band flux, in Figure 7. Although satisfying the same observed color criterion (), the populations at low- and high redshift show markedly different rest-frame SED shapes. The low-redshift DRGs show low flux levels in the UV and a positive slope of the SED at the rest-frame -band. The high-redshift DRGs instead show a wide range in rest-frame UV slopes and have SEDs with a declining slope at the rest-frame -band (see also Förster Schreiber et al. 2004).
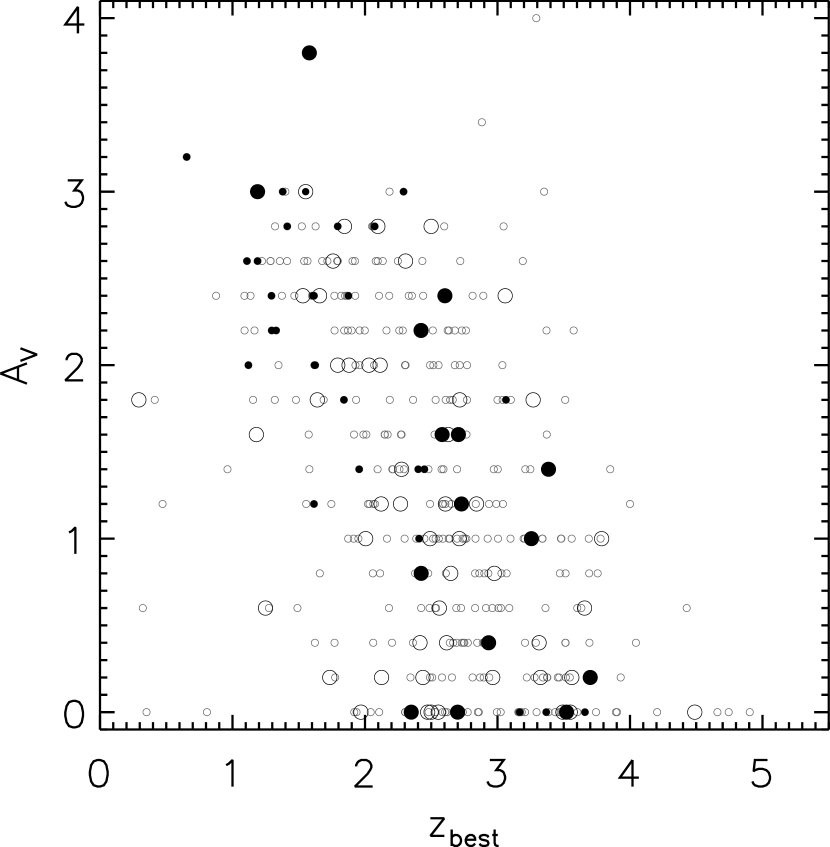
An interpretation of the difference in rest-frame SED shapes is provided by modeling of the optical-to-MIR SEDs using the Bruzual & Charlot (2003) stellar population synthesis code following the procedure described by Wuyts et al. (2007), keeping the redshift fixed to the , or when available. A maximal visual extinction of magnitudes was allowed during the fit, adopting a Calzetti et al. (2000) attenuation law. Wuyts et al. (2007) demonstrated that the inclusion of IRAC photometry (available for all DRGs in our sample) helps to break the age-dust degeneracy and to constrain the amount of extinction in red galaxies at . The estimated extinction is plotted versus redshift in Figure 8. Although DRGs at with several magnitudes of extinction in the V-band do exist, a trend of with redshift is significant at the 99.9% level, both for the total sample and the subsample with spectroscopic redshifts. The median dust extinction of DRGs is , compared to a median value of for the DRGs to the same limit. The imposed K-band limit is at least partly responsible for the paucity of DRGs with at in our sample. We tested this by taking the best-fit templates for the most obscured () DRGs at , and computing the observed -band magnitude and color when redshifting the templates out to (3.5). The redshifted dusty galaxies still satisfy the DRG criterion, but at (3.5) they drop out of our -limited sample in 64% (85%) of the cases. The lack of low-redshift DRGs with small amounts of extinction is real, and not influenced by such a selection effect.
We note that more than 82% of the DRGs at would also be picked up by the selection criterion for Extremely Red Objects (EROs, McCarthy et al. 2001). This fraction drops to about 58% for the DRGs at higher redshifts. Based on Keck spectroscopy of selected EROs, Doherty et al. (2005) inferred a dominant old stellar population for 75% of the ERO sample, being responsible for their red color. Based on our SED modeling we conclude that, with the additional constraint of , one preferentially selects those EROs whose large dust content is responsible for the red slope of the SED over a large wavelength range.
8. Summary
In this paper, we presented optical spectroscopic follow-up for a sample of Distant Red Galaxies with in the fields HDFS, MS 1054–03, and CDFS. Redshifts were identified for a total of 15 out of 64 of the observed DRGs. An additional 30 DRGs, though not necessarily representative for that population, are spectroscopically confirmed by other surveys in the CDFS. In addition, we release spectroscopic redshifts of 49 non-DRGs (half of which at ), selected from the same fields.
Using 8-10m class telescopes under varying seeing conditions, we obtain a modest success rate of 22% only for the DRGs, increasing toward brighter and especially magnitude. Emission line spectra are more easily identified, meaning that the spectroscopic sample is biased toward those sources with at least some unobscured radiating gas present. Apart from Ly, interstellar absorption lines are detected in one and emission lines typical for AGN activity in two of the high-redshift DRGs. With only 2 objects at in the purely selected sample, we confirm that the DRG criterion is an efficient means to isolate galaxies at , with the redshift distribution of the purely -selected spectroscopically confirmed sample peaking around .
We use the total sample of 45 spectroscopically confirmed DRGs to address the quality of the EAZY photometric redshift code developed by Brammer et al. (2008). The scatter in is small (), and the comparison shows no systematic offsets. This is true, irrespective of whether we restrict the sample to DRGs at or not. The DRGs have a similar quality as what is measured for all 1517 galaxies with spectroscopic confirmation in the considered deep fields, and as the subsample of 145 galaxies at .
Including DRGs with photometric redshifts, we find that the median of the DRG redshift distribution is , and the efficiency of the DRG criterion to select galaxies at is 74% for our sample to . DRGs at redshifts below are significantly more extincted by dust than those at higher redshifts. In observed properties, they are generally characterized by having brighter magnitudes (0.7 mag brighter in the median than DRGs to the same limit), and colors close to . SED modeling implies a median dust extinction for DRGs that is as high as .
We conclude that the DRG criterion selects preferentially galaxies at , but also picks up lower redshift sources that are characterized by different SED shapes and typically brighter -band magnitudes. Such biases can be avoided by selecting galaxies based on their rest-frame properties. Such a rest-frame selection requires very good multi-wavelength photometry and accurate photometric redshifts.
We thank Lin Yan, Dario Fadda, Mariska Kriek, Jaron Kurk, Andrea Cimatti and the GMASS consortium for providing their spectroscopic redshift lists, and Gabe Brammer for his support with EAZY. Stijn Wuyts gratefully acknowledges support from the W. M. Keck Foundation. Based on observations carried out at the European Southern Observatory, Paranal, Chile (Program IDs 169.A-0458, 170.A-0788, 074.A-0709, 275.A-5060, 171.A-3045). Based on observations obtained at the Gemini Observatory, which is operated by the Association of Universities for Research in Astronomy, Inc., under a cooperative agreement with NSF on behalf of the Gemini partnership. Also based on data obtained at the W. M. Keck Observatory, which is operated as a scientific partnership among the California Institute of Technology, the University of California and the National Aeronautics and Space Administration. The Observatory was made possible by the generous financial support of the W. M. Keck Foundation.
References
- (1) Adelberger, K. L., Steidel, C. C., Shapley, A. E., Hunt, M. P., Erb, D. K., Reddy, N. A.,& Pettini, M. 2004, ApJ, 607, 226
- (2) Brammer, G. B., van Dokkum, P. G.,& Coppi, P. 2008, ApJ, 686, 1503
- (3) Bruzual, G.,& Charlot, S. 2003, MNRAS, 344, 1000 (BC03)
- (4) Calzetti, D., et al. 2000, ApJ, 533, 682
- (5) Cappellari, M., et al. 2009, ApJ, 704, L34
- (6) Cimatti, A., et al. 2008, A&A, 482, 21
- (7) Conselice, C. J., et al. 2007, ApJ, 660, 55
- (8) Daddi, E., Cimatti, A., Renzini, A., Fontana, A., Mignoli, M., Pozzetti, L., Tozzi, P.,& Zamorani, G. 2004, ApJ, 617, 746
- (9) Daddi, E., et al. 2007, ApJ, 670, 173
- (10) Damen, M., Förster Schreiber, N. M., Franx, M., Labbé, I., Toft, S., van Dokkum, P. G.,& Wuyts, S. 2009, in press (astro-ph/0908.1377)
- (11) Davis, M., et al. 2003, SPIE, 4834, 161
- (12) Dickinson, M.,& the GOODS Legacy Team 2001, A&AS, 198, 2501
- (13) Doherty, M., Bunker, A. J., Ellis, R. S.,& McCarthy, P. J. 2005, MNRAS, 361, 525
- (14) Erb, D. K., Shapley, A. E., Pettini, M., Steidel, C. C., Reddy, N. A.,& Adelberger, K. L. 2006, ApJ, 644, 813
- (15) Faber, S. M., et al. 2003, in Iye M., Moorwood, A. F. M., eds, Proc. SPIE, Vol. 4841, Instrument Design and Performance for Optical/Infrared Ground-Based Telescopes. p. 1657
- (16) Fioc, M.,& Rocca-Volmerange, B. 1997, A&A, 326, 950
- (17) Förster Schreiber, N. M., et al. 2004, ApJ, 616, 40
- (18) Förster Schreiber, N. M., et al. 2006, AJ, 131, 1891
- (19) Franx, M., et al. 2000, The Messenger, 99, 20
- (20) Franx, M., et al. 2003, ApJ, 587, L79
- (21) Giacconi, R., et al. 2002, ApJS, 139, 369
- (22) Hook, I., et al. 2003, SPIE, 4841, 1645
- (23) Kriek, M., et al. 2006, ApJ, 645, 44
- (24) Kriek, M., et al. 2007, ApJ, 669, 776
- (25) Kurk, J., et al. 2009, A&A, 504, 331
- (26) Labbé, I., et al. 2003, AJ, 125, 1107
- (27) Labbé, I., et al. 2005, ApJ, 624, L81
- (28) Le Fèvre, ), O., et al. 2004, A&A, 428, 1043
- (29) Marchesini, D., van Dokkum, P. G., Forster Schreiber, N. M., Franx, M., Labbé, I.,& Wuyts, S. 2009, ApJ, 701, 1765
- (30) McCarthy, P. J., et al. 2001, ApJ, 560, 131
- (31) McLean, I. S., et al. 1998, Proc. SPIE, 3354, 566
- (32) Mignoli, M., et al. 2005, A&A, 437, 883
- (33) Nicklas, H., Seifert, W., Boehnhardt, H., Kiesewetter-Koebinger, S.& Rupprecht, G. 1997, SPIE, 2871, 1222
- (34) Norman, C., et al. 2002, ApJ, 571, 218
- (35) Oke, J. B., et al. 1995, PASP, 107, 375
- (36) Papovich, C., et al. 2006, ApJ, 640, 29
- (37) Popesso, P., et al. 2009, A&A, 494, 443
- (38) Quadri, R., et al. 2007, ApJ, 654, 138
- (39) Reddy, N. A., Erb, D. K., Steidel, C. C., Shapley, A. E., Adelberger, K. L.,& Pettini, M. 2005, ApJ, 633, 748
- (40) Roche, N. D., Dunlop, J., Caputi, K. I., McLure, R., Willott, C. J.,& Crampton, D. 2006, MNRAS, 370, 74
- (41) Shapley, A. E., Steidel, C. C., Pettini, M.,& Adelberger, K. L. 2003, ApJ, 588, 65
- (42) Steidel, C. C.,& Hamilton, D. 1993, AJ, 105, 2017
- (43) Steidel, C. C., Giavalisco, M., Pettini, M., Dickinson, M.,& Adelberger, K. L. 1996, ApJ, 462, L17
- (44) Szokoly, G. P., et al. 2004, ApJS, 155, 271
- (45) Toft, S., van Dokkum, P. G., Franx, M., Thompson, R. I., Illingworth, G. D., Bouwens, R. J.,& Kriek, M. 2005, ApJ, 624, 9
- (46) van Dokkum, P. G., et al. 2003, ApJ, 585, 78
- (47) van Dokkum, P. G., et al. 2003, ApJ, 587, L83
- (48) van Dokkum, P. G., et al. 2004, ApJ, 611, 703
- (49) van Dokkum, P. G., et al. 2006, ApJ, 638, 59
- (50) Vanzella, E., et al. 2008, A&A, 478, 83
- (51) Williams, R. J., Quadri, R. F., Franx, M., van Dokkum, P. G.,& Labbé, I. 2009, ApJ, 691, 1879
- (52) Wuyts, S., et al. 2007, ApJ, 655, 51
- (53) Wuyts, S., et al. 2008, ApJ, 682, 985
- (54)
| ID | ra | dec | Source | |
|---|---|---|---|---|
| C-1187 | 53.0603067 | -27.8760705 | 1.875 | Fadda et al. (in prep) |
| C-1191 | 53.1824218 | -27.8753155 | 1.624 | Fadda et al. (in prep) |
| C-1553 | 53.0784636 | -27.8598817 | 3.660 | CXO |
| C-1957 | 53.1988252 | -27.8438850 | 1.615 | Kriek et al.aaSINFONI spectroscopy, December 2006, program 076.A-0464. |
| C-1978 | 53.0716662 | -27.8436585 | 1.956 | Fadda et al. (in prep) |
| C-2239 | 53.0726960 | -27.8342035 | 1.618 | Fadda et al. (in prep) |
| C-2482 | 53.2021505 | -27.8263119 | 1.120 | VLT/FORS2 |
| C-2792 | 53.0667164 | -27.8165291 | 1.413 | VLT/FORS2 |
| C-2855 | 53.1652224 | -27.8140093 | 3.064 | CXO |
| C-3129 | 53.0446457 | -27.8019901 | 0.654 | K20 |
| C-3521 | 53.0759416 | -27.7858175 | 1.379 | Roche et al. 2006 |
| C-3854 | 53.0940038 | -27.7608387 | 2.073 | Fadda et al. (in prep) |
| C-3886 | 53.0228760 | -27.7570050 | 1.189 | VLT/FORS2 |
| C-3968 | 53.1729054 | -27.7444701 | 1.296 | VLT/FORS2 |
| C-3973 | 53.0936462 | -27.7440207 | 3.494 | VLT/VIMOS |
| C-4679 | 53.1133547 | -27.6977781 | 3.168 | VLT/VIMOS |
| C-4712 | 53.0632815 | -27.6996566 | 2.402 | CXO |
| C-4735 | 53.1375292 | -27.7001314 | 2.448 | GMASS (Kurk et al. in prep) |
| C-4982 | 53.1496306 | -27.7113616 | 1.615 | GMASS (Cappellari et al. 2009) |
| C-5097 | 53.0508272 | -27.7137057 | 2.442 | Fadda et al. (in prep) |
| C-5162 | 53.0523044 | -27.7183135 | 1.794 | Fadda et al. (in prep) |
| C-5177 | 53.1070458 | -27.7181950 | 2.291 | CXO |
| C-5257 | 53.0793872 | -27.7208650 | 2.408 | GMASS (Kurk et al. in prep) |
| C-5605 | 53.1205657 | -27.7365600 | 3.368 | MUSYC IMACSbbOptical IMACS spectroscopy by the MUSYC survey from private communication. |
| C-5724 | 53.0963554 | -27.7450675 | 1.607 | GMASS (Kurk et al. 2009) |
| C-5842 | 53.0362490 | -27.7522039 | 1.294 | K20 |
| C-6063 | 53.0732969 | -27.7643758 | 1.841 | Fadda et al. (in prep) |
| C-6070 | 53.0266661 | -27.7652460 | 1.329 | VLT/FORS2 |
| C-6132 | 53.1169241 | -27.7684461 | 1.109 | K20 |
| C-6161 | 53.1655522 | -27.7698397 | 1.552 | GMASS (Kurk et al. in prep) |
| IDaaH- stands for HDFS, M- for MS 1054–03, and C- for CDFS. Objects without ID number are either located outside the area covered by the -selected catalog or are not detected in . | ra | dec | RemarkbbObjects with a narrow-band flux excess at 4190 Å are indicated with NB4190. | |
|---|---|---|---|---|
| H-92 | 338.22568 | -60.569154 | 2.412 | ; |
| H-228 | 338.21679 | -60.561796 | 3.295 | ; |
| H-245 | 338.22862 | -60.561701 | 2.676 | ; |
| H-257 | 338.21121 | -60.557914 | 2.027 | ; |
| H-290 | 338.26335 | -60.558267 | 2.025 | ; |
| H-294 | 338.27042 | -60.558536 | 2.365 | ; |
| H-408 | 338.24993 | -60.551115 | 1.228 | ; |
| H-470 | 338.22038 | -60.554717 | 1.284 | ; |
| H-565 | 338.22220 | -60.544237 | 1.114 | ; |
| H-620 | 338.23714 | -60.536690 | 1.558 | ; |
| H-657 | 338.20360 | -60.531616 | 2.793 | ; |
| H-806 | 338.20579 | -60.540609 | 2.789 | ; |
| H- | 338.25705 | -60.590965 | 0.695 | - |
| H- | 338.27145 | -60.577366 | 0.439 | - |
| H- | 338.27145 | -60.579903 | 0.844 | - |
| H- | 338.28201 | -60.587112 | 0.344 | - |
| H- | 338.25686 | -60.59766 | 2.899 | LBG candidate |
| H- | 338.28486 | -60.57794 | 3.190 | LBG candidate |
| M-147 | 164.23573 | -3.6498842 | 1.265 | ; |
| M-161 | 164.24502 | -3.6475178 | 1.859 | ; |
| M-266 | 164.22595 | -3.6422003 | 2.005 | ; |
| M-303 | 164.21742 | -3.6400908 | 2.486 | ; |
| M-383 | 164.22318 | -3.6365197 | 2.123 | ; |
| M-450 | 164.20416 | -3.6339978 | 0.346 | no coverage; |
| M-713 | 164.24837 | -3.6252800 | 1.700 | ; |
| M-897 | 164.24914 | -3.6203344 | 2.973 | ; |
| M-972 | 164.21320 | -3.6176475 | 2.448 | ; |
| M-1132 | 164.27260 | -3.6095794 | 1.060 | ; |
| M-1155 | 164.22757 | -3.6094061 | 1.622 | ; |
| M-1272 | 164.27786 | -3.6050289 | 0.829 | ; |
| M-1396 | 164.24016 | -3.6010686 | 2.514 | ; |
| M-1450 | 164.24319 | -3.5979289 | 0.622 | ; |
| M-1459 | 164.25297 | -3.5974653 | 2.081 | ; |
| M-1637 | 164.23843 | -3.5876183 | 1.300 | ; |
| M-1728 | 164.26288 | -3.5815978 | 2.93200 | ; |
| M- | 164.23486 | -3.5825150 | 2.428 | NB4190 |
| M- | 164.21390 | -3.5891633 | 2.436 | NB4190 |
| M- | 164.19865 | -3.6408465 | 2.428 | NB4190 |
| M- | 164.22060 | -3.6178541 | 2.422 | NB4190 |
| M- | 164.23906 | -3.5812418 | 2.280 | NB4190 |
| M- | 164.27251 | -3.5855079 | 0.559 | NB4190 |
| M- | 164.21590 | -3.6068938 | 0.119 | NB4190 |
| M- | 164.22655 | -3.6836915 | 0.261 | - |
| M- | 164.22023 | -3.6792324 | 1.086 | - |
| M- | 164.22426 | -3.6761484 | 0.577 | - |
| C-2363 | 53.082743 | -27.831706 | 0.246 | ; |
| C-2472 | 53.093660 | -27.826402 | 0.732 | ; |
| C-2484 | 53.092048 | -27.827811 | 0.731 | ; |
| C-3358 | 53.178065 | -27.792739 | 1.427 | ; |
| Date | Telescope | Instrument | Field | Total exposure time | Instrument settings | Seeing |
|---|---|---|---|---|---|---|
| s | “ | |||||
| February 2002 | Keck | LRIS | MS 1054–03 | 72000 | D680 dichroic | 0.8 - 1.5ppObserving conditions were photometric. |
| blue: 300 line mm-1 | ||||||
| red: 400/8500 Å and 600/1 m grating | ||||||
| September 2002 | VLT | FORS2 | HDFS | 19800 | GRIS_300V, filter gg375 | 0.8 - 2.0ppObserving conditions were photometric. |
| December 2002 | VLT | FORS2 | CDFS | 29700 | GRIS_300V | 1.0 - 2.3ppObserving conditions were photometric. |
| January 2003 | Keck | LRIS | MS 1054–03 | 6800 | D680 dichroic | 0.7 - 0.8 |
| blue: 400/3400 Å grism | ||||||
| red: 400/8500 Å grating | ||||||
| DEIMOS | MS 1054–03 | 18000 | mask1: 600/7300 Å grism, filter gg495 | 0.8 - 1.0 | ||
| 36240 | mask2,3: 600/7700 Å grism, filter og550 | 0.7 - 1.4 | ||||
| March 2003 | Keck | LRIS | MS 1054–03 | 14400 | D560 dichroic | 0.9 - 1.1ppObserving conditions were photometric. |
| blue: 400/3400 Å grism | ||||||
| red: 400/8500 Å grating | ||||||
| March 2003 | VLT | FORS2 | MS 1054–03 | 14400 | GRIS_300V, filter gg375 | 0.6 - 0.9ppObserving conditions were photometric. |
| September 2003 | Gemini-South | GMOS | HDFS | 38400 | B600/4500 Å and B600/4530 Å grating | 0.9 - 1.4 |
| October 2003 | VLT | FORS2 | CDFS | 24470 | GRIS_300V | 0.5 - 2.0ppObserving conditions were photometric. |
| HDFS | 16200 | GRIS_300V | 0.65 - 1.8ppObserving conditions were photometric. | |||
| November 2003 | Keck | LRIS | CDFS | 9300 | D560 dichroic | 0.7 - 1.5ppObserving conditions were photometric. |
| blue: 400/3400 Å grism | ||||||
| red: 400/8500 Å grating |
| IDaaH- stands for HDFS, M- for MS 1054–03, and C- for CDFS. | ra | dec | Remark | |
|---|---|---|---|---|
| H-66 | 338.2713649 | -60.5703250 | 3.385 | has close companion at 2.6 kpc |
| M-140 | 164.2106125 | -3.6508417 | 2.705 | - |
| M-203 | 164.2078833 | -3.6463678 | 1.580 | - |
| M-508 | 164.2299500 | -3.6315592 | 1.189 | - |
| M-903 | 164.1998917 | -3.6207567 | 2.603 | - |
| M-1061 | 164.2394875 | -3.6131875 | 2.933 | optical and NIR flux offset by |
| M-1319 | 164.2775375 | -3.6010592 | 2.424 | - |
| M-1383 | 164.2603167 | -3.6006669 | 2.423 | redshift from NIR spectroscopy |
| M-1734 | 164.2233917 | -3.5811008 | 2.699 | - |
| C-1787 | 53.1243363 | -27.8516408 | 3.700 | also analysed by Norman et al. (2002) |
| C-2659 | 53.1488159 | -27.8211517 | 2.582 | - |
| C-3119 | 53.1231066 | -27.8033550 | 2.349 | - |
| C-3726 | 53.0550864 | -27.7785031 | 3.521 | - |
| C-5442 | 53.1177728 | -27.7342424 | 3.256 | - |
| C-5900 | 53.1080817 | -27.7539822 | 2.728 | - |
| Sample | Median | Percentage of catastrophic () outliers | |
|---|---|---|---|
| DRGs (purely selected) | -0.011 | 0.054 | 0.0 |
| DRGs (purely selected, ) | -0.012 | 0.047 | 0.0 |
| DRGs (all) | 0.001 | 0.056 | 0.0 |
| DRGs (all, ) | -0.014 | 0.048 | 0.0 |
| All galaxies | 0.001 | 0.034 | 3.0 |
| All galaxies | 0.005 | 0.055 | 4.8 |