11email: apushkar@mpifr.de 22institutetext: Pulkovo Astronomical Observatory, Pulkovskoe Chaussee 65/1, 196140 St. Petersburg, Russia 33institutetext: Crimean Astrophysical Observatory, 98688 Nauchny, Crimea, Ukraine 44institutetext: Astro Space Center of Lebedev Physical Institute, Profsoyuznaya 86/32, 117997 Moscow, Russia 55institutetext: Department of Physics, Purdue University, 525 Northwestern Avenue, West Lafayette, IN 47907, USA
Jet opening angles and gamma-ray brightness of AGN
Abstract
Aims. We have investigated the differences in apparent opening angles between the parsec-scale jets of the active galactic nuclei (AGN) detected by the Large Area Telescope (LAT) during its first three months of operations and those of non-LAT-detected AGN.
Methods. We used 15.4 GHz VLBA observations of sources from the 2 cm VLBA MOJAVE program, a subset of which comprise the statistically complete flux density limited MOJAVE sample. We determined the apparent opening angles by analyzing transverse jet profiles from the data in the image plane and by applying a model fitting technique to the data in the plane. Both methods provided comparable opening angle estimates.
Results. The apparent opening angles of -ray bright blazars are preferentially larger than those of -ray weak sources. At the same time, we have found the two groups to have similar intrinsic opening angle distributions, based on a smaller subset of sources. This suggests that the jets in -ray bright AGN are oriented at preferentially smaller angles to the line of sight resulting in a stronger relativistic beaming. The intrinsic jet opening angle and bulk flow Lorentz factor are found to be inversely proportional, as predicted by standard models of compact relativistic jets. If a gas dynamical jet acceleration model is assumed, the ratio of the initial pressure of the plasma in the core region to the external pressure lies within the range 1.1 to 34.6, with a best fit estimate of .
Key Words.:
galaxies: active – galaxies: jets – quasars: general – radio continuum: galaxies1 Introduction
The EGRET telescope onboard the Compton Gamma Ray Observatory (Hartman et al., 1999) provided detections of -ray emission from many extragalactic point sources, most of which were identified with blazars (e.g., Mattox et al., 2001; Sowards-Emmerd et al., 2003). The latter term generally refers to objects classified as flat-spectrum radio-loud quasars and BL Lacs. Although blazars comprise only a few per cent of the overall AGN population, they dominate the extragalactic high-energy sky. A systematic comparison of parsec-scale radio jet structure with -ray emission in AGN has hitherto been problematic and inconclusive due to the limited sensitivity and angular resolution of the EGRET instrument. For example, a recent analysis of a large 6 cm VLBA Imaging and Polarimetry Survey (VIPS; Taylor et al., 2007) has hinted that EGRET-detected blazars might have larger than average jet opening angles, but very poor statistics (only four EGRET/VIPS sources) did not allow the authors to draw a firm conclusion.
On 2008 June 11, the Fermi Gamma-Ray Space Telescope (previously known as GLAST) was successfully launched by NASA with the Large Area Telescope (LAT), a successor to EGRET, onboard. The LAT began operating in August 2008 and has provided -ray observations with greatly improved sensitivity, superior angular resolution, large field of view, and wide energy range from about 20 MeV to over 300 GeV (Atwood et al., 2009). During the first three months of science operations, the LAT has made 205 high-confidence () detections of bright -ray sources, 116 of which were associated with high galactic latitude () AGN (the LAT Bright AGN Sample together with 10 lower-confidence associations: LBAS-ext), as discussed by Abdo et al. (2009a). Their VLBI radio source identifications were reported by Kovalev (2009). The LAT detections of flaring AGN have also triggered a number of multiwavelength (from radio to -ray) campaigns (e.g., Abdo et al., 2009b).
The Fermi era has already heralded a number of important results that link the -ray emission and radio properties of AGN. It has been shown that LAT-detected blazars are brighter and more luminous in the radio domain at parsec scales (Kovalev et al., 2009), have higher apparent jet speeds (Lister et al., 2009c). The LAT-detected blazars also seem to have higher Doppler factors determined from the mm-wavelength variability (Savolainen et al., 2009). The -ray and radio flares are found to appear within a typical timescale of up to a few months and are likely associated with the parsec-scale radio core (Kovalev et al., 2009). In this Letter we continue investigating the relations between -ray brightness and the properties of parsec-scale radio jets from the LBAS-ext list as probed by interferometric observations with the VLBA. Hereafter we refer to the Fermi LAT 3-month bright source list (Abdo et al., 2009a) when using the term LAT-detected.
2 The radio data and source samples

The MOJAVE program (Lister et al., 2009a) is a long-term VLBA program to study the structure and evolution of extragalactic relativistic radio jets in the northern sky. The full monitoring list currently consists of more than 250 sources, and includes a statistically complete, flux-density limited sample of 135 AGN (hereafter referred to as MOJAVE-1). All the MOJAVE-1 sources have J2000 declination and a 15 GHz VLBA correlated flux density Jy (2 Jy for ) at any epoch between 1994.0 and 2004.0. The weaker radio blazars ( Jy) detected by Fermi extend the complete MOJAVE-1 sample to MOJAVE-2.
Although we have analyzed a large portion of the MOJAVE-2 sample, we focus our statistical analysis on a MOJAVE-1 blazar subset (101 quasars and 22 BL Lacs), which is a dominant fraction of the sample (91%). We excluded eight radio galaxies and four optically unidentified objects from the MOJAVE-1 sample. Taking into account the fact that the LBAS-ext list is restricted in galactic latitude (), due to the decrease of the LAT detection sensitivity at low galactic latitude (Abdo et al., 2009a), seven quasars and one BL Lac were excluded from the analysis as having . Of the remaining 115 MOJAVE-1 blazars, 29 are in the LBAS-ext list, corresponding to an overall -ray detection rate of 25%. It is worth noting that the detection rate for BL Lacs is substantially higher (48%) compared to that for quasars (20%) for the MOJAVE-1 sample.
3 Results
The opening angle of a jet in the sky plane can be estimated either by analyzing transverse jet profiles in the image plane, or by model fitting the interferometric visibility data in the (u,v) plane. To increase the robustness of our conclusions we used both methods and compared the results.
3.1 Opening angles from the image plane
We used the 15 GHz naturally weighted MOJAVE111http://www.physics.purdue.edu/MOJAVE VLBA images from the most recent epoch available. This covers the period 2008–2009 for all but two sources. The opening angle of the jet was calculated as the median value of , where is the full width at half maximum (FWHM) of a Gaussian fitted to the transverse jet brightness profile, is the distance to the core along the jet axis, is the beam size along the position angle of the jet-cut, and the quantity is the deconvolved FWHM transverse size of the jet. The direction of the jet axis was determined using the median position angles of all jet components over all the epochs from model fitting (see next section). The slices were taken at 0.1 mas intervals starting from the position of the VLBI core and continuing up to the region in which the jet either substantially curved or became undetectable. The ridge lines for 15 MOJAVE-1 and 6 MOJAVE-2 sources with notably bending jets were approximated by two straight lines. Opening angle values were calculated using only those slices that had a peak of the fitted Gaussian larger than 4 times the rms noise level of the image. In Fig. 1 the 15 GHz total intensity map of 3C 345 (1641+399), together with the deconvolved size and opening angle of the jet as a function of angular distance to the core is shown as an example.
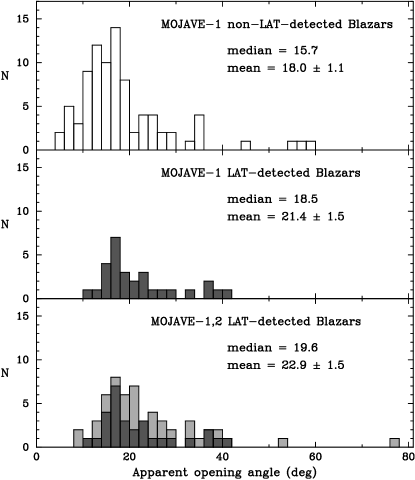
The distributions of measured opening angle are shown in Fig. 2. The distribution for LAT-detected sources is narrower and missing the small opening angle sources if compared to non-LAT-detected sample. A Kolmogorov-Smirnov (K-S) test indicates a probability of only for these two samples being drawn from the same parent population. If we add 27 additional LAT-detected blazars from the extended MOJAVE-2 sample the confidence level increases to 99.9% () and the mean value to (Fig. 2, bottom panel). The jet-slice opening angles are on average larger for the 29 LAT-detected MOJAVE-1 blazars in comparison with the 86 non-LAT-detected ones, with a mean value of versus , respectively. A Student’s T-test confirms that the means are different at 96.1% confidence level for the complete MOJAVE-1 sample and at 99.4% confidence level for the MOJAVE-1,2 sample. The relatively small difference in mean values is due to a significant number of -ray weak sources with very large apparent opening angles. In fact, this is compatible with the findings of Savolainen et al. (2009), who show that there should be a number of -ray weak sources that are viewed nearly end-on and which therefore have very large apparent opening angles. Our results support this. We note that the TANAMI group, on the basis of VLBI analysis of a Southern hemisphere sample of Fermi detected AGN jets, has also found indications of preferentially wider apparent opening angles in LAT-detected sources (R. Ojha et al., in preparation). The calculated values of the apparent opening angles are listed in Table 1222Table 1 is available in electronic form at http://www.aanda.org.
We have studied the effects of a possible bias by BL Lac objects, as discussed by Abdo et al. (2009a), on our results by comparing the apparent opening angle distributions of 22 BL Lacs and 101 quasars from the complete MOJAVE-1 sample. The K-S test indicated no significant difference (). Another check was performed by excluding the BL Lacs from our analysis. In this case, the small set of LAT-detected MOJAVE-1 quasars () did not produce a statistically significant result. However, comparison of the apparent opening angle distribution for LAT-detected versus non-LAT detected quasars in the larger MOJAVE-1+MOJAVE-2 sample led to the following. The distributions are significantly different according to both the K-S and the Student’s T-tests (, ). We conclude therefore that the presence of BL Lacs does not bias our analysis.
At the same time, we found no significant correlation between the apparent jet opening angle and average Fermi LAT 100 MeV – 1 GeV photon flux (Abdo et al., 2009a), since the latter depends on the distance to a source. However, we would expect to see a positive correlation between the apparent opening angle and -ray luminosity, when the -ray energy fluxes become available in the next Fermi data release.
3.2 Opening angles from the plane
The estimates of the opening angle can also be derived from the data in the plane using a model fitting approach. The observed brightness distribution of each source was modeled by a limited number of two-dimensional Gaussian components using the “modelfit” task in Difmap (Shepherd, 1997). The parameters of the models are tabulated by Lister et al. (2009b). We used all available 2336 model components for 115 MOJAVE-1 blazars with galactic latitude . After measuring the opening angle for each jet component, we averaged them to get one value for each epoch, and then averaged over the epochs to obtain a final estimate. The statistical results of the model-fit opening angle distribution analysis are in good agreement with those from the transverse jet profile method, confirming that our conclusions are robust. The median value of the ratio of apparent opening angle derived from jet-cut analysis to that from the model fitting method is 0.9. The apparent opening angle distributions of LAT-detected and non-LAT-detected MOJAVE-1 blazars are different at 99% confidence level, according to a K-S test.
3.3 Intrinsic opening angles
The on-average wider apparent opening angles in LAT-detected sources can be a consequence of (i) their smaller viewing angles (due to a projection effect) and/or (ii) their intrinsically different properties, for example, the presence of spine-sheath structures like those observed in the -ray bright quasar 1055+018 (Attridge et al., 1999), TeV BL Lac object Mrk501 (Pushkarev et al., 2005; Giroletti et al., 2008) and radio galaxy M87 (Kovalev, 2008).
To distinguish between these two possibilities, we have derived the values of the viewing angle and the bulk Lorentz factor for MOJAVE-1 blazars (see Table 1) using the following relations:
where is the fastest measured radial, non-accelerating apparent jet speed from the MOJAVE kinematic analysis (Lister et al., 2009b) and is the variability Doppler factor from the Metsähovi AGN monitoring program (Hovatta et al., 2009). The overlap of the MOJAVE and Metsähovi programs comprises 56 blazars with measured speeds and Doppler factors. Indeed, the viewing angles of 21 LAT-detected sources turned out to be slightly smaller, with mean value of vs. for the non-LAT-detected sources. However, the difference is not statistically significant for this small sample (56 sources compared to 115 in the apparent opening angle analysis) containing a mixture of quasars and BL Lacs. If only quasars are considered, a marginally significant difference () in viewing angle distributions is found between LAT-detected and non-LAT-detected sources (Savolainen et al., 2009). In addition, we have found an indication for BL Lacs to have on-average wider intrinsic opening angles () than those of quasars (). The corresponding distributions are different at confidence levels of 94.6% according to the K-S test, the average values differ with a 96.1% confidence according to the Student’s T-test.

To test the second scenario, the intrinsic opening angles were calculated for the 56 sources (Table 1). The estimated values of this parameter range up to (Fig. 3). A K-S test indicated no significant difference () between the samples of LAT-detected and non-LAT-detected sources, suggesting that the established systematic difference in apparent opening angles is most probably the result of projection effects, i.e., the -ray bright jets are aligned closer to our line of sight.
We have also analyzed the observed dependence between the intrinsic opening angle and Lorentz factor (Fig. 3), which are expected to be inversely proportional according to simple hydrodynamical models of relativistic jets (Blandford & Königl, 1979). Both the gas dynamical model (Daly & Marscher, 1988) and magnetic acceleration models (Komissarov et al., 2007) also predict this relation. The observed dependence was fitted assuming a relation with the coefficient left as a free parameter. The best fit value of was found to be 0.26 rad by fitting the median curve. (Fig. 3, solid line). Even though the flow Lorentz factor and the viewing angle (which is needed to determine ), are both calculated from the same observables ( and ), a Monte Carlo simulation shows that the apparent negative correlation between and is not due to this degeneracy, but is a genuine effect.
In the gas dynamical model of compact relativistic jets suggested by Daly & Marscher (1988), the opening angle of a jet is a function of the Lorentz factor and a ratio of the external pressure to the initial pressure of the plasma in the core region, . We applied this model for different values of (Fig. 3, dotted curves) and were able to constrain the parameter to lie within a range [0.17, 0.96] with the best fit estimate , corresponding to a range of [1.1, 34.6] for with the best fit estimate . Our results confirm those obtained earlier by Jorstad et al. (2005) using a smaller sample of 15 blazar jets.
4 Summary
We have measured the projected jet opening angles on parsec scales for 115 blazars (29 LAT-detected and 86 non-LAT-detected) from the complete flux-density limited MOJAVE-1 sample and for 27 additional LAT-detected sources monitored by the MOJAVE program. The apparent opening angles for -ray bright sources are on average larger than those in -ray weak ones, while the intrinsic opening angle distributions based on smaller samples are statistically indistinguishable. We interpret this as an evidence for -ray bright blazars to have preferentially smaller viewing angles and, consequently, stronger relativistic beaming, which boosts emission in both, the -ray and radio bands. This conclusion is consistent with recently obtained results that show LAT-detected blazars to be brighter and more luminous in radio domain (Kovalev et al., 2009), to have faster jets (Lister et al., 2009c) and higher variability Doppler factors (Savolainen et al., 2009). There is an indication for BL Lac objects to have on-average wider intrinsic opening angles than those of quasars.
The intrinsic opening angle and Lorentz factor are found to be inversely proportional for a sample of 56 AGN jets in agreement with theoretical predictions of simple gas dynamical and magnetic acceleration models. The best approximation of the inferred relation is achieved assuming a ratio of internal and external jet pressure in gas dynamical models of compact relativistic jets.
Acknowledgements.
We would like to thank E. Ros, A. P. Lobanov, K. I. Kellermann, D. C. Homan, M. H. Aller, M. H. Cohen, M. Kadler, and the rest of the MOJAVE team for the usefull discussions. We thank the anonymous referee for useful comments which helped to improve the manuscript. This research has made use of data from the MOJAVE database that is maintained by the MOJAVE team (Lister et al., 2009a). The MOJAVE project is supported under National Science Foundation grant AST-0807860 and NASA Fermi grant NNX08AV67G. T. S. is a research fellow of the Alexander von Humboldt Foundation. T. S. also acknowledges a support by the Academy of Finland grant 120516. Y. Y. K. was partly supported by the Russian Foundation for Basic Research (project 08-02-00545). The VLBA is a facility of the National Science Foundation operated by the National Radio Astronomy Observatory under cooperative agreement with Associated Universities, Inc.References
- Abdo et al. (2009a) Abdo, A. A., Ackermann, M., Ajello, M., & et al. 2009a, ApJ, 700, 597
- Abdo et al. (2009b) Abdo, A. A., Ackermann, M., Ajello, M., & et al. 2009b, ApJ, 699, 31
- Attridge et al. (1999) Attridge, J. M., Roberts, D. H., & Wardle, J. F. C. 1999, ApJ, 518, L87
- Atwood et al. (2009) Atwood, W. B., Abdo, A. A., Ackermann, M., & et al. 2009, ApJ, 697, 1071
- Blandford & Königl (1979) Blandford, R. D. & Königl, A. 1979, ApJ, 232, 34
- Daly & Marscher (1988) Daly, R. A. & Marscher, A. P. 1988, ApJ, 334, 539
- Giroletti et al. (2008) Giroletti, M., Giovannini, G., Cotton, W. D., et al. 2008, A&A, 488, 905
- Hartman et al. (1999) Hartman, R. C., Bertsch, D. L., Bloom, S. D., et al. 1999, ApJS, 123, 79
- Hovatta et al. (2009) Hovatta, T., Valtaoja, E., Tornikoski, M., & Lähteenmäki, A. 2009, A&A, 498, 723
- Jorstad et al. (2005) Jorstad, S. G., Marscher, A. P., Lister, M. L., et al. 2005, AJ, 130, 1418
- Komissarov et al. (2007) Komissarov, S. S., Barkov, M. V., Vlahakis, N., & Königl, A. 2007, MNRAS, 380, 51
- Kovalev (2008) Kovalev, Y. Y. 2008, in Astronomical Society of the Pacific Conference Series, Vol. 386, Extragalactic Jets: Theory and Observation from Radio to Gamma Ray, ed. T. A. Rector & D. S. De Young, 155
- Kovalev (2009) Kovalev, Y. Y. 2009, ApJL, submitted, arXiv:0908.4152
- Kovalev et al. (2009) Kovalev, Y. Y., Aller, H. D., Aller, M. F., et al. 2009, ApJ, 696, L17
- Lister et al. (2009a) Lister, M. L., Aller, H. D., Aller, M. F., et al. 2009a, AJ, 137, 3718
- Lister et al. (2009b) Lister, M. L., Cohen, M. H., Homan, D. C., et al. 2009b, AJ, in press, arXiv: 0909.5100
- Lister et al. (2009c) Lister, M. L., Homan, D. C., Kadler, M., et al. 2009c, ApJ, 696, L22
- Lobanov (1998) Lobanov, A. P. 1998, A&A, 330, 79
- Marscher (2008) Marscher, A. P. 2008, in Astronomical Society of the Pacific Conference Series, Vol. 386, Extragalactic Jets: Theory and Observation from Radio to Gamma Ray, ed. T. A. Rector & D. S. De Young, 437
- Mattox et al. (2001) Mattox, J. R., Hartman, R. C., & Reimer, O. 2001, ApJS, 135, 155
- Pushkarev et al. (2005) Pushkarev, A. B., Gabuzda, D. C., Vetukhnovskaya, Y. N., & Yakimov, V. E. 2005, MNRAS, 356, 859
- Savolainen et al. (2009) Savolainen, T., Homan, D. C., Hovatta, T., et al. 2009, in preparation
- Shepherd (1997) Shepherd, M. C. 1997, in Astronomical Society of the Pacific Conference Series, Vol. 125, Astronomical Data Analysis Software and Systems VI, ed. G. Hunt & H. E. Payne (San Francisco: ASP), 77
- Sowards-Emmerd et al. (2003) Sowards-Emmerd, D., Romani, R. W., & Michelson, P. F. 2003, ApJ, 590, 109
- Taylor et al. (2007) Taylor, G. B., Healey, S. E., Helmboldt, J. F., et al. 2007, ApJ, 671, 1355