Space efficient opposed-anvil high-pressure cell and its application to optical and NMR measurements up to 9 GPa
Abstract
We have developed a new type of opposed-anvil high pressure cell with substantially improved space efficiency. The clamp cell and the gasket are made of non-magnetic Ni-Cr-Al alloy. Non-magnetic tungsten carbide (NMWC) is used for the anvils. The assembled cell with the dimension mm mm is capable of generating pressure up to 9 GPa over a relatively large volume of 7 mm3. Our cell is particularly suitable for those experiments which require large sample space to achieve good signal-to-noise ratio, such as the nuclear magnetic resonance (NMR) experiment. Argon is used as the pressure transmitting medium to obtain good hydrostaticity. The pressure was calibrated in situ by measuring the fluorescence from ruby through a transparent moissanite (6H-SiC) window. We have measured the pressure and temperature dependences of the 63Cu nuclear-quadrupole-resonance (NQR) frequency of Cu2O, the in-plane Knight shift of metallic tin, and the Knight shift of platinum. These quantities can be used as reliable manometers to determine the pressure values in situ during the NMR/NQR experiments up to 9 GPa.
1 Introduction
Application of high pressure is a common method in solid state physics. A reduction of lattice constant under pressure modifies lattice or electronic structure of matters and opens possibility to discover new states of matters. At the same time, apparatus to generate high pressure generally impose experimental constraints due to limited volume of the pressurized space. An easier and frequently used alternative is to utilize the ”chemical pressure” by substituting some elements with other chemically similar elements with different atomic sizes. However, chemical substitutions inevitably introduce structural disorder and electronic inhomogeneity, which often change the properties and the phase diagram of the pure materials. Therefore, it is important to develop space efficient high pressure apparatus to make various experimental techniques accessible to high pressure.
Generally, one has to compromise between demands for larger space and higher pressure. For example, there is an order-of-thousand difference in the available sample space between the piston-cylinder-type cell[1], which can be used to generate pressure less than 4 GPa, and the modified Bridgeman-type cell[2], which can go up to 10 GPa. Thus, easy access to the pressure above 4 GPa is practically restricted to volume-insensitive experiments such as resistivity or optical measurements. On the other hand, recent studies on strongly correlated electron systems containing transition metal elements with -electrons revealed interesting quantum phase transitions taking place in the pressure range above 4 GPa. The examples include -phase vanadate bronzes[3] and iron pnictide superconductors[4, 5, 6]. For microscopic understanding of these phenomena, various experiments including volume-sensitive measurements such as nuclear magnetic resonance (NMR) are required. Thus there is a increasing demand for high-pressure cells with improved space-efficiency.
Our aim is to develop a high pressure cell which enables realistic nuclear magnetic resonance (NMR) experiments well above 4 GPa. Although a few trials have been reported using modified Bridgeman[2, 7] cells, moissanite anvil cell (MAC)[8], or diamond anvil cells (DAC)[9, 10, 11], problems still remain concerning the insufficient sample space, poor hydrostaticity, or inhomogeneity of the magnetic field due to magnetization of the cells[10, 7]. In this paper, we report development of a new type of opposed-anvil-cell which can be used to generate pressure up to 9 GPa over a volume of 7 mm3 with the total cell size of mm mm. This sample space is ten times larger than that reported for the modified-Bridgeman-type cell[2, 7] and hundreds times than MAC[8] or DAC[9, 10, 11]. Our cell has three additional advantages. First, a transparent moissanite window can be attached for optical measurements, which enables accurate determination of pressure by measuring the fluorescence from ruby. Second, the compact size of the cell allows arbitrary rotation of the whole cell by a two-axis goniometer to achieve precise alignment of single crystal samples in superconducting magnets. Third, argon can be employed as pressure transmitting medium. Argon is soft molecular solid at high pressures and provides a highly hydrostatic environment[12, 13]. This feature is particularly important at low temperatures, where any liquid medium inevitably solidifies[13].
Since the optical setup to measure ruby fluorescence occupies one third of the sample space and the cell cannot be rotated with the optical fiber attached, it is necessary to establish NMR pressure indicators. For this purpose, we have measured the precise pressure ()- and temperature ()- dependences of the nuclear quadrupole resonance (NQR) frequency of 63Cu nuclei in cuprous oxide (Cu2O) and the Knight shift of metallic copper, -tin, and platinum between 4.2–300 K up to 9 GPa against the ruby pressure scale[12, 14].
The NQR frequencies () of Cu2O is known to show a significant pressure dependence[15]. Reyes et al. have established Cu2O-NQR as a suitable manometer in the temperature range 4–300 K and for the pressure up to 2 GPa[15]. Fukazawa et al. have extended the measurements up to 10 GPa at 1.6 K[2]. We found that the - and -dependences of can be precisely fit to a formula, which is a refined version of the formula used by Wijin and Wildt[16] and by Reyes et al.[15] based upon a simple phononic analysis. The Knight shift of 63Cu shows a very small -dependence, ppm/GPa, therefore it can be used to determine the field values in the pressure cell during NMR experiments. To the contrary, the shifts of 119Sn and 195Pt have significant -dependence: ppm/GPa respectively in the low- limit. These results are consistent with the previous studies below 1 GPa at room temperatures.[17, 18] The Sn/Pt NMR has less accuracy as a manometer than the NQR frequency of Cu2O. However they are useful in magnetic field where the broad NMR spectrum from Cu2O may overlap with the signal one wants to measure.
2 Experiment
2.1 Non-magnetic clamp cell: anvils, gasket, and wiring
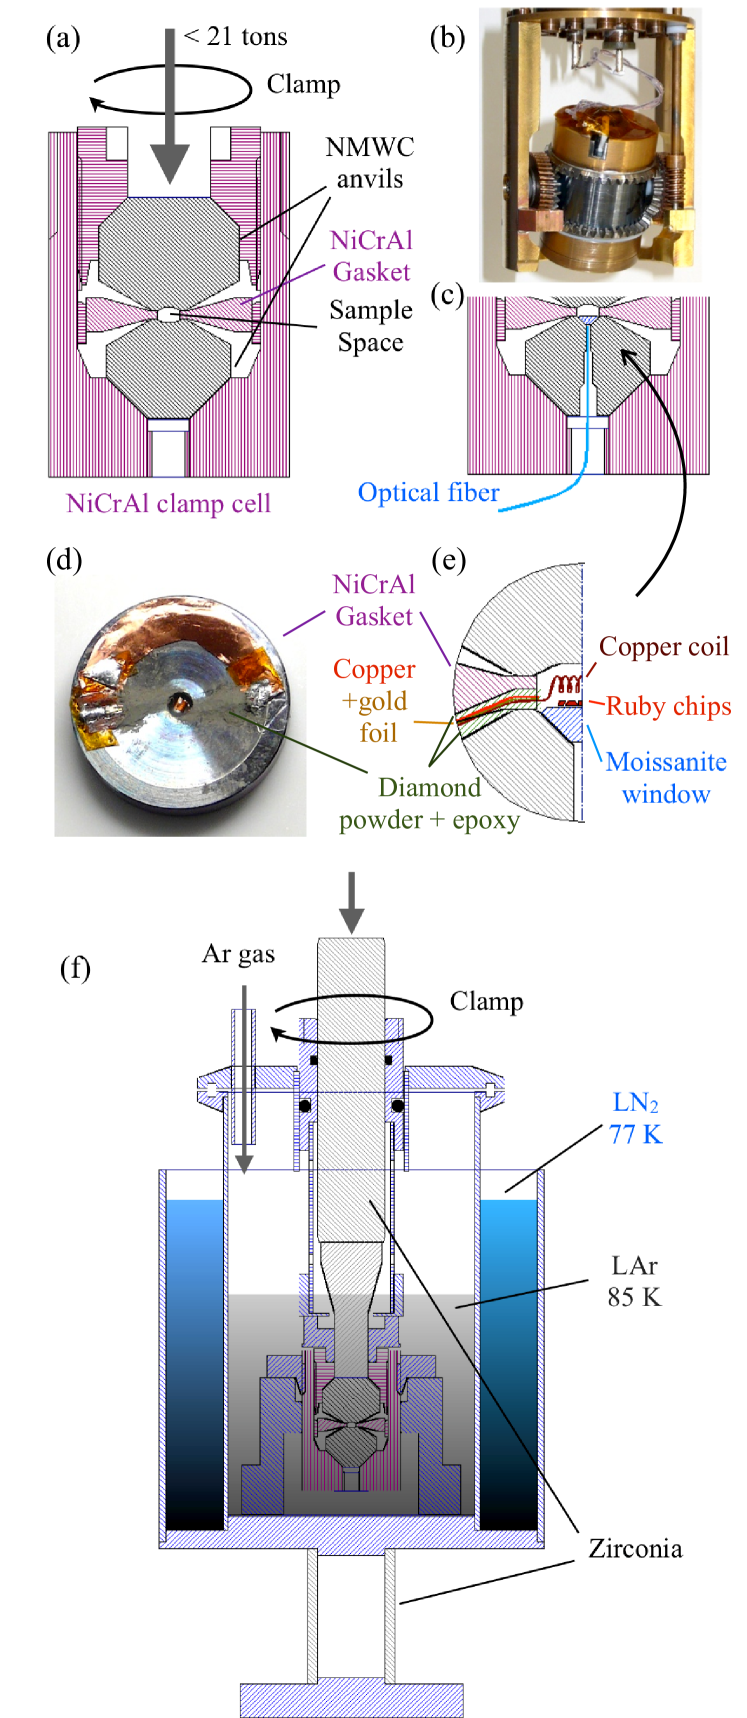
Figure 1 shows the drawings of the pressure cell. The two facing anvils are made of non-magnetic WC (NMWC) alloy (Fujilloy MF10). The anvil without a window has a tapered cavity of 3 mm in diameter and 0.35 mm in depth. The top face of the anvils is 4 mm in diameter and surrounded by a conical face with a lateral slope angle of 30∘. For the optical setup [Fig. 1(c)], moissanite (single-crystal 6H-SiC, manufactured by Charles & Colvard) of 2.5 mm in diameter is attached in a conical hollow of an NMWC anvil and glued with epoxy resin and diamond powder. The gasket and clamp cell are made of non-magnetic 56Ni-40Cr-4Al alloy, which has the tensile strength of 2 GPa.[1] NiCrAl alloy of gaskets and the clamp cell is age-hardened at 740 and 800∘C for 12 hours respectively to obtain good balances between tensile strength and toughness. We have examined about forty different shapes and materials for the gasket to maximize the volume between the anvils over 8 GPa. The best performance was obtained by an anticonical-shaped gasket with appropriate apertures to the anvils. While the common shape of gaskets for a opposed-type-anvil cell is plain disk with a hole, we found the additional slope can augment the gasket and wiring against shear force from pressure transmitting medium. The slope angle of the gasket is chosen to be 15∘, the slope begins at 2.35 mm off the center, and the hole is 2.5 mm in diameter and 1 mm in thickness. Combined with the cavities of the anvils, the total initial sample space is about 7 mm3. Wiring was settled in grooves with 1 mm wide and 0.66 mm depth milled on the gasket [Figs. 1(d) and (e)]. The cooper wire from the pickup coil plated with gold and copper foil were insulated by diamond powder with epoxy resin.
2.2 Low-temperature loading of argon, pressure transmitting medium
Argon is used as the pressure transmitting medium unless otherwise noted, by loading the cell in liquid argon [Fig. 1(f)]. Argon, which liquifies at 87.3 K at 1 atm, is cooled by liquid nitrogen. To press the entire cell at low temperatures, the piston and support are made of zirconia with low thermal conductivity. During the loading process, temperature of the liquid argon is stabilized by heating at 85 K, slightly above the melting point of Ar at 1 atm (83.8 K). After loading typically up to 7 tons the cell is warmed back to room temperature and the argon is sealed by clamping the cell. We found that sealing of argon has to be performed above 3 GPa in order to prevent leak of Ar gas if it is to be kept at room temperature for a long period. To further increase the pressure, additional load is applied at room temperature up to 21 tons through the WC rod with 10 mm diameter. Hydraulic pressures have been smoothly changed by an electrically controlled plunger pump.
2.3 NMR/NQR experiments and ruby fluorescence
We have used the following reagents in the present study: Cu2O powder (99.9%, Rare metallic), platinum powder (99.98%, NILACO) and tin powder (99.999%, NEWMET KOCH). To observe signals of copper metal, we mainly used pickup coils of standard copper wires. To check possible effects of purity, elongation, or residual strains, we examined the difference at ambient pressure between powder and other forms: the reagent powder and single crystals of cuprous oxide grown according to Ref. \citenNakanoCu2OSC; copper of coil wire and 99.9% of copper powder (SOEKAWA); the reagent foil and reagent powder for platinum and tin. No difference in the NQR frequencies or in the Knight shifts (in-plane components for tin) were observed within the experimental resolution determined by the line width. All the measurements except for copper in the following sections have been performed in powder form.
NMR experiment has been performed using conventional pulsed spectrometers. The spectra were acquired as Fourier transform of the spin echo signal. We regard the peak positions as the representative values. The Knight shifts measurements of NMR for platinum and tin have been performed by comparing the NMR frequencies 195Pt or 119Sn with 63Cu at the same field around at 6.6 T. For the Knight shifts of copper, we compared 63Cu NMR with proton NMR of glycerol at the same field around 4.2 T.
Pressure values are determined by the ruby fluorescence method. It is based on the nearly linear -dependence of the shift of the wavelength for the R1 fluorescence peak: nm/GPa in the low- region[20]. This relation is known to be insensitive to temperature. In this study, we used a more precise non-linear equation reported by Mao et. al., who used argon medium up to 80 GPa:[12]
| (1) |
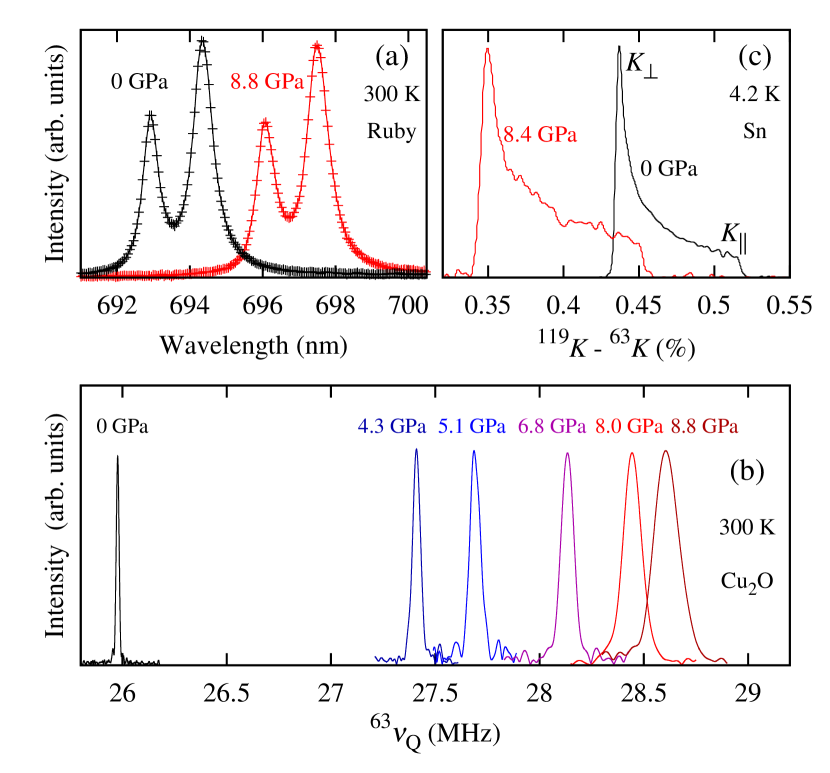
Here is the R1 wavelength at ambient pressure and at the same temperature. We measured and inside and outside the pressurized space using two pieces of ruby from the same batch. Typical fluorescence spectra at room temperature are shown in Fig. 2(a).
The NMR/NQR measurements were performed as follows. First the cell was loaded at room temperature until the desired pressure was reached. Then the cell was clamped to hold the pressure, mounted on the NMR probe, and installed in the He cryostat. The NMR/NQR measurements were performed at several stabilized temperatures between 300 and 4.2 K. The pressure changes to some extent during the cooling process because the elasticity of Ni-Cr-Al alloy is strengthened and molecular motion of medium slows at lower-. To determine the pressure accurately at each temperature, we measured ruby fluorescence at zero field just before and/or after the NMR/NQR measurements. For low and high region, argon slowly leaks as detected by decrease of . Therefore we performed the NMR/NQR measurements only in high- or low- region where the pressure determination is reliable.
3 Application to NMR/NQR
3.1 NQR frequency of O
Cu2O is a semiconductor, in which the Cu-O bonds have ionic nature. The moderate relaxation times and the sharp NQR transition line in Cu2O make this material a suitable pressure indicator. Figure 2(b) displays the NQR spectra of 63Cu nuclei at 300 K at several pressures. The spectrum at ambient pressure is very sharp with the full width at half maximum (FWHM) of 20 kHz centered at 25.98 MHz. The NQR frequency is proportional to the electric field gradient (EFG) at the nuclei, which is axially symmetric around the O-Cu-O bond. Generally EFG from a distant point charge has the dependence. Therefore, is expected to be inversely proportional to the volume. In fact, in Cu2O increases as is increased as shown in Fig. 2(b) and Table 1. As previously reported, shows almost linear dependence on with the slope of 0.33 MHz/GPa at 300 K. Larger FWHM at higher is considered to be due to inhomogeneity of pressure and/or axial stress in powder sample. Therefore the FWHM is a good measure of the hydrostaticity. The FWHM of 100 kHz at 8 GPa in our opposite-anvil cell with Ar medium is smaller than the previous result of 140 kHz obtained with Flourinert medium and cubic-anvil apparatus[21]. This ensures good hydrostaticity of our system.
Reyes et al. presented an analytical formula[15] to express as a function of up to 2 GPa and between 4 and 300 K, by combining the -dependence due to thermally activated phonons [16] and the linear -dependence,
| (2) | ||||
| (3) | ||||
| (4) |
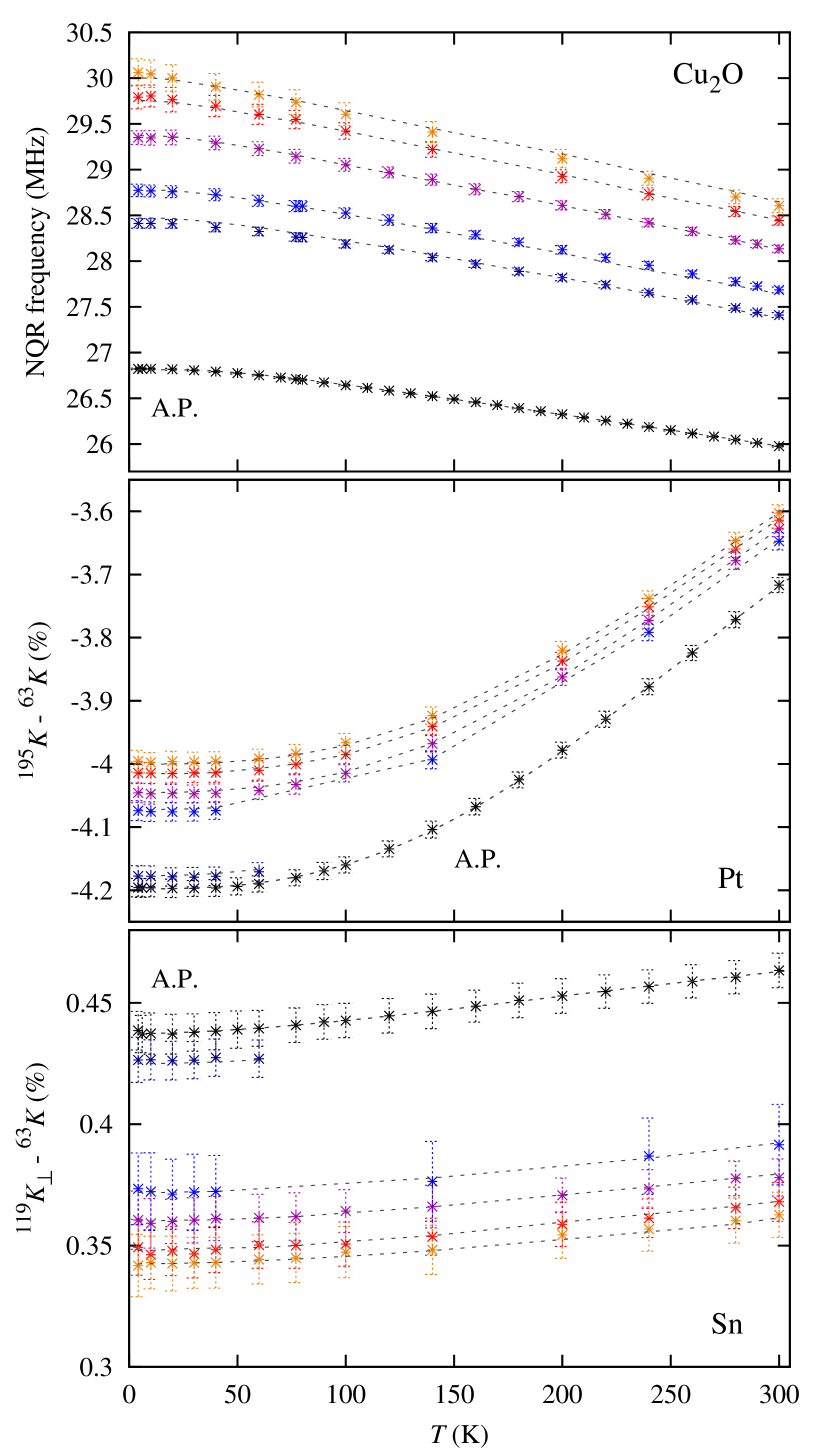
Here is the -independent coefficient, is the characteristic temperature for the relevant phonon mode and is the coupling constant between the phonon and EFG. These parameters should be a function of volume or of . Below we generalize the treatment by Reyes et al. by allowing non-linear -dependence of these parameters. In Fig. 3, is plotted against at ambient pressure and at several pressures obtained by clamping the cell. The above equation provides excellent fit to the experimental points at ambient pressure (dashed line) with a standard deviation of 4 kHz, which is much less than the FWHM of 20 kHz:
| (5) | ||||
| (6) | ||||
| (7) |
| FWHM | ||
| (GPa) | (MHz) | (kHz) |
| 4.2 K | ||
| 0 | 26.822 | 18 |
| 4.37 | 28.412 | 104 |
| 5.28 | 28.774 | 135 |
| 7.11 | 29.350 | 150 |
| 8.37 | 29.793 | 260 |
| 9.18 | 30.063 | 300 |
| 300 K | ||
| 0 | 25.977 | 17 |
| 4.26 | 27.410 | 55 |
| 5.12 | 27.686 | 63 |
| 6.83 | 28.134 | 75 |
| 8.01 | 28.444 | 100 |
| 8.78 | 28.605 | 150 |
The dependence of on can be expressed in terms of the isothermal bulk modulus and its pressure derivative by Murnaghan equation of state[22].
| (8) |
We assume power laws between the above EFG parameters and :
| (9) | ||||
| (10) | ||||
| (11) |
We then fit the high-pressure experimental data with , and as the parameters. The value of is known as 5.7,[23] but the adjustment of provides a better fitting with the standard deviation of 25 kHz. The results are:
| (12) | ||||
| (13) | ||||
| (14) | ||||
| (15) | ||||
| (16) |
The value of is thus expressed at any up to 300 K and about 9 GPa. It is noted that the relation is expected for an ideal ionic lattice. The obtained value of about 2 suggests additional effects of pressure, for example, strong modification in covalency and/or in Cu-O bond length.
Next, we compare our data with the previous results by Fujiwara et al.[24], who used a piston cylinder cell, and by Fukazawa et al.[2], who used a modified Bridgeman-type cell. The former was measured against the ruby scale at room temperatures. In the latter experiments, pressure was determined at low temperatures from the superconducting transition temperature of lead. Note that the variation of of lead has been studied by the ruby scale as well.[25] All the data points are potted in Fig. 4 as a function of to see the isothermal behavior. The curves (dashed lines in Fig. 4 at 4.2 K and at 300 K) obtained by Eqs. (2)–(16) reproduce all the experimental results well within the errors.
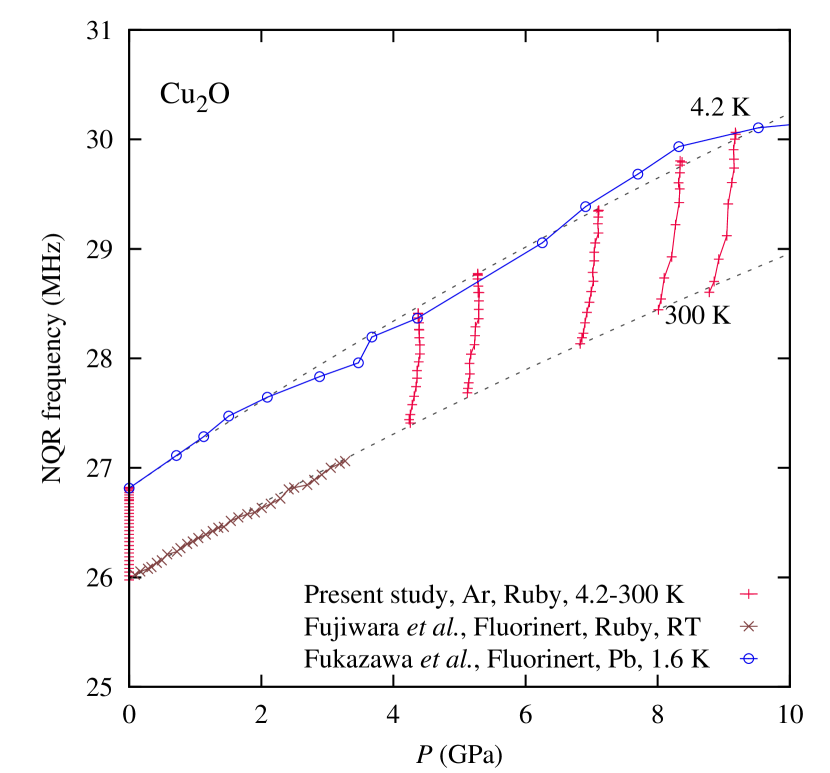
The results demonstrate that the pressure dependence of in Cu2O is well reproducible and explained by the simple phenomenological formulations. The FWHM are very sharp, 20 kHz at ambient pressure or 150 kHz at 9 GPa and 300 K, which correspond to 0.06, 0.43 GPa of the variation respectively. Hence the cuprous oxide NQR scale has been established against the ruby scale up to 9 GPa within at most 5% of errors. Due to non-linear pressure dependence in ultrahigh-pressure range, the Newton method or its analogue must be used to obtain pressure from the observed frequency. Alternatively, we suggest to look up Table 2 showing the calculated results of Eqs. (2)–(16).
| Cu2O: | PtCu: | -SnCu: | Pt-Sn: | |||||
| (GPa) | (MHz) | (%) | (%) | (%) | ||||
| 4.2 K | 300 K | 4.2 K | 300 K | 4.2 K | 300 K | 4.2 K | 300 K | |
| 0 | 26.814 | 25.980 | -4.198 | -3.719 | 0.437 | 0.463 | -4.635 | -4.181 |
| 0.2 | 26.897 | 26.052 | -4.193 | -3.716 | 0.435 | 0.460 | -4.628 | -4.175 |
| 0.4 | 26.979 | 26.124 | -4.189 | -3.713 | 0.432 | 0.457 | -4.620 | -4.169 |
| 0.6 | 27.060 | 26.195 | -4.184 | -3.710 | 0.429 | 0.453 | -4.613 | -4.164 |
| 0.8 | 27.141 | 26.265 | -4.179 | -3.707 | 0.426 | 0.450 | -4.606 | -4.158 |
| 1 | 27.221 | 26.334 | -4.175 | -3.705 | 0.424 | 0.448 | -4.598 | -4.152 |
| 1.2 | 27.300 | 26.403 | -4.170 | -3.702 | 0.421 | 0.445 | -4.591 | -4.146 |
| 1.4 | 27.378 | 26.472 | -4.166 | -3.699 | 0.418 | 0.442 | -4.584 | -4.141 |
| 1.6 | 27.456 | 26.539 | -4.161 | -3.696 | 0.416 | 0.439 | -4.577 | -4.135 |
| 1.8 | 27.533 | 26.606 | -4.157 | -3.694 | 0.413 | 0.436 | -4.570 | -4.130 |
| 2 | 27.610 | 26.673 | -4.152 | -3.691 | 0.411 | 0.433 | -4.563 | -4.124 |
| 2.2 | 27.685 | 26.739 | -4.148 | -3.688 | 0.409 | 0.431 | -4.556 | -4.119 |
| 2.4 | 27.761 | 26.804 | -4.143 | -3.685 | 0.406 | 0.428 | -4.550 | -4.114 |
| 2.6 | 27.835 | 26.869 | -4.139 | -3.683 | 0.404 | 0.426 | -4.543 | -4.108 |
| 2.8 | 27.909 | 26.933 | -4.135 | -3.680 | 0.402 | 0.423 | -4.536 | -4.103 |
| 3 | 27.982 | 26.997 | -4.130 | -3.677 | 0.399 | 0.421 | -4.529 | -4.098 |
| 3.2 | 28.055 | 27.060 | -4.126 | -3.675 | 0.397 | 0.418 | -4.523 | -4.093 |
| 3.4 | 28.127 | 27.123 | -4.121 | -3.672 | 0.395 | 0.416 | -4.516 | -4.088 |
| 3.6 | 28.199 | 27.185 | -4.117 | -3.669 | 0.393 | 0.413 | -4.510 | -4.083 |
| 3.8 | 28.270 | 27.247 | -4.113 | -3.667 | 0.391 | 0.411 | -4.503 | -4.078 |
| 4 | 28.340 | 27.308 | -4.109 | -3.664 | 0.389 | 0.409 | -4.497 | -4.073 |
| 4.2 | 28.410 | 27.369 | -4.104 | -3.661 | 0.387 | 0.406 | -4.491 | -4.068 |
| 4.4 | 28.479 | 27.429 | -4.100 | -3.659 | 0.384 | 0.404 | -4.484 | -4.063 |
| 4.6 | 28.548 | 27.489 | -4.096 | -3.656 | 0.382 | 0.402 | -4.478 | -4.058 |
| 4.8 | 28.616 | 27.549 | -4.092 | -3.654 | 0.381 | 0.400 | -4.472 | -4.053 |
| 5 | 28.684 | 27.608 | -4.087 | -3.651 | 0.379 | 0.398 | -4.466 | -4.049 |
| 5.2 | 28.752 | 27.666 | -4.083 | -3.648 | 0.377 | 0.396 | -4.460 | -4.044 |
| 5.4 | 28.819 | 27.724 | -4.079 | -3.646 | 0.375 | 0.393 | -4.454 | -4.039 |
| 5.6 | 28.885 | 27.782 | -4.075 | -3.643 | 0.373 | 0.391 | -4.448 | -4.035 |
| 5.8 | 28.951 | 27.839 | -4.071 | -3.641 | 0.371 | 0.389 | -4.442 | -4.030 |
| 6 | 29.016 | 27.896 | -4.067 | -3.638 | 0.369 | 0.387 | -4.436 | -4.026 |
| 6.2 | 29.081 | 27.953 | -4.063 | -3.636 | 0.368 | 0.385 | -4.430 | -4.021 |
| 6.4 | 29.146 | 28.009 | -4.058 | -3.633 | 0.366 | 0.384 | -4.424 | -4.017 |
| 6.6 | 29.210 | 28.065 | -4.054 | -3.631 | 0.364 | 0.382 | -4.418 | -4.012 |
| 6.8 | 29.274 | 28.120 | -4.050 | -3.628 | 0.362 | 0.380 | -4.413 | -4.008 |
| 7 | 29.337 | 28.175 | -4.046 | -3.626 | 0.361 | 0.378 | -4.407 | -4.003 |
| 7.2 | 29.400 | 28.229 | -4.042 | -3.623 | 0.359 | 0.376 | -4.401 | -3.999 |
| 7.4 | 29.462 | 28.284 | -4.038 | -3.621 | 0.357 | 0.374 | -4.396 | -3.995 |
| 7.6 | 29.524 | 28.337 | -4.034 | -3.618 | 0.356 | 0.372 | -4.390 | -3.990 |
| 7.8 | 29.586 | 28.391 | -4.030 | -3.616 | 0.354 | 0.371 | -4.384 | -3.986 |
| 8 | 29.647 | 28.444 | -4.026 | -3.613 | 0.353 | 0.369 | -4.379 | -3.982 |
| 8.2 | 29.708 | 28.497 | -4.022 | -3.611 | 0.351 | 0.367 | -4.373 | -3.978 |
| 8.4 | 29.769 | 28.549 | -4.019 | -3.608 | 0.349 | 0.366 | -4.368 | -3.974 |
| 8.6 | 29.829 | 28.601 | -4.015 | -3.606 | 0.348 | 0.364 | -4.362 | -3.970 |
| 8.8 | 29.888 | 28.653 | -4.011 | -3.603 | 0.346 | 0.362 | -4.357 | -3.965 |
| 9 | 29.948 | 28.705 | -4.007 | -3.601 | 0.345 | 0.361 | -4.352 | -3.961 |
| 9.2 | 30.007 | 28.756 | -4.003 | -3.598 | 0.343 | 0.359 | -4.346 | -3.957 |
| 9.4 | 30.065 | 28.807 | -3.999 | -3.596 | 0.342 | 0.357 | -4.341 | -3.953 |
| 9.6 | 30.124 | 28.857 | -3.995 | -3.995 | 0.356 | -4.336 | ||
| 9.8 | 30.182 | 28.908 | -3.992 | -3.992 | 0.354 | -4.331 | ||
| 10 | 30.239 | 28.957 | -3.988 | -3.988 | 0.353 | -4.325 | ||
3.2 The Knight shift of
At ambient pressure, the Knight shift of copper metal is known to be almost independent of and has a relatively small value of 0.20%. These features make copper metal a favorable marker for field calibration at low temperatures, where a liquid NMR marker with sharp resonance line is not available. We determined the shift of Cu metal by comparing the resonance frequency of 63Cu and that of protons in glycerol. At room temperature glycerol shows a sharp line with the FWHM of 6 kHz shifted by 4 ppm relative to the signal in tetramethylsilane. Although it broadens to 16 kHz at 4.2 K, we assume the chemical shift of glycerol is unchanged. At 300 K and 4.2 K, we measured the shifts of copper at ambient pressure:
| (17) |
Here the gyromagnetic ratio of 63Cu nuclei is chosen to the value of the IUPAC recommendation, 11.28933 MHz/T.[26] These values are consistent with the known values[27] by taking the same gyromagnetic ratio. The number in the parenthesis represents the calculated FWHM obtained by combining the FWHM of the 63Cu and glycerol spectra independently.
Next, we determined the Knight shift of Cu metal under high pressure by using glycerol as the pressure transmitting medium. At 9.8 GPa and 4.2 K, we obtained
| (18) |
Then, we estimate the -dependence of as,
| (19) |
(See Fig. 5.) This small negative slope agrees well with the previous study at room temperature up to 1 GPa by Benedek et al..[18] Since copper is hard material ( GPa), we consider that the following equation is accurate enough to determine the field values in practical use for GPa and K.
| (20) |
3.3 The Knight shift of
Platinum is a well-known example of a paramagnetic metal in the vicinity of ferromagnetic instability. Unlike the ordinary metals, the magnetic susceptibility of Pt shows a strong -dependence and is particularly enhanced at low temperatures. The Knight shift of Pt metal is generally composed of the spin part and the chemical shift. Since the former is proportional to , is also largely enhanced at low temperatures, % and is highly -dependent. To use as a manometer, proper account is required for the -dependence.
The self-consistent renormalization (SCR) theory provide a good framework to describe magnetic susceptibility of paramagnetic metals close to magnetic instabilities.[28] For the low- limit, the SCR equation for the paramagnetic state near ferromagnetic instability is analytically solved by approximating the digamma function [ for ].
| (21) |
where represents the zero-temperature susceptibility. In practice, the exponent of 2 may be adjusted for a better fit in high temperatures. By assuming the same -dependence both for the spin part and chemical part of the Knight shift, is expected to have the following form:
| (22) | ||||
| (23) | ||||
| (24) |
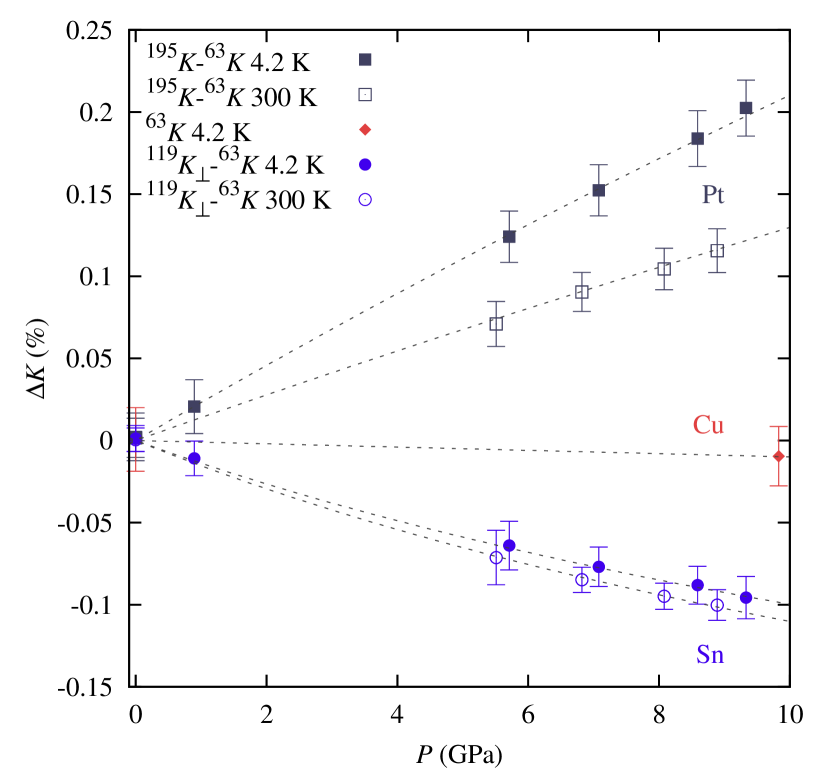
Because the measurement of relies on the field marker as stated in the previous section, we hereby use the difference as a manometer for better accuracy.
| (25) |
where and are the resonant frequencies of 195Pt and 63Cu nuclei respectively in the same external field, and 9.152554 MHz/T is the gyromagnetic ratio of 195Pt.[26]
| (GPa) | (%) | (%) | (%) |
|---|---|---|---|
| 4.2 K | |||
| 0 | -4.196 | 0.439 | -4.634 |
| 0.897 | -4.177 | 0.427 | -4.604 |
| 5.71 | -4.074 | 0.373 | -4.447 |
| 7.08 | -4.045 | 0.361 | -4.406 |
| 8.59 | -4.014 | 0.349 | -4.363 |
| 9.33 | -3.995 | 0.342 | -4.337 |
| 300 K | |||
| 0 | -3.717 | 0.463 | -4.180 |
| 5.51 | -3.647 | 0.392 | -4.039 |
| 6.82 | -3.628 | 0.378 | -4.006 |
| 8.08 | -3.614 | 0.368 | -3.982 |
| 8.89 | -3.603 | 0.363 | -3.965 |
The results at several pressures and temperatures between 4.2 K and 300 K are shown in Figs. 3 and 5 and in Table 3. The data for ambient pressure are in very good agreement with the literature values[27] after careful correction for the selection of field markers. At ambient pressure, we obtain the parameters with the standard deviation of 0.0014%:
| (26) | ||||
| (27) | ||||
| (28) | ||||
| (29) |
The equation of states of platinum has been studied extensively so that we fixed and to the values given in the literatures[29]. Then the values of and are obtained as
| (30) | ||||
| (31) | ||||
| (32) | ||||
| (33) |
We obtained the slope in the low- limit to be 130 ppm/GPa at 300 K, and 220 ppm/GPa at 4.2 K. The value at 300 K is consistent with the result reported by Matzkanin et al. up to 1.2 GPa.[17]
3.4 The Knight shift of
The -Sn metal is a typical Pauli paramagnet with week -dependence of the susceptibility. Figure 2(c) shows 119Sn-NMR spectra of -Sn. Since -Sn has a tetragonal crystal structure, the spectrum exhibits a typical powder pattern for anisotropic Knight shifts. We noticed that the shape of the entire spectrum depends on the sample form, most likely due to orientation of domains, which is especially prominent in foils. However, we found that the peak position, which corresponds to the in-plane Knight shift , is independent of sample form. Therefore the in-plane shift is chosen as a manometer. By measuring the spectrum of tin and copper at the same field, we determine
| (34) |
We fit the -dependence of the difference of the Knight shifts to Eq. (22) at ambient pressure and obtained the following with the standard deviation of 0.00039%,
| (35) | ||||
| (36) | ||||
| (37) | ||||
| (38) |
For the (–)-dependence,
| (39) | ||||
| (40) | ||||
| (41) | ||||
| (42) |
The standard deviation is 0.00088%. The elastic constant is fixed to 54.92 GPa according to Ref. \citenVaidyaCompMetals. Our value of is close to value in Ref. \citenVaidyaCompMetals (3.651). For the low- limit, the pressure derivatives of are ppm/GPa at 300 K, and ppm/GPa at 4.2 K. Note that exhibits non-linear -dependence due to softness of the material as shown in Fig. 5, in contrast to that of platinum.
It is noteworthy that the dependence of the is opposite to that of . Therefore, when one observes the two scales to obtain the difference , more accurate determination can be expected. Another advantage of taking the difference is to eliminate the errors arsing from measurement for the 63Cu signals. See Table 2 in order to convert to for simplicity.
4 Conclusion
In summary, we have established a new type of ultrahigh-pressure cell, by which we can clamp pressure as high as 9 GPa. It was designed to achieve large sample space desired for microscopic experiments. As an example, we have measured the pressure-temperature dependence of the NQR/NMR properties of several materials, the NQR frequencies of cuprous oxide, and the Knight shifts of copper, platinum, and tin against the ruby scale. These are well suited to determine pressure during NQR/NMR experiments in situ. We have presented fitting function to these sets of data, from which one can determine pressure up to 9 GPa at any temperature below 300 K. The NQR frequencies of cuprous oxides has excellent resolution in determining pressure. NMR of copper in the wire can be used to determine the applied field. The Knight shifts of platinum and tin are suitable manometers when inclusion of cuprous oxide in the sample coil is to be avoided.
Acknowledgments
We thank H. Fukazawa for discussions and comments and J. Yamazaki (ISSP machine shop) for manufacturing the clamp cells. K. K. is financially supported as a JSPS research fellow.
References
- [1] Y. Uwatoko, S. Todo, K. Ueda, A. Uchida, M. Kosaka, N. Mori, and T. Matsumoto: J. Phys: Condens. Matter 14 (2002) 11291.
- [2] H. Fukazawa, N. Yamatoji, Y. Kohori, C. T. nad N. Takeshita, Y. Tokura, and H. Takagi: Rev. Sci. Instrum. 78 (2007) 015106.
- [3] T. Yamauchi, Y. Ueda, and N. Môri: Phys. Rev. Lett. 89 (2002) 057002.
- [4] P. L. Alireza, Y. T. C. Ko, J. Gillett, C. M. Petrone, J. M. Cole, G. G. Lonzarich, and S. E. Sebastian: J. Phys.: Condens. Matter 21 (2009) 012208.
- [5] K. Matsubayashi, N. Katayama, K. Ohgushi, A. Yamada, K. Munakata, T. Matsumoto, and Y. Uwatoko: J. Phys. Soc. Jpn. 78 (2009) 073706.
- [6] K. Kitagawa, N. Katayama, H. Gotou, T. Yagi, K. Ohgushi, T. Matsumoto, Y. Uwatoko, and M. Takigawa: Phys. Rev. Lett., in press., cond-mat/0906.4740.
- [7] T. Suzuki, I. Yamauchi, Y. Shimizu, M. Itoh, N. Takeshita, C. Terakura, H. Takagi, Y. Tokura, T. Yamauchi, and Y. Ueda: Phys. Rev. B 79 (2009) 081101(R).
- [8] J. Haase, S. K. Goh, T. Meissner, P. L. Alireza, and D. Rybicki: Rev. Sci. Instr. 80 (2009) 073905.
- [9] M. G. Pravica and I. F. Silvera: Phys. Rev. Lett. 81 (1998) 4180.
- [10] T. Okuchi: Phys. Earth Planet. Interiors 143-144 (2004) 611–616.
- [11] T. Okuchi, M. Takigawa, J. Shu, H.-K. Mao, R. J. Hemley, and T. Yagi: Phys. Rev. B 75 (2007) 144104.
- [12] H. K. Mao, J. Xu, and P. M. Bell: J. Geophys. Res. 91 (1986) 4673.
- [13] N. Tateiwa and Y. Haga: Rev. Sci. Instrum., in press.
- [14] A. Jayaraman: 57 (1986) 1013.
- [15] A. P. Reyes, E. T. Ahrens, R. H. Heffner, P. C. Hammel, and J. D. Thompson: Rev. Sci. Instrum. 63 (1992) 3120.
- [16] H. W. de Wijn and J. L. de Wildt: Phys. Rev. 150 (1966) 200.
- [17] G. A. Matzkanin and T. A. Scott: Phys. Rev. 151 (1966) 360.
- [18] G. B. Benedek and T. Kushida: J. Phys. Chem. Solids 5 (1958) 241.
- [19] T. Nakano, K. Ohtani, A. Kinoshita, and T. Okuda: Jpn. J. Appl. Phys. 3 (1964) 124.
- [20] G. J. Piermarini, S. Block, and J. D. Barnett: J. Appl. Phys. 44 (1973) 5377.
- [21] K. Hirayama, T. Yamazaki, H. Fukazawa, Y. Kohori, and N. Takeshita: J. Phys. Soc. Jpn. 77 (2008) 075001.
- [22] F. Murnaghan: Finite Deformation of an Elastic Solid (John Wiley and Sons, Inc., New York, 1951)
- [23] A. Werner and H. D. Hochheimer: Phys. Rev. B 25 (1982) 5929.
- [24] N. Fujiwara, T. Matsumoto, K. Koyama-Nakazawa, A. Hisada, and Y. Uwatoko: Rev. Sci. Instrum. 78 (2007) 073905.
- [25] J. Thomasson, C. Ayache, I. L. Spain, and M. Villedieu: J. Appl. Phys 68 (1990) 5933.
- [26] R. K. Harris, E. D. Becker, S. M. Cabral de Menezes, P. Granger, R. E. Hoffman, and K. W. Zilm: Pure Appl. Chem. 80 (2008) 59.
- [27] G. C. Carter, L. H. Bennett, and D. J. Kahan: Metallic Shifts in NMR (Pergamon Press, Oxford, 1977)
- [28] T. Moriya: Spin Fluctuations in Itinerant Electron Magnetism (Springer-Verlag, Berlin Heidelberg, 1985)
- [29] C.-S. Zha, K. Mibe, W. A. Bassett, O. Tschauner, H.-K. Mao, and R. J. Hemley: J. Appl. Phys. 103 (2008) 054908.
- [30] S. N. Vaidya and G. C. Kennedy: J. Phys. Chem. Solids 31 (1970) 2329.