Condensation of a tetrahedra rigid-body libration mode in HoBaCo4O7 : the origin of phase transition at 355 K
Abstract
Rietveld profiles, Mössbauer spectra and x-ray absorption fine structure (XAFS) were analyzed through the structural phase transition at K in HoBaCo4O7. Excess of the oxygen content over ”O7” was avoided via annealing the samples in argon flow at . Space groups (S.G.) and were used to refine the structure parameters in the low- and high-temperature phases, respectively. Additionally, the symmetry was considered as a concurrent model of structure of the low-temperature phase. In the high-temperature phase, severe anisotropy of thermal motion of the major part of the oxygen atoms was observed. This anisotropic motion turns to be quenched as the sample is cooled below . The variation of quadrupole splitting near is not similar to a steplike anomaly frequently seen at the charge-ordering transition. We observe instead a dip-like anomaly of the average near . Narrow distribution of the electric field gradient (EFG) over different cobalt sites is observed and explained on the basis of point-charge model. XAFS spectra show no evidence of significant difference between YBaCo4O7 () and HoBaCo4O7 (). The origin of the transition at is ascribed to the condensation of the libration phonon mode associated with the rigid-body rotational movements of the starlike tetrahedral units, the building blocks of kagomé network. It is shown that the condensation of the libration mode is not compatible with translation symmetry for the hexagonal S.G., but compatible for the orthorhombic S.G. The orthorhombic lattice parameters and EFG components () vary smoothly with temperature at approaching and closely follow each other.
keywords:
cobaltite , phase transition , HoBaCo4O7 , libration mode , rigid-unit mode , Mössbauer spectroscopyIntroduction
The cobaltites REBaCo4O7 have displayed a structural phase transition manifestative through stepwise changes of physical properties. Peak-like anomalies of specific heat were observed for RE=Lu, Yb, Tm, Er in the range of transition temperatures between 160 K (Lu) and 280 K (Er)[1, 2]. Magnetization [1, 3], Seebek coefficient[4] and resistivity[3, 4] drop abruptly as temperature increases through the RE-specific value of . Because of the mixed valence of Co (averaged valence ”+2.25”) there may occur different distributions of charges in the low- and high-temperature phases. Therefore, the transition was conjectured to be driven by the charge ordering in the Co subsystem[1].
REBaCo4O7 belongs to the family of swedenborgite, whose structure was solved by Pauling et al[5] in 1935. The swedenborgite SbNaBe4O7 was described as a net built up of starlike Be4O13 clusters[6], and similar Co4O13 stars can be found in REBaCo4O7. Two nonequivalent sites of Co exist in high-temperature hexagonal phase [7, 8], but four Co sites in low-temperature orthorhombic phase[8]. Clearly, some redistribution of charge should be associated with changing the symmetry. It remains under debate, however, whether or not the transition itself is driven by the charge redistribution.
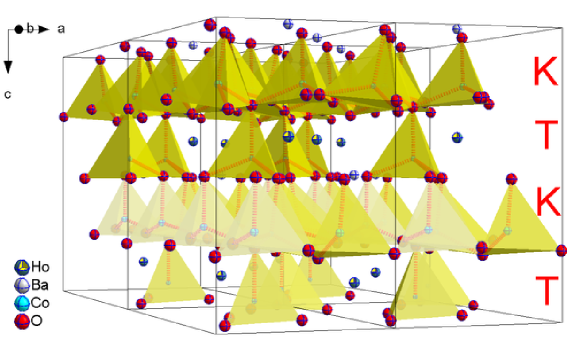
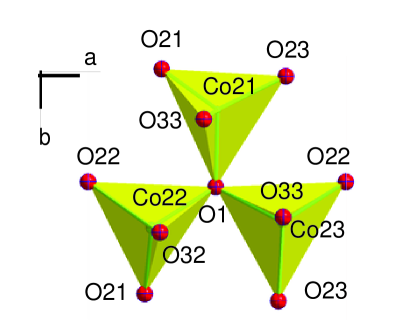
Both phases consist of regular 1:1 stacking of kagomé and triangular layers of CoO4 tetrahedra (Fig. 1). In each of the phases, there are 75% of Co sites in kagomé layers and 25% of Co sites in triangular layers. Each Co4O13 star thus involves three tetrahedra in K-layer and one in T-layer. We found relative arrangement of these stars unchanged, however their exact geometry somewhat changes through .
From analyzing the bond valence sums in both the low- and high-temperature phases Huq et al[8] derived the preference of the Co site in the triangular layers for the Co3+ ion at , but, contrarily, for the Co2+ ion at . On the other hand, it was argued recently [9] that the Co sites in triangular layers are generally exhibiting shorter Co-O distances than the sites in kagomé layers, irrespectively of the transition at ; the Co3+ ions should always prefer the site in triangular layers.
In this work, we investigate the phase transition in HoBaCo4O7 using the synchrotron diffractometry, Mössbauer spectroscopy, and XAFS. It was verified that the substitution of 2.5% of Co with Fe did not introduce a significant change of K. We observed only very small changes in Mössbauer spectra through and we argue that no charge ordering takes place at the phase transition. Different symmetry groups were tested to fit the phases below ( and ) and above ( and ). From the results of our structural study the origin of the phase transition is understood to be unrelated to charge redistribution. We consider instead the double-well potential models[10], in which the transition can be explained as the condensation of a libration phonon mode associated with the rigid-body motion of the tetrahedra in kagomé layers around the center of the abovementioned Co4O13 stars.
1 Experimental
The samples of HoBaCo4O7 and HoBaCo3.9Fe0.1O7 were prepared from Ho2O3 , BaCO3, Co3O4 and 57Fe2O3 powders using standard ceramic synthesis technology at 1100 oC. One sample of YBaCo4O7 for the XAFS study was also prepared using Y2O3 in the same conditions. The sample of HoBaCo4O7 was made first in Japan and exactly the same synthesis was reproduced in Russia. Two samples showed the reproducible values of and lattice parameters. Other samples, doped with 57Fe, were prepared in Russia. Final annealing in flowing pure Ar gas was always done at 600oC.
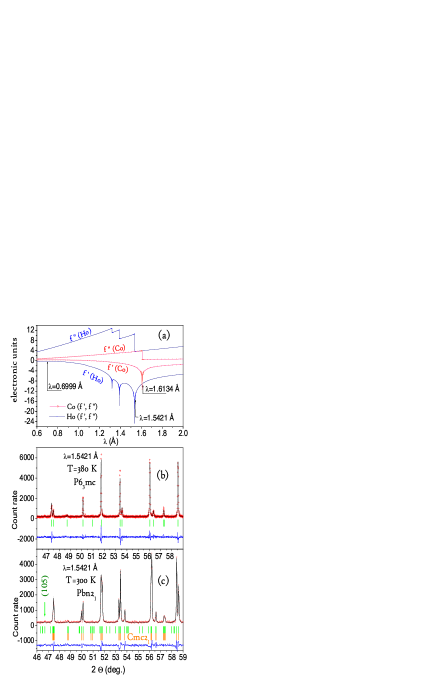
The measurements of x-ray diffraction patterns for Rietveld analysis were conducted at the ”Anomalous Scattering” beamline of the VEPP-3 storage ring in Siberian Synchrotron Radiation Centre (SSRC). The beamline is equipped with Si (111) monochromator on the primary beam and Ge (111) crystal analyzer on the diffracted beam. Three patterns of HoBaCo4O7 were measured at 300 K for three wavelengths shown in Fig.2(a). Fourth pattern was measured at 380 K for 1.5421 Å. Structure parameters were refined through the analysis of full-profile x-ray diffraction intensities using FULLPROF program[11, 12]. Anomalous dispersion corrections for the atomic scattering factors of Ho,Ba and Co were introduced into the input files of FULLPROF using the Brenann and Cowan data from DispAnoV2 program.
The measurements of x-ray diffraction patterns in the temperature range between 27oC and 113oC were also conducted using a MXP21 Mac Science diffractometer with the following operation conditions: 50o 60o with the step size of 0.02o, Cu-Kα radiation (= 1.5405 Å and 1.5443 Å), V = 45 kV and I = 100 mA. The lattice parameters were refined using Rietveld analysis.
The Co K-edge XANES spectra were measured at the EXAFS station of SSRC. The beam was monochromatized with channel-cut Si (111) monochromator. The energy resolution was 0.8 eV.
Mössbauer spectra were collected with the velocity-reversive spectrometer NZ-640 (Hungary), using the regime of constant acceleration for moving source of 57Co embedded in a metal (Cr) matrix. The chemical shifts are given relative to Fe metal. The temperature of sample was maintained with the accuracy of The Mössbauer source was kept at room temperature. (24 oC). In this setup, the drift of the source temperature had to be taken into account only in the temperature dependencies of the chemical shift. Mössbauer spectra were measured in the range of velocities from from -4 to 4 mm/s and stored into 1000 channels equidistributed in velocity. In each of 27 spectra obtained, the number of counts per channel was approximately .
2 Results
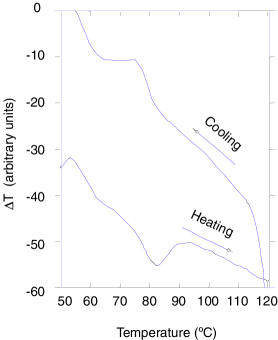
Differential thermal analysis results have revealed the highest temperature of the structural transition K for HoBaCo4O7 among all the studied previously cobaltites of the RBaCo4O7 series (R=Lu,Yb,Tb,Er,Y) (cf. Refs.[1, 2, 3]). The DTA curve collected at the cooling/heating rate of 3 K/min showed the endothermic effect at the temperature of 82oC for sample heating (Fig.3). The latency interval, within which the high-temperature phase can be undercooled, evidences the 1-st order character of the transition in agreement with the general renormalization group theory of the phase transitions (see, for example, the references in the review [10]).
The spacing between heating and cooling curves is collapsed in Fig. 4, where the temperature dependence of the lattice parameters is shown. All the data of Fig. 4 were obtained using the overnight program, so that the average rate of the temperature ”sweep” was slower by two orders of magnitude than that in Fig.3.
2.1 Structure refinements
The lattice parameters below and above were refined using Rietveld analysis. To refine the lattice parameters and atomic coordinates at we used previously suggested structure models based on the S.G. [1], and Pbn21[8]. The substitution of 2.5% Co with Fe has no significant effect on the lattice parameters. In HoBaCo3.9Fe0.1O7 we obtained Å, b=10.9552(2) Å, c=10.2225(2) Å. In the Fe-doped sample HoBaCo3.9Fe0.1O7 we obtained at room temperature the orthorhombic cell with Å, b=10.9573(5) Å, c=10.2275(5) Å.
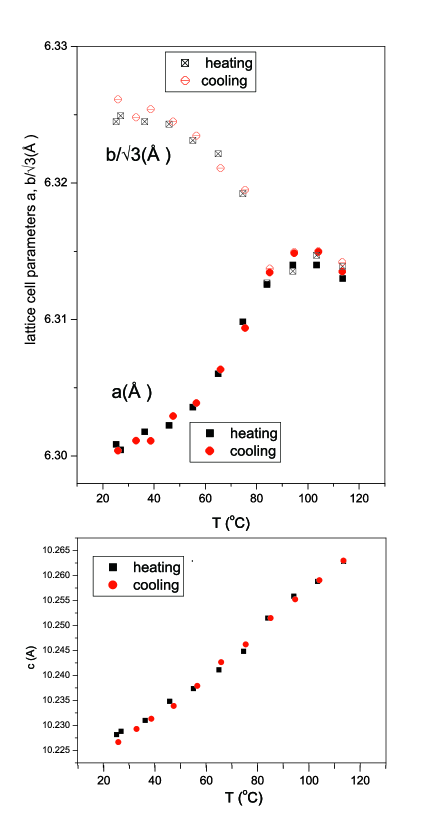
The temperature evolution of the lattice parameter and the reduced lattice parameter shows that there exist below Ts a wide temperature range ( K), in which the orthorhombic distortion gradually increases at cooling. This behavior is contrasting to the abrupt jumping of the parameter, reported for YbBaCo4O7[4]. The -parameter, on the opposite, exhibits smaller jump at in our Fig.4, as compared to its jump reported previously for YbBaCo4O7[4].
Table 1. Atomic coordinates for HoBaCo4O7 at 300 K.
x
y
z
x
y
z
Ho
0.0014(5)
0
0.6672(2)
0.6664(2)
0.8717(2)
0.8720(1)
1.4(2)
1.3(2)
Ba
0
0
2/3
2/3
1/2
1/2
1.4(2)
1.4(2)
Co1
-0.011(1)
0
-0.0055(6)
0.0067(4)
0.9409(4)
0.9388(4)
0.7(2)
0.9(2)
Co21
-0.001(1)
0
0.1747(2)
0.1770(2)
0.6996(4)
0.6985(4)
0.6(4)
0.5(2)
Co22
0.257(1)
-
0.0879(4)
-
0.1891(6)
-
1.1(4)
-
Co23∗∗
0.252(1)
0.2525(4)
0.9239(4)
0.9177(2)
0.6819(6)
0.6871(4)
1.0(4)
1.1(3)
O1
0.008(4)
0
-0.003(2)
0.0122(9)
0.2555(7)
0.2535(7)
1.7(7)
1.0(5)
O21
0.783(2)
-
0.2648(14)
-
0.7793(10)
-
0.9(7)
-
O22
-0.003(5)
0
0.4860(9)
0.4784(7)
0.2400(13)
0.2238(7)
0.6(7)
0.4
O23∗∗
0.735(2)
0.763(1)
0.7512(14)
0.7395(7)
0.2273(12)
0.2600(6)
0.5(7)
1.6
O31
-0.053(2)
0
0.1535(11)
0.1439(6)
0.5116(16)
0.5077(9)
0.4(6)
∗∗∗
O32
0.224(2)
-
0.0983(12)
-
0.0141(22)
-
1.5(9)
O33∗∗
0.254(3)
0.250(1)
0.9355(11)
0.9193(9)
0.5064(22)
0.5166(8)
1.5(9)
∗∗∗∗
*Anisotropic thermal displacement factors (ATDF) were refined for O31 and O33 in S.G. Cmc21.
**Position multiplicity 8 in the S.G. . All other positions in both and groups have the multiplicity 4.
***Refined ATDF for O31: = 0.13(2), =0.016(8), =0.004(9), =-0.006(8) Å2, The values of and are fixed to 0 by symmetry. Uij are smaller than Bij by the factor of 8.
****Refined ATDF for O33: =0.033(17), =0.09(3), =0.028(17), =0.01(2), =-0.01(2), =-0.05(3) Å2.
Three patterns measured on synchrotron radiation at 300 K were fitted all together, varying at once the different profile parameters particular of each pattern and the atomic coordinates common for all patterns. Results shown in Table 1 were obtained with the S.G.’s and . Corresponding reliability factors are , for , and , for . The pattern weight factors proportional to the total number of counts per pattern were used. Quite similar results were found at varying the weight factor in the broad area of the 3D space of the weight factors.
The use of multiple wavelengths allowed us to vary the contribution of certain atoms to the diffraction patterns. Diffraction intensities around the angles of strongest peaks are modified by the anomalous scattering in such a way as if either Ho or Co were isomorphously replaced with La or Ti, respectively, in effect, as if the hypothetical compounds LaBaCo4O7 and HoBaTi4O7 were measured additionally to HoBaCo4O7. Fig.5 shows the Rietveld plot of HoBaCo4O7 at the wavelength near Co K-edge. The inset shows the difference between two resonant patterns measured near the Co and Ho absorption edges. These differential patterns consist of observed and theoretical profiles and at the profile conditions of the resonant pattern at Co K-edge. To plot the inset patterns the profiles and for Å were first transformed to the profile conditions of the profiles and for Å and then subtracted from the latter. The difference between experimental and theoretical differential patterns is largest in a vicinity of the strongest peak given by the overlapped (023) and (113) reflections. In terms of both and structural models, the intensity of each of the (023) and (113) reflections should not vary with simultaneous changing the Co and Ho scattering power, as is expected from . However, it is observed in that the (023) reflection is enhanced at Co K edge, while the (113) reflection is suppressed. The whole difference profiles including the divergence between and in the area of (023,113) reflections were observed to be nearly independent on the choice between the and structural models.
Among the orthorhombic swedenborgites several compounds were refined previously with the S.G.’s and . The S.G. was found first to suit the structure of a Zn-based swedenborgite[13]. Later, the x-ray diffraction patterns of REBaCo4O7 for a number of RE were indexed with the orthorhombic cell of the symmetry[1]. We observed a few unindexed extra diffraction peaks, such as the reflection (105) in Fig.2, which could be indexed within the S.G. suggested recently for YbBaCo4O7[8]. Since the intensity of the extra reflections is extremely small, their occurrence has, in fact, a very small effect on the result of refinement. Therefore the R-factors are quite similar, and even better sometimes for than for . The results for both and symmetries are shown in Table 1. Resulting structure in terms of is similar to that of YbBaCo4O6.95 at 150 K[8]. The structure refined in terms of is shown in Fig. 6.
In the higher-symmetry phase above there are three nonequivalent oxygen sites. We call O1 the oxygens in the center of the star Co4O13. Other oxygens at the bottom of K-layer in Fig. 1 are called O2 and those on top of K-layer are called O3. The atoms of cobalt and oxygen in the Tables 1, 2 and 3 are denoted, depending on the S.G., by single or double indices to simplify the comparison between the low- and high-temperature phases. In the high-temperature phase, there occur just two inequivalent positions for Co labelled as Co1, Co2. With lowering symmetry in the low-temperature phase, each of the Co2, O2 and O3 splits into two () or three () positions. Then the second index is added for these positions.
Interatomic distances for the first coordination spheres in the low-temperature phase are shown in Table 2. Obtained for the S.G. () average distances Co1-O and Co2-O are 1.892(1.900) Å and 1.918 (1.900) Å, respectively. Average Co-O distances for different Co sites in the kagomé layer are 1.921(1.958) Å, 1.907 Å and 1.926(1.871) Å. Some preference of the Co1 site for Co3+ ions can be suggested only for the S.G. , however, any charge stratification between K and T layers cannot induce orthorhombicity. Therefore the hypothesis of charge ordering is implausible within the model. In the model, the state with Co3+ placed into the smallest Co23 site is not a degenerated state because of double multiplicity of this site compared to the multiplicities of the remaining Co1 and Co21 sites. Therefore, neither nor models fit the idea of charge ordering.
We suggest another origin of the orthorhombicity, which is related to locking
the rotational motion of tetrahedra in kagomé layers. This motion is
visualized with the use of anisotropic thermal factors in Figs. 6 and 7.
Within the refinement of isotropic thermal factors the obtained were too unrealistic ( Å2) for several oxygen atoms in the
structural models based on the S.G.’s and
. Therefore, in these models, the anisotropic
motion was allowed at fitting the thermal displacement factors of the O2 and
O3 atoms. This was not necessary for the model
One thus observes at cooling through locking the rotational
motions in the O3 sites only for model, but in both O2 and O3 sites
for model. In the high-temperature phase , the correlated
motion in the O2 and O3 sites can be thought as a rigid-body libration of the
CoO4 tetrahedron. Such a rigid-body picture is not contemplable for the
model, in which only the O31 and O32 sites showed unusual thermal
displacement factors. Related large deformations of tetrahedra are unlikely.
Therefore, through the rest of this article the model of the
low-temperature phase will be considered in more detail.
Table 2. Cation-oxygen bondlengths for all Ho, Ba and Co cations in
HoBaCo4O7 at 300K.
Bond
Bond
Bond
Ho-O21
2.291(13)
Ba-O23
3.377(13)
3.298(6)
Co21-O1
1.973(15)
2.144(8)
Ho-O22
2.152(12)
2.190(8)
Ba-O31
2.819(10)
3.162(5)
Co21-O21
1.867(15)
Ho-O23
2.269(14)
2.264(7)
Ba-O31
3.494(10)
Co21-O23
1.882(16)
1.853(7)
Ho-O31
2.452(14)
2.499(7)
Ba-O32
2.940(14)
Co21-O31
1.963(17)
1.98(1)
Ho-O32
2.383(18)
Ba-O32
3.387(14)
Co22-O1
1.979(15)
Ho-O33
2.363(18)
2.357(9)
Ba-O33
2.970(13)
3.141(1)
Co22-O21
1.866(15)
Ba-O33
3.353(13)
3.19(1)
Co22-O22
1.978(15)
Ba-O21
2.742(11)
Co22-O32
1.805(23)
Ba-O21
2.534(12)
Co1-O1
1.897(8)
1.910(9)
Co23O1
1.996(15)
1.892(5)
Ba-O22
2.969(12)
2.785(8)
Co1-O31
1.796(8)
1.80(1)
Co23O22
1.927(15)
1.970(5)
Ba-O22
3.313(13)
3.498(8)
Co1-O32
2.011(17)
Co23O23
1.977(15)
1.883(8)
Ba-O23
2.900(13)
2.979(6)
Co1-O33
1.840(17)
1.945(1)
Co23O33
1.802(23)
1.739(9)
*The indicated bondlengths have double abundance in the S.G. due to the multiplicity 8 for the positions of Co23, O23 and O33.
The lattice parameters refined at 380 K are Å and Å. The S.G.’s and were examined and gave the quite similar parameters of fitting quality. In the Table 3, the atomic coordinates obtained within the S.G. are shown. In a recent study of single crystals of HoBaCo4O7[14], the arguments in favor of the latter S.G. were obtained from observing the equal intensities of symmetry-equivalent reflections. For example, the reflections (101) and (011) are symmetry-equivalent. Such distinguishable in single crystals reflections should have different intensities for . In our Rietveld refinements with both S.G.’s and , we found while using , that the S.G. permits to reach a better fit than the S.G. . However, with the S.G. the equally good fitting quality parameter ( ) was readily obtained through introducing the anisotropic factors of thermal displacements for O1 and O3 atoms. The refined anisotropic parameters for these atoms are shown as footnotes under Table 3.
Table 3. Atomic coordinates for HoBaCo4O7 at 380 K. S.G. .
| Atom | * | |||
|---|---|---|---|---|
| Ho | 2/3 | 1/3 | 0 | 0.4(3) |
| Ba | 2/3 | 1/3 | 0.6258(7) | 1.5(3) |
| Co1 | 0 | 0 | 0.569(3) | 0.4(2) |
| Co2 | 0.1705(7) | -0.1705(7) | 0.805(2) | 0.4(2) |
| O1 | 0 | 0 | 0.357(5) | 1.8(9) |
| O2 | 0.498(3) | -0.498(3) | 0.852(4) | ** |
| O3 | 0.837(3) | -0.837(3) | 0.131(4) | *** |
*Anisotropic thermal displacement factors were refined for O1 and O3.
**==0.026(9), =0.07(1), =0.02(1), =-=-0.005(5) Å2.
***==0.12(2), =0.01(1), =0.11(2), =-=-0.002(4).
Each of the Co sites in the kagomé layer is larger than the Co1
site.
In the high-temperature phase, we found the average distances Co1-O and Co2-O of 1.96(2) Å and 1.86(2) Å, respectively. From low- to high-temperature phases, we observe, irrespective of the S.G. assumed for the low-temperature structure, that the average Co2-O distances are shortened, while the average Co1-O distances are elongated. Especially, for the S.G. each of the Co sites in the kagomé layer is larger for , but opposite is true for . The larger size for the Co1 site, is the argument against the larger valence of Co1 than that of Co2. The same trends were noticed by Huq et al[8], although these authors have refined the high-temperature structure with the S.G. . We note, however, that the cobaltites REBaCo4O7, in which a larger valence was found for Co1 than for Co2 [9], did not show any structural phase transition. Judging from the relationship between and such the transitionless cobaltites must be ”in the low-temperature phase” with vanished by some reason structural distortion. The observed inversion of this relationship at heating through has inspired our effort to search for the changes across in the spectra of XAFS and Mössbauer.
2.2 X-ray absorption spectra near Co K-edge
The XAFS spectra of HoBaCo4O7 and YBaCo4-xFexO7 (=0 and 0.1) are very similar (Fig. 8) The XANES begins with a pre-edge peak at E=7710 eV followed by the main edge and the ”white line” maximum of absorption at 7730 eV. These pre-edge peak and white line correspond to the electron transitions from 1s orbital to the 3d and 4p bands respectively. Derivative spectroscopy using the second derivative of XAFS ensures the effective enhancement of resolution, which can be useful to separate two or more overlapping subbands. The pre-edge peak in tetrahedrally coordinated Co site is composed of the vacant orbitals situated in the eg and t2g subbands. Even if they are unresolved in the pre-edge peak as wide as 5 eV, taking the second derivative of the XAFS spectra could be useful to resolve them as the separated minima of . In an octahedral Co site of La1-xSrxCoO3, for example, such a manipulation allows to resolve the eg and t2g subbands separated by 2.5 eV [15].
Because our XAFS station was not equipped with a furnace, all measurements were done at 300 K. Instead of measuring the spectra of a REBaCo4O7 across the phase transition, the spectra were measured for RE=Ho and Y with =355 K and 280 K, respectively[16]. The only difference between the spectra for RE=Ho and Y is that the high-energy shoulder of near =7712 eV is better articulated in the low-temperature phase (RE=Ho). In a tetrahedral coordination, the eg subband lies lower in energy than the t2g subband. Therefore, for the high-spin Co2+ () the orbitals are full and the orbitals are half-filled. The predominant minimum of should be ascribed to the orbitals of the high-spin Co2+ associated with 75% of the total pre-edge peak area. Remaining 25% are due to Co3+. The K-edge Co3+ is expected to move to higher energy as a whole, including the pre-edge peak, by ca. 2 eV. In the high-spin (HS) state of the tetrahedrally coordinated Co3+, the splitting of the pre-edge peak is expected, since one half-filed orbital appears in the subzone, however, in the intermediate-spin (IS) state of such Co3+, the pre-edge peak is unsplit again as it would come entirely from the transition . Therefore, the feature near =7712 eV must be better pronounced for the lower spin-state of Co3+. Comparing Seebeck coefficient measured in YbBaCo4O7 with theoretically predicted spin-dependent values Maignan et al.[4] found that both Co2+ and Co3+ are in HS states. Our spectra are consistent with the HS states of Co2+ and Co3+, although a presence of some IS Co3+, especially in low-temperature phase, cannot be excluded.
2.3 Mössbauer spectra
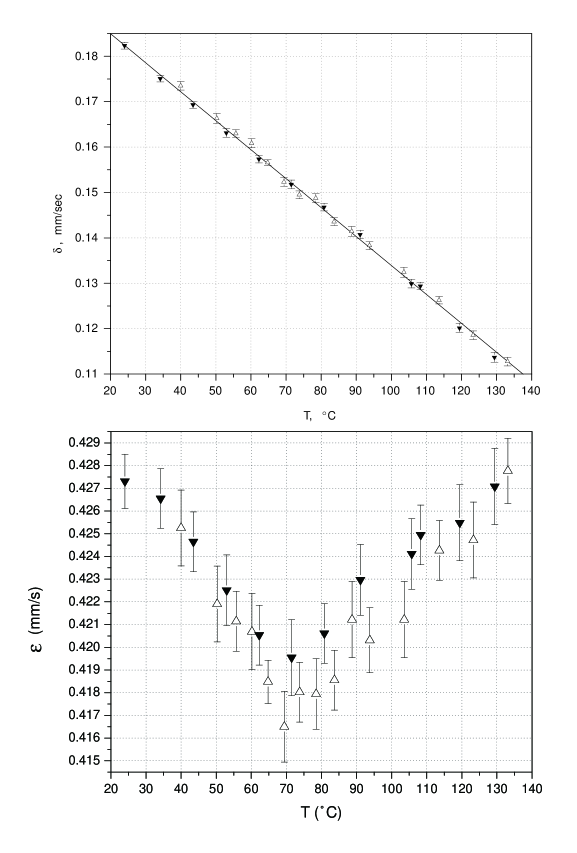
Our Mössbauer spectra collected in the temperature range between ambient temperature and 133oC consist of two series. First, from one measurement to another, the temperature was ascending. In second series, the measurements were made for a sequence of temperatures at cooling the sample. All the obtained spectra are quite symmetric doublets (Fig.9). Spectra treatments are in order, that would take into account the occurrence of four non-equivalent sites for the Fe dopants at and two sites at . However, up to date it was feasible only to fit each spectrum either with two-doublet or one-doublet (averaged) envelope. In the two-doublet spectra treatment, the following parameters of the doublets were obtained at room temperature: mm/s; 0.389 mm/s and mm/s for the majority (80%) subspectrum, and mm/s; 0.693 mm/s and mm/s for the minority (20%) subspectrum.

In the studied range of temperatures 297 K 406 K, the average quadrupole splitting is varied by 0.01 mm/s only. In such a narrow range, the determination of the behavior of the spectral parameters was feasible first of all due to high accuracy of our experimental setup. Second, a special analysis of the Mössbauer data treatments was performed. Namely, the accuracy of determination of spectral parameters in each spectrum was taken into account as described below.
Parameters of the Mössbauer spectra were determined by a standard technique via minimizing the value of
| (1) |
i.e. finding the vector of parameters of the theoretical spectrum , such that In this work, for all spectra we adopted the generalized treatment, in which the parameter vector was represented by four elements only: (1) average number of counts at infinite velocity, (2) chemical shift , (3) quadrupole splitting ; (4) linewidth of the lines of the doublet. Here i=1,…,N are the experimental points, is the number of counts in the channel and is the evaluation of the dispersion in the experimental spectrum.
During the spectra measurements in this work, the spectrometer operating time up to 1 month has been reached, however, the errors in determining the parameters from the minimization of in each spectrum (Eq.1) do not involve any drifts and/or uncontrolled instabilities related to a long-term experimental run. In order to estimate the relative contributions of the long-term sources of the errors the following procedure was adopted. First, we assumed that the chemical shift must depend on the temperature linearly as it does the so-called second-order-Doppler (SOD) shift, or ”red shift”. Therefore, we fitted 27 obtained values of the chemical shift with the straight line. The errors of chemical shift obtained from non-linear regression of each of these 27 spectra (Eq.(1)) were used in this linear fit. As a result we obtained an estimation of the squared deviation of the experimental chemical shift values (i.e., as a component of the parameter vector in Eq.(1)) from the linear temperature dependence hypothesis:
| (2) |
Here S=27, A=0.198 mm/s and B=-6.38 (mm/s) K-1 are the parameters of linear temperature dependence of the chemical shift, obtained through minimizing the value of in the Eq.(2). The value of A refers to =273 K.
It was supposed then that the uncontrolled long-run instabilities of the spectrometer can be taken into account through introducing a coefficient according to the following substitution . The value of can be estimated at the condition that the minimum of from Eq.(2) reaches its theoretical value when is replaced with :
| (3) |
Here is the number of degrees of freedom for the random variables in Eq.(2). The calculation performed according to this procedure has led to the result Next, the errors in estimations of the chemical shifts and quadrupole splitting parameters were multiplied by the coefficient . The result of this operation is shown in Figs. (2) and (3). Finally, our analysis resulted in the average error of the quadrupole splitting not exceeding 0.0017 mm/s. The presented analysis is thus suggesting that the observed variation of near , although small, is the intrinsic and reproducible property of the material.
3 Discussion
The generalized procedure of analyzing the Mössbauer spectra allowed us to treat in the same way the spectra above and below =355 K. More detailed treatments of our spectra, to be presented elsewhere, would take into account the occurrence of four non-equivalent sites for Co at and two sites for Co at . Recently, two subspectra were resolved at 4K in YBaCo3.96Fe0.04O7.02 owing to a difference of magnetic hyperfine fields T[17]. The authors claim that the Mössbauer spectra cannot resolve the difference between the sites Co21, Co22 and Co23, however, it is not clear from their article [17], whether or not the orthorhombic distortion was present at all in their sample. No orthorhombicity down to 100 K was observed recently in single crystals of HoBaCo4O7[14], however, the reason of such a suppression of the phase transition is yet not understood. When fitting our Mössbauer spectra of HoBaCo4Fe0.1O7 at 300 K (Fig.9) with two doublets we observe the ratio of the areas of the doublets 4:1, with the 80% abundance of the narrower doublet. This is different from the ratio reported by Tsipis et al. (3:2)[17], although the radii of Y and Ho are similar, so that the distribution of Fe dopants over the Co sites is expected to coincide. However, the difference of distribution could be related to the structural difference if the orthorhombicity in the samples of these authors[17] is suppressed, similarly to the samples of Ref.[14]. Another reason for such a divergence may arise as a purely mathematical trick if the Mössbauer spectrometer instrumental linewidths and lineshapes are very different. These arguments justify our choice in the present work of the method of spectra treatment, which simplify the comparison of obtained parameters between the samples with subtle structural differences.
Both temperature regions above and below =355 K in our HoBaCo4O7 were characterized by very similar Mössbauer spectra. Also, the XAFS spectra of HoBaCo4O7 and YBaCo4O7 are very similar at 300 K despite 300 K in HoBaCo4O7, but 300 K in YBaCo4O7[16]. From these spectra we have shown that Co2+ is in high-spin state. The same conclusion was drawn recently from the results of soft (Co L2,3) x-ray absorption spectroscopy[18]. In addition, we have shown that the high-spin state is ubiquitous on both sides of . Concerning the spin state of Co3+ the distortion of tetrahedral coordination would be associated to lifting the degeneracy either between double degenerated states for S=2, or between triple-degenerated states for S=1. For example, the S=1 spin state correspond to a distortion which splits off a level for the hole location at the top of the band. Distortion of a tetrahedron via twisting a pair of vertices relative to other pair would produce such a splitting[25]. In both low-and high-temperature phases, we cannot exclude the formation of intermediate-spin state for Co3+. Indeed, obtained distortions for the CoO4 tetrahedra are stronger than the distortions reported in Ref. [14].
Observed quadrupole splitting varies within in the range =20%. The charge redistribution at , seen not only via the change of the Co-O distances, but also via jumps of resistivity[3, 4], looks after all very different than a charge ordering at a metal-insulator transition. Much larger changes of quadrupole splitting across are usually expected when the charge ordering is driven by an orbital ordering. Huge jumps of are typically associated with the orbital ordering. For example, in BiMn0.95Fe0.05O3, the jump-like anomaly mm/s of quadrupolar splitting at was observed[19]. In the manganites of the family REBaMn1.96Fe0.04O6, fourfold increase of the quadrupole splitting was observed (at 300K) in the charge and orbitally ordered compounds (RE=Y,Gd,Sm) compared to unordered ones (RE=La,Na,Pr) [20, 21, 22]. The orbital ordering coupled with charge ordering is therefore unlikely to drive the structural phase transition at .
Huq et al.[8] suggested the origin of the transition to be a ”response to a markedly underbonded Ba2+ site in the high-temperature phase”. The ion Ba2+ occupies an anticubooctahedral site. In an ideal anticubooctahedral coordination, there are 12 equidistant ligands. The geometry of the anticubooctahedron close to ideal one was found in several studies on single-crystalline samples of REBaCo4O7 for RE=Ho[14], Lu[23], however, severely distorted in other structural studies on single-[7] and poly-[8, 24]crystalline samples. The Ba-O distances of 3.14 Å reported for nearly ideal anticubooctahedron by Juarez-Arellano et al.[14] in HoBaCo4O7 and Kozeeva et al.[23] in LuBaCo4O7 seem to be too large for ordinary bondlengths of Ba2+. No phase transition was reported in such samples. In other studies, the distortion of the anticubooctahedron was reported to shorten the shortest Ba-O bondlength down to 3.08 Å in YBaCo4O7[7], 3.02 Å in HoBaCo4O7[24], 2.8 Å in YbBaCo4O7[8]. The average Ba-O distances of 3.14 are nearly independent of RE, however, the distortions in much broader range were reported depending on the symmetry.
In each of the structure models, , , and , the distortion of the anticubooctahedron makes a number of Ba bondlengths increasing, and the same number of Ba bondlengths decreasing. The average Ba-O distance remains unchanged. Namely, within the model, 6 oxygens of 12 remains at the ideal distances, 3 of them are allowed to move inwards and 3 other outwards of the ideal anticubooctahedron. For the model, such a ratio changes from 3:6:3 to 5:2:5. The lower symmetries and allow the distortion ratio 6:0:6, however, in YbBaCo4O7 Huq et al.[8] obtained within the model the anticubooctahedron distortion scheme 3:6:3 similar to that of model. This means the very small changes of bondlengths of 6 oxygens compared to the ideal anticubooctahedron. Therefore, the authors argued that the change of the distortion scheme of the anticubooctahedron from ”3:6:3”-like above to 6:0:6 below is at the origin of the phase transition. This conclusion is not contradictive to our viewpoint, the more especially as we fitted successively the high-temperature phase only with the model, which is intrinsically distorted according to the same 3:6:3 scheme. Although both the and models result in similar R-factors for the high-temperature phase, only the model gave us plausible interatomic distances. Indeed, when trying to fit the high-temperature phase with the model, we obtained the distortion of the anticubooctahedron much larger than that reported by Huq et al.[8]. In addition, the unrealistic Co-O distances of the order of 1.7 Å resulted, which obliged us to reject the model.
Thus the driving force of the transition to lower symmetry is likely to arise from too loose bonding of Ba2+ in the symmetric anticubooctahedron. While the Ba2+ coordination polyhedron tends to collapse with lowering temperature, we do not observe that the coordination polyhedra of the Co ions change so dramatically. Displacive phase transitions in the tetrahedral networks are frequently driven by a soft optic phonon, which can propagate without distortions of tetrahedra. Such modes were called rigid-unit modes (RUMs)[26].
The coordination polyhedron of Ba2+ is formed by O2 and O3 atoms. Each of these oxygens enters the first coordination sphere of two Co, two Ba2+ and one Ho3+. On the other hand, the O1 atom enters to the first coordination sphere of four Co ions. Therefore, the deformation of the Ba2+ coordination correspond to the motion of O2 and O3 atoms, which would be also represented in terms of kagomé network as the motion of the of the O2 and O3 tetrahedral vertices around the O1 vertex. This is because each Co in the kagomé layer (Co2 site) is coordinated by one O1, one O3 and two O2 atoms.
Since the more covalent bonding is stronger within the framework of the CoO4 tetrahedra compared to the ionic bonding on the exterior of the framework, the distortion of the tetrahedra will cost more energy. The associated with such a distortion phonon modes would lie rather high on the frequency scale. On the opposite, the RUMs that do not involve any significant stretching of the Co-O bonds will have low frequencies. One of the low-energy RUMs appears to be strongly temperature-dependent to become a soft mode driving the phase transition. This mode permits the intertetrahedral motions associated with bending the Co-O-Co links, where the central O atom can be viewed as a ”hinge”. The rotations of tetrahedra around the ”hinges” are hindered either by the size of collapsed cavity around Ba2+ or by repulsion between oxygens getting too close to each other. Such hindered rotations named librations are commonly observed in tetrahedral networks [27]. In Fig.11, the O-”hinge” can be identified at the O1 atom (exactly at the center of the top panel in Fig. 7).
From Fig. 7 it is evident that our low-temperature phase is quite similar to that reported for YbBaCo4O7[8]. It is also clear that the low-temperature phase can be obtained from the high-temperature one via quenching the positions of the O3 atoms at the endpoints of a counterclockwise rotation. Since the O3 site splits into three below the rotation angles are different (in the range between 5 and 10 deg.) for O31, O32 and O33. The rotation axis [001] is the same for O31, O32 and O33, therefore, these oxygens keep their planar arrangement as in high-temperature phase (see the central plane at the bottom of T-layer in Fig.1).
According to the RUMs concept, the axial rotation of the tetrahedral vertices located on top (in terms of Fig.1) of the kagomé layers cannot occur without -displacements of the O2 atoms at the bottom of these kagomé layers. This is because only 25% of the oxygens at the bottom of kagomé layers are located on the rotation axes. These O1 atoms constitute the rotation ”hinges”. Other 75% oxygen sites in this plane are the O2 sites, which split into O21, O22 and O23 in the low-temperature phase. Due to the rotation of the tetrahedral ”rigid units” the O21 and O22 atoms get out of the plane, in which they were in the high-temperature phase.
The shift of the O21 site along -axis is as large as 0.52 Å. This is consistent with the largest rotation angle for the O31 atom, which belongs to the tetrahedra of Co21 (in Fig.7 two of these tetrahedra form a vertical ”sandglass” figure extended along -axis around the central O1 atom). Smaller rotation angles are shown in Fig.7 for the O32 and O33 atoms, which belong to the tetrahedra of Co22 and Co23, respectively. This is in agreement with smaller out-of-plane -shift of the O22 atoms (0.14 Å), which belong to both Co22 and Co23 tetrahedra. The third site O23 remains at the same -level as in high-temperature phase. This site belongs to Co21 and Co23 tetrahedra.
Thus, the tetrahedra faces, which were parallel in high-temperature phase, become slightly tilted relative to horizontal plane. The measure of tilts for the bottom faces of Co21 and Co23 tetrahedra are the -shifts of corresponding vertices, i.e., 0.52 Å and 0.14 Å, for Co21 and Co23 tetrahedra, respectively. The degree of tilt for the Co22 tetrahedra, which is formed by the O21 and O22 vertices is measured by the difference of their -shifts, is Å. This relationship directly follows from the symmetry Pbn21. Because of such a relationship between the values of -shifts for O21, O22 and O23 atoms the spread between the tilts of three tetrahedra surrounding the O1-hinge becomes unavoidable. Quite similar spread was obtained by Huq et al.[8]. If the tetrahedra are indeed behaving as rigid-units, the related spread would in turn appear in the angles of rotation of the three O3 atoms around the O1— axis. Comparing the results of our refinement with the data of Ref. [8], we show in Fig.10 that the spread is quite similar for HoBaCo4O7 and YbBaCo4O7.
In high-temperature phase, where all three O3 atoms around the O1— axis are equivalent, they librate with equally large amplitudes as shown at the upper panel of Fig.7. The thermal displacements of O3 atoms have no component along , however, the component is the main component for O2 atoms (see the footnote of Table 3). However, because the rigidity of tetrahedra put the constraint on the shifts of three O2 atoms, the rotations cannot be condensed below within the high-symmetry model , in which all of the O2 sites are equivalent. Therefore, the rigid-body libration of tetrahedra lowers the symmetry, so that the orthorhombicity directly follows from combining the RUM condensation with translation symmetry.
In tetrahedral networks, various constraints on possible models of deformation of these networks were described previously by Dove et al[28]. In the anion-close-packed systems, the structure becomes highly susceptible to the libration-like motions when the proportion of ”bridgelike” two-coordinated anions is large. For example, in the red mercury HgI2, where all the anions are bridgelike, the coupled librations of HgI4 tetrahedra are unconstrainted and the thermal displacements of anions are strongly anisotropic[29]. This is not the case for the built of tetrahedra and octahedra structure of spinel M3O4, in which all the oxygens are four-coordinated. A detailed comparizon of the structure of REBaCo4O7 with spinels, hexaferrites, perovskites and with YBaFe4O7 ferrite was recently made by Caignaert et al[30]. In these structures, the fraction of bridgelike oxygen increases with increasing the fraction of large-size cations. Like in the red mercury, in the perovskites, all the oxygens are bridgelike and the perovskites are reach by their famous soft modes.
Phase transitions known for the tetrahedral and octahedral networks are classified into displacive transitions and the transitions of the order-disorder type. In a simple model of double-well potential[10], the type of transition is determined by the relationship between energy of harmonic forces between neighboring atoms and the height of the barrier between two minima of the potential well. The degree of displaciveness for a transition is given by the parameter . We are in the displacive limit when and in the order-disorder limit when . Interestingly, an intermediate type of transition () was attributed to freezing the librations of large amplitude, such as librations of CO3 groups to angle in calcite[10].
In the displacive limit, there exist a well established relationship between the transition temperature and the angle of rotation of tetrahedra at 0 K:
| (4) |
Markina et al.[2] and Juarez-Arellano et al.[14] have reported nearly linear relationship between the value of in REBaCo4O7 and the size of ionic radii of RE. The temperature increases twice when the size of RE increases by 4%. The radii of Yb and Ho differ by 3%. However, in Fig.7 we observe that the values of are very similar for RE=Yb and Ho. The force constant in the Eq.(4) is the stiffness of the rigid-body unit. Therefore, if we are in the displacive limit, where the Eq. (1) is valid, the linear relationship between and may signify the increase in the strength of the Co-O bonds with increasing the ionic radius of RE. This phenomenon can be regarded as the manifestation of the inductive effect[31] in the kagomé network: Co-O bonding is reinforced at the expense of RE-O bonding. Indeed, all the O2 and O3 sites (85.7% of all oxygen sites) are coordinated by two Co, two Ba, and one RE. The inductive effect[31] related to decreased covalence of RE-O bonding with increasing the size of RE would concern these O2 and O3 sites.
Only remaining 14.3% oxygen sites (O1-sites) are not bound to RE, as they are coordinated by four Co. With respect to the covalent Co-O bonding, a bridge-like (O2 and O3) and tetrahedral (O1) oxygen can be distinguished. The latter shows more ionic bonding and longer Co-O bonds.
All Co ions are, in their turn, containing in their first coordination sphere three bridgelike oxygens and one tetrahedral oxygen. Two types of ligands for each Co presents the plausible argument to explain rather narrow lines of the symmetric doublet observed in the Mössbauer spectra. In spite of the occurrence of four different sites for Co in the low-temperature phase, the spectrum shown in Fig. 9 evidences the narrow distribution of EFG over these sites. If we attribute the origin of EFG to strong difference between the bridgelike and tetrahedral oxygen ligation, then the EFG can be explained in terms of point charge model for the first coordination sphere. Then due to the symmetry in high-temperature phase the EFG on each of the Co sites should be oriented along the longest Co-O1 bonds for both Co1 and Co2 sites.
The tetrahedra are non-ideal rigid bodies, therefore, in low-temperature phase each of three tetrahedra in kagomé layer is distorted in its own manner. However, we observe only the change of within 3%. This is an important observation, which would let us to estimate whether or not the partial contribution of each ligand to EFG depend on the bond angles. Generally, upon variation of bond angles the partial contribution to EFG may change because fractional character of the bonds changes[32]. However, the families of compounds exist, in which the assumption of angle-independent partial contributions is a good approximation. One of such families includes, for example, brownmillerites and high- superconductors with ”1212” structure[33]. The high- cuprates, so different at first sight from brownmillerites, show very similar ligation for iron located at the midway between the cuprate planes[33, 34, 35].
The quadrupole splitting is related to the EFG tensor main component and EFG asymmetry via[35]:
| (5) |
Here keV is the transition energy, and is the quadrupole moment of the excited state of the 57Fe nuclei. From the electric field gradient Vzz in units of V/m2 the quadrupole splitting in mm/s can be obtained using the factor mms-1V-1m2 for the value of 0.16 barn. The Eq.(5) shows that the changes in signifies either variation of or variation of or both.
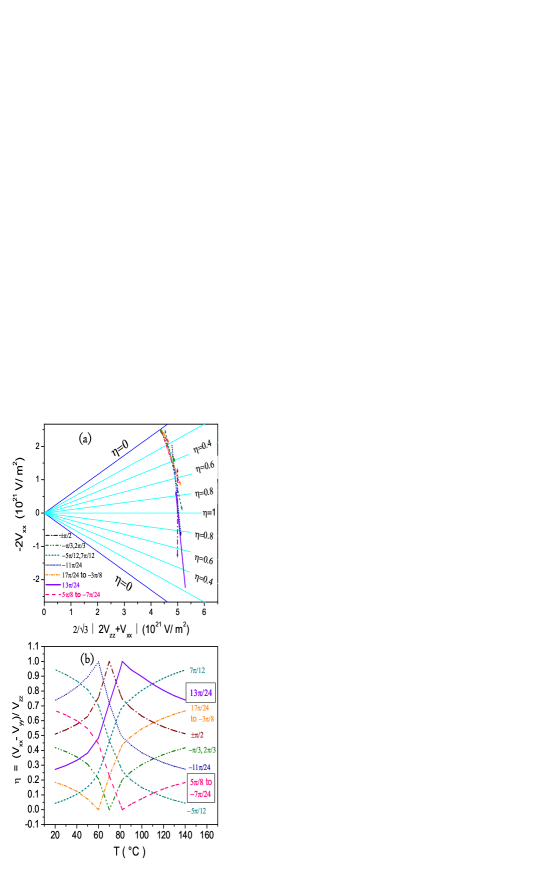
The behavior of is well predictable in a vicinity of a second-order phase transition. Displacive phase transitions are usually close to the continuous phase transitions, which are described though rigorously with renormalization group theory as first-order-like, in practice exhibit the size of first-order discontinuities so small as to be virtually unobservable[10]. Through the continuous phase transitions an empiric rule was established[36], which states that all three components of EFG tensor depends linearly on a single control parameter. In other words, the changes of principal component and asymmetry of EFG tensor are correlated and both and vary continuously through such a transition. Symmetry breaking obviously underlies this rule in a vicinity of axiality () or antiaxiality ().
The non-trivial correlation between and is illustrated by the linear trajectories of the system in the so-called Czjzek-plot, in which is plotted versus [32, 36]. These axes are chosen to make use the intrinsic properties of the EFG tensor, which is symmetric and traceless. Therefore at the condition of antiaxiality (at horizontal axis in Czjzek plot, Fig.12a) , where changes its sign by definition, the system pass the line without refraction. On the other hand, at the system reflects from the borders of Czjzek plot with billiard kinematics. These properties are satisfied always when each component of the EFG tensor depends linearly on a single control parameter [36]. This parameter is in turn a function of temperature .
In Fig.12(b), we plotted versus assuming several linear paths of the system in Chjzek-plot shown in Fig. 12(a). First of all, the path at the angle of to horizontal axis crosses the line at the same temperature where shows the minimum in Fig. 10. Therefore, curve culminates at C in Fig.12(b). Also, the trajectory, which starts at the angle of 2 near , then goes to the upper border of the Chjzek-plot, reflects from the line backwards to the angle of - and returns back to , produces the curve with the minimum at C. The path tilted to the midway angle with the directions towards (- and (7) produces two curves with no extremum, but with sigmoidal shape having the inflexion again at C. These two curves correspond to two opposite directions of increasing temperature along the same line indicated by arrows on Czjzek-plot (Fig.12,a).
Next, we investigate the trajectory tilted to the angles intermediate between and 2 As in the case of 2 such a trajectory is reflected from the border of Czjzek-plot, but now not at the right angle. The path starting at the angle of reflects to the angle of . Moving in the opposite direction along the same trajectory we start from short segment at the angle of 5 and reflect to -7 In both these cases, the reflection point does not coincide with the minimum of the curve in Fig.10. Because our experimental data for are more or less symmetric relative to the minimum at C, two possible trajectories for these angles generate two curves for . One of them shows minimum at ∘C and another shows minimum at ∘C.
In the same way, two trajectories in the Czjzek-plot and two curves can be generated for the angles of - and 13 along the line intermediate between and These two paths cross the horizontal axis ( line) at different temperatures. Again the generated curves culminate at ∘C and at ∘C.
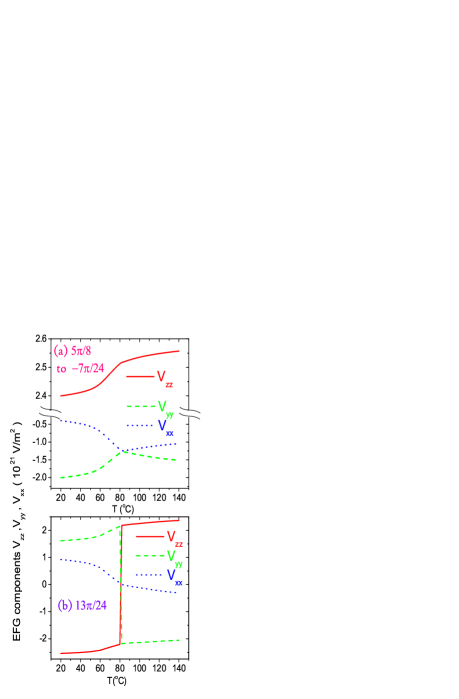
Since we know now both values of and along each path in Czjzek plot, we can derive each component of the EFG tensor. In the displacive limit, the behavior of the in a vicinity of is expected to follow closely the behavior of order parameter around the point where symmetry breaks[36]. Two of the obtained curves culminate indeed at ∘C. Therefore, if we are indeed not far from the displacive limit, the EFG components , and should behave as shown in Fig.13. In the first case (5 to -7), the EFG is nearly axial above ∘C, but quickly approaches to antiaxilality as the hexagonal symmetry breaks down. The non-principal EFG components exchange their direction at . The second case (13) is opposite. In the second case, the principal EFG component switch its direction at . The plot in Fig.13(a) corresponds to the appearance of the additional source of EFG below , which induces second large EFG component. On the opposite, the plot in Fig.13(b) correspond to the case when two large components of EFG exist above and one of them is extinguished at the expense of the displacements showing up with the breakdown of symmetry.
Only the first case fits the high-temperature axiality which should correspond to our classification of the oxygen ligands as bridgelike and tetrahedral ones. In this case the -axis of the EFG in its internal coordinate system must be directed from each Co ion towards ionic tetrahedral oxygen O1 (in the radial direction of Fig. 11). In this picture, the small asymmetry of EFG above arises from the structural difference between bridgelike oxygens O2 and O3. Because of non-ideal rigidity of tetrahedra below the displacements of the O3 atoms are larger than the displacements of the O2 atoms. The change in the bond angles and the associated change in the fractional character of these oxygen bonds result in the additional component of EFG, which becomes comparable in magnitude with the main EFG component.
4 Concluding Remarks
We have studied the temperature dependence of structure parameters and measured the hyperfine splitting of 57Fe in HoBaCo3.9Fe0.1O7 in the range =20% around the structural phase transition. Although the changes of within only 3% were observed, we showed that the non-principal EFG components ( and ) vary much more dramatically in a vicinity of K in agreement with the local structure changes at the symmetry-breaking transition. Although the variations of each of three individual EFG components , and are smooth similarly to the temperature dependences of the lattice parameters and , we have demonstrated the nonmonotonic behavior of the combination = , which experiences a dip-like (or cusp-like) anomaly at . In some vicinity of the temperature dependence of the EFG asymmetry is that of the order parameter as expected for a displacive phase transition.
Rietveld refinements of the structure on both sides of allowed identifying the main component of thermal motion which freezes as the hexagonal symmetry breaks down. The origin of the transition is ascribed to the condensation of the libration phonon mode associated with the rigid-body rotational movements of starlike tetrahedral units, the building blocks of kagomé network.
5 Acknowledgements
Authors thank Dan’kova V.S. for the preparation of some of the samples used in this work. This study was supported by RFBR under Grant No. 07-02-91201 and by a Grant-in-Aid for Scientific Research (JSPS Japan - RFBR Russia Joint Research Project and No. 19052004) from the Japan Society for the Promotion of Science.
6 References
References
- [1] N. Nakayama, T. Mizota, Y. Ueda, A.N. Sokolov, and A.N. Vasiliev, J. Magn. Magn. Mat. 300 (2006) 98.
- [2] M. Markina, A.N. Vasiliev, N. Nakayama, T. Mizota, Y. Yeda, J. Magn. Magn. Mat. (2009) doi:10.1016/j.jmmm.2009.03.002.
- [3] V. Caignaert, A. Maignan, V. Pralong, S. Hébert, D. Pelloquin, Solid State Sci. 8 (2006) 1160.
- [4] A. Maignan, V. Caignaert, D. Pelloquin, S. Hébert, V. Pralong, J. Hejtmanek, D. Khomskii, Phys. Rev. B74 (2006) 165110.
- [5] L. Pauling, H. P. Klug, and A. N. Winchell, Am. Mineral. 20 (1935) 492.
- [6] D.M.C. Huminicki, F. Hawthorne, The Canad. Miner. 39 (2001) 153-158.
- [7] M. Valldor, and M. Andersson, Solid St. Sci. 4 (2002) 923.
- [8] A. Huq, J.F. Mitchell, H. Zheng, L.C. Chapon, P.G. Radaelli, K.S. Knight, P.W. Stephens, J.Solid St. Chem. 179 (2006) 1136.
- [9] W. Schweika, M. Valldor, and P. Lemmens, Phys. Rev. Lett. 98 (2007) 067201.
- [10] M.T. Dove, American Mineralogist 82 (1997) 213-244.
- [11] R.A. Young and D.B. Wiles, Adv. X-ray. Anal. 24 (1981) 1.
- [12] J. Rodriguez-Carvajal. Physica B 192 (1993) 55.
- [13] Ch. Rabbow, Hk. Müller-Buschbaum, Z. anorg. allg. Chem. 620 (1994) 527.
- [14] E.A. Juarez-Arellano, A. Friedrich, D.J. Wilson, L. Wiehl, W. Morgenroth, B. Winkler, M. Avdeev, R.B. Macquart, and C.D. Ling, Phys. Rev. B79 (2009) 064109.
- [15] V. Sikolenko, A. Sazonov, V. Efimov, V. Krivencov, N. Darowski, D. Vyalikh, J. Magn. Magn. Mat. 310 (2007) e181-e183.
- [16] The value for our YBaCo4O7 was lower by 20 K than in YBaCo4O7 synthesized by Caignaert et al.[3], probably, owing to slightly different conditions of final annealing.
- [17] E.V. Tsipis, J.C. Waerenborgh, M. Avdeev, V.V. Kharton, J. Solid St. Chem. 182 (2009) 640-643.
- [18] N.Hollman, Z.Hu, M. Valldor, A. Maignan, A. Tanaka, H.H. Hsieh, H.-J. Lin, C.T. Chen, and L.H. Tjeng, Phys. Rev. B 80 (2009) 085111.
- [19] A.A. Belik, N. Hayashi, M. Azuma, S. Muranaka, M. Takano, and E. Takayama-Muromachi, J. Solid St. Chem. 180 (2007) 3401.
- [20] A.I. Rykov, Y. Ueda and K. Nomura, J. Solid St. Chem. 182 (2009) 2157–2166.
- [21] A.I. Rykov, M. Seto, Y. Ueda, K. Nomura, J. Appl. Cryst. 42 (2009) 496–501.
- [22] A.I. Rykov, Y. Ueda, K. Nomura, M. Seto, Phys. Rev. B 79 (2009) 224114.
- [23] L.P. Kozeeva, M. Yu. Kamaneva, A.I. Smolentsev, V.S. Danilovich, and N.V. Podberezskaya, J. Struct. Chem. 49 (2008) 1071.
- [24] M. Valldor, Solid State Sciences 6 (2004) 251.
- [25] R. B. King, Inorg. Chim. Acta 270 (1998) 68-76.
- [26] H. Boysen, B. Dorner, F. Frey, and H. Grimm, J. Phys. Chem. 13 (1980) 6127-6146.
- [27] K. L. Bartelmehs, R.T. Downs, G.V. Gibbs, M.B. Boisen, J.B. Birch, American Miner. 80 (1995) 680-690.
- [28] M.T. Dove, M. Gambhir, K.D. Hammonds, V. Heine, and A.K.A. Pryde, Phase Transitions, 58 (1996) 121-143.
- [29] D. Schwarzenbach, H. Birkedal, M. Hostettler, and P. Fischer, Acra Cryst. B63 (2007) 828-835.
- [30] V. Caignaert, A.M. Abakumov, D. Pelloquin, V. Pralong, A. Maignan, G. Van Tendeloo, and B. Raveau, Chem. Matter 21 (2009) 1116-1122.
- [31] J. Etourneau, J. Portier, and F. Menil, J. Alloys Compd. 188 (1992) 1.
- [32] T. Butz, Hyperfine Interaction, 151/152 (2003) 49.
- [33] A. Rykov, V. Caignaert, and B. Raveau, J. Solid St. Chem. 109 (1994) 295-306.
- [34] A. Rykov, K. Nomura, T. Mitsui, and M. Seto, Physica B 350 (2004) 287–304.
- [35] A.I. Rykov, K. Nomura, Y. Ueda, A.N. Vasiliev, J. Magn. Magn. Mat. 320 (2008) 950–956.
- [36] T. Butz, Hyperfine Interaction, 35 (1987) 1037.
7 Figure Captions
Fig. 1. Perspective view of the quadruple unit cell in the low-temperature phase of ReBaCo4O7. Kagomé and triangular layers of CoO4 tetrahedra are marked by ”K” and ”T”. The quadruple unit cell of HoBaCo4O7 is shown with atomic coordinates refined in S.G. .
Fig. 2. Three wavelengths used in the diffraction experiments shown on the plot of theoretical atomic scattering factor corrections and for Co and Ho (a); characteristic area of the high-resolution synchrotron x-ray diffraction patterns (Rietveld plots) at Å in the high-temperature (b) and low-temperature (c) phases of HoBaCo4O7. Structure of the low-temperature phase was refined at using either S.G. or , one of which () is shown in (c). Theoretical positions of the permitted reflections are shown in (c) for both and groups. Indicated by the arrow reflection is among very weak peaks extinguished for S.G. , but allowed for S.G. .
Fig. 3. The curves of differential thermal analysis in HoBaCo4O7 measured upon heating and cooling at a rate of 3 deg./min.
Fig. 4. Evolution of the lattice cell parameters a, b/ and c with temperature near the structural phase transition.
Fig. 5. The conventional (main panel) and differential (inset) Rietveld plots for the synchrotron x-ray diffraction data collected at T=300 K (below the phase transition) in HoBaCo4O7. Main panel: observed, calculated and difference intensities near Co K-edge ( Å). Inset: the differences CoK HoL and CoK HoL, where the profile HoL was transformed to the CoK profile conditions.
Fig. 6. Triple unit cell of HoBaCo4O7 refined with the symmetry group and viewed along [001]. The anisotropic thermal displacement factors refined for the atoms O31 and O33 are represented by the surface of 50% probability.
Fig. 7. [001] projections of the crystal structure in high- (top panel) and low- (middle panel) phases in HoBaCo4O7 obtained in this work, and in YbBaCo4O7(bottom panel, constructed for comparison according to the data of Ref. [8]).
Fig. 8. XANES spectra at the Co K-edge and the second XANES derivatives in the region of the pre-edge peak for HoBaCo4O7 (1), YBaCo4O7 (2) and YBaCo3.9Fe0.1O7 (3).
Fig. 9. A typical Mössbauer spectrum in HoBaCo3.9Fe0.1O7 (= 300 K).
Fig. 10. Temperature dependence of the chemical shift () and quadrupolar splitting () in HoBaCo3.9Fe0.01O7. Open triangles shows the data obtained point by point sequentially at heating the sample; filled triangles shows the data obtained sequentially at cooling the sample. The straight line in upper panel is the linear fit to the experimental data .
Fig. 11. The star-like fragment of the kagomé layer showing the surrounding of the O1 ”hinge”.
Fig. 12. (a) Czjzek-plot of versus with the EFG tensor components ordered according to . Lines originating from the origin are const. lines. The angles of inclination of the straight-line trajectories with respect to abscissa axis are indicated. Arrows show the direction of increasing temperature. (b) Corresponding dependences of the EFG asymmetry . The frames mark the curves for two trajectories whose EFG components are shown in detail in Fig. 13.
Fig. 13. Variation of the EFG tensor components for two straight-line billiard trajectories in Czjzek-plot with the direction of increasing temperature inclined at the angle to abscissa axis of 5 and reflected to (a) and (b). Corresponding dependences are marked by frames in Fig.12 (b).