First Observation of Diboson Production in Hadronic Final State at the Tevatron
Abstract
We present the first observation in hadronic collisions of the electroweak production of vector boson pairs (; ) where one boson decays to a hadronic final state. The data correspond to 3.5 fb-1 of integrated luminosity collected by the CDF II detector in collisions at a center-of-mass energy of 1.96 TeV. Event selection requires two identified jets and large transverse momentum imbalance. The analysis employs several novel techniques to suppress multijet background and reduce systematic uncertainties. We observe (stat) (syst) diboson candidate events and measure a cross section of pb, in agreement with standard model (SM) expectations.
I Introduction
The production of heavy gauge boson pairs (, , and ) has been observed in fully leptonic final states at the Fermilab Tevatron collider CDFlep ; D0lep . Evidence for diboson decays into an final state, with and , was recently presented by the D0 collaboration D0had . The analysis presented here is the first conclusive observation at a hadron collider of diboson production with one boson decaying into leptons and the other into hadrons CDFhad .
Measurements of the diboson production cross sections provide tests of the self-interactions of the gauge bosons, and deviations from SM predictions could indicate new physics Hagiwara:1986vm . Diboson production involving hadronic decays is also topologically similar to associated Higgs boson production, , when the Higgs boson decays to , the most promising discovery channel for a low-mass Higgs boson. Thus the analysis techniques described here will also be useful for Higgs boson searches.
II Experimental Apparatus
The CDF II detector is described in detail in Ref. CDFII . Surrounding the beam pipe is a tracking system consisting of a silicon microstrip detector, a cylindrical drift chamber, and a solenoid producing a 1.4T magnetic field along the beam axis. The central and forward calorimeters surround the tracking system with a projective tower geometry. The calorimeters are composed of inner electromagnetic and outer hadronic sections that consist of lead-scintillator and iron-scintillator respectively. A system of Cerenkov counters, located around the beam pipe and inside the forward calorimeters, measures the number of inelastic collisions per bunch crossing and thus the luminosity Acosta:2002hx .
The geometry of the detector is characterized by the azimuthal angle and the pseudorapidity , where is the polar angle measured from the proton beam direction. The transverse energy , where is the energy in the calorimeter towers associated with a cluster of energy deposition. Transverse momentum is the track momentum component transverse to the beam-line. The missing transverse energy vector is defined as , where is the transverse component of the unit vector pointing from the interaction point to the energy deposition in calorimeter tower . This is corrected for the of muons, which do not deposit all of their energy in the calorimeter, and tracks which point to uninstrumented regions in the calorimeter. The missing transverse energy is defined as . Strongly interacting partons undergo fragmentation that results in highly collimated jets of hadronic particles. Jet candidates are reconstructed in the calorimeter using the jetclu cone algorithm jetclu with a cone radius of 0.4 in () space. The energy measured by the calorimeter must be corrected to improve the estimated energy JES . The effects corrected for include the non-linear response of the calorimeter to particle energy, the loss of energy in uninstrumented regions of the detector, and the energy radiated outside of the jet cone.
III Event Selection
Events are selected which have large and exactly two jets whose invariant mass can be reconstructed. This signature is sensitive to both and decays because a charged lepton is not explicitly required in the final state. Due to the limited dijet mass resolution, there is significant overlap between the and dijet mass peaks. Therefore we consider as signal the combination of three diboson signals (, , and ), and search for diboson production in the dijet mass range GeV.
Events are selected using a set of -based triggers with a variety of and jet requirements. All of these triggers have benefited significantly from a calorimeter trigger upgrade completed in 2007 trigger . The majority (94%) of events satisfy the inclusive trigger which requires GeV. We require events to have GeV and exactly two jets with GeV and , which ensures a trigger efficiency of on signal as measured in events. Additionally, the fraction of the total jet energy which is in the electromagnetic calorimeter is required to be less than 90% to eliminate the possibility that electrons and photons are reconstructed as jets. Several criteria suppress contamination from non-collision backgrounds. Events are required to have at least one reconstructed vertex formed by charged particle tracks to remove cosmic-ray events. To reduce beam-related backgrounds, the electromagnetic fraction of the total event energy must be greater than 30%. Additionally, the arrival time of the jets as measured by the electromagnetic shower timing system timing must be consistent with the collision time. After all selection criteria are made, non-collision backgrounds are a negligible contribution to the sample (fewer than 90 events out of the total 44,910 selected events).
In order to suppress the multijet background described in Sec. IV.2, we use a resolution model to distinguish true originating from neutrinos from fake arising from mismeasurement of jet energies. The significance is a dimensionless quantity based on the event topology, the energy resolution of the jets, and the soft unclustered particles. The significance is calculated as follows:
| (1) |
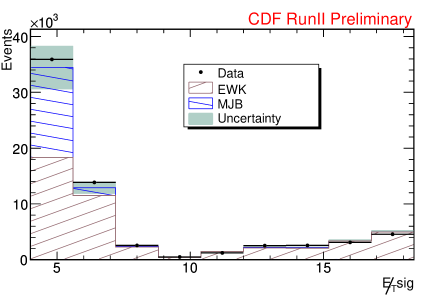
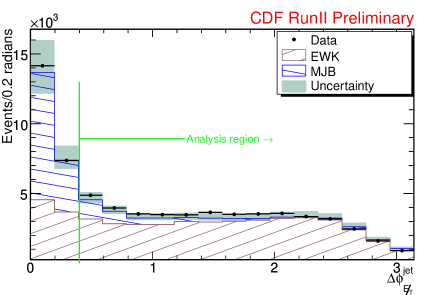
In Eq. 1, is the jet energy resolution function of the -th jet, is the energy of the -th jet, and is the azimuthal angle between the -th jet and . The jet energy resolution function , defined as a ratio of the detector-level and hadron-level jet energy, is obtained from dijet pythia Monte Carlo pythia as a function of a jet’s energy and pseudorapidity. The function is validated in inclusive events. The significance is typically low when arises from mismeasurement. In addition to having a small significance, the will often be aligned with a jet. Distributions of the significance and azimuthal angle between the and nearest jet () after all previously described selection criteria are shown in Figure 1. To reduce the multijet background, we select events with significance larger than 4 and greater than 0.4 radians.
IV Data Modeling
The diboson signals (, , and ) are simulated by the pythia Monte Carlo generator. After selection, the most significant backgrounds to the diboson signal are multijet production and electroweak (EWK) processes such as +jets and +jets. Less significant EWK backgrounds include +jets, top-quark pair production, and single top-quark production. The geometric and kinematic acceptance for all electroweak processes are determined using a Monte Carlo calculation of the collision followed by a geant3-based simulation of the CDF II detector response GEANT . Modeling of the backgrounds is described in more detail in the following sections.
IV.1 Electroweak Background
The electroweak (EWK) processes considered to be backgrounds to this measurement are the +jet and top-quark production processes. The +jets processes are simulated by the fixed-order matrix element generator alpgen alpgen interfaced with pythia to simulate parton showering and fragmentation, the underlying event, and additional interactions in the event. The +jets and top-quark production are simulated by pythia. The expected yields of all Monte Carlo-simulated background processes are normalized to SM cross sections calculated at next-to-leading order, although the overall normalization of this background is allowed to float in the final fit to data.
IV.2 Multijet Background
The multijet background (MJB) does not typically result in signatures of large . However, when jet energy is not measured accurately an event may be reconstructed with large fake and thus pass the event selection. Due to the large rate of MJB production, this is still a significant background. Much of the MJB is removed by the requirements on the significance and variables described in Sec. III. The shape and normalization of the remaining MJB are determined from the data.
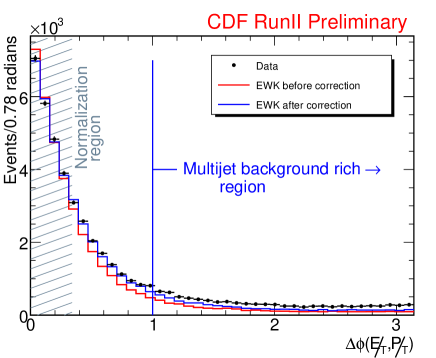
To determine the MJB contribution, a region dominated by MJB is isolated in the data. A missing transverse momentum vector , analogous to the calorimeter-based , is constructed from the vector sum of the transverse momenta of all particles measured in the tracking system. For arising from neutrinos, the and will usually be closely aligned and the azimuthal angle between them will be small. The is largely uncorrelated to the in events where jet energies have not been measured accurately; thus the MJB is expected to be the dominant contribution at large values of . The distribution of for events satisfying the selection criteria is shown in Figure 2. The EWK Monte Carlo is normalized to the data in the peak region of , where the MJB contribution is negligible. Additional corrections to the Monte Carlo are made based on comparisons of Monte Carlo to events in data. Because muons are minimum ionizing particles which deposit little energy in the calorimeter, from calorimeter activity events appear to have real . This makes an excellent “standard candle” for processes with .
The region of is dominated by MJB. Subtracting the corrected EWK Monte Carlo from the data in the region gives an estimate of the remaining MJB in the signal sample. We now determine the shape of the MJB in any variable of interest using events in the region, with the EWK contribution subtracted. The shapes of the derived MJB distributions are also verified with a high-statistics dijet pythia Monte Carlo sample. The systematic uncertainties associated with this data-driven method of determining the MJB contribution come primarily from potential differences between the MJB contribution in the and regions. To estimate the size of these uncertainties, we compare distributions in these regions in the dijet Monte Carlo sample. The normalization must also be scaled up to account for MJB contamination in the region , and an uncertainty of 20% is applied to the total MJB yield.
V Analysis Technique
The analysis proceeds via a fit of the signal and background contributions to the dijet mass distribution. The signal extraction is performed with an unbinned maximum likelihood fit using the RooFit program roofit . Three template distributions are used in the fit. The first is the signal shape. This template is obtained from a Gaussian plus polynomial fit to the signal Monte Carlo distribution, which is a combination of the , , and distributions weighted by the predicted SM cross sections. The mean and width of the Gaussian are linearly dependent on the jet energy scale (JES), which is constrained to be in the range allowed by external measurements JES . The second template is the EWK shape, a combination of the distributions for all backgrounds taken from Monte Carlo as described in Sec. IV.1. The third is the MJB template, which is determined by forming the distribution in events with as described in Sec. IV.2. The MJB distribution is modeled by an exponential which is used as the template in the fit. Based on studies with the dijet pythia Monte Carlo sample, a 20% uncertainty is taken on the slope of the exponential to account for uncertainties on the shape of the MJB contribution.
In the fit to data, the JES, the MJB normalization, and the slope of the MJB exponential enter as Gaussian constraints, allowed to float within the predetermined uncertainties. The yield of signal and EWK background events are floating in the fit with no constraints.
VI Systematics
We address separately two classes of systematic sources, those that affect the signal extraction and those that affect the signal acceptance in the cross section calculation. The signal extraction systematic uncertainties come from uncertainties on the shapes of the signal and background templates. These shape uncertainties include effects of the jet energy resolution (JER), the jet energy scale (JES), and the uncertainties on the shapes of the MJB and EWK background. The JES and the shape and normalization of the MJB are treated as nuisance parameters in the fit, with a Gaussian constraint to their expected values. Thus these uncertainties are already accounted for in the statistical uncertainty on the extraction. The signal resolution uncertainty is determined by smearing each jet in the Monte Carlo by the expected uncertainty on the JER.
| Systematic Source | % Uncertainty | |
| Extraction | EWK background shape | 7.7 |
| Resolution | 5.6 | |
| Total extraction | 9.5 | |
| Acceptance | JES | 8.0 |
| JER | 0.7 | |
| resolution model | 1.0 | |
| Trigger inefficiency | 2.2 | |
| ISR/FSR | 2.5 | |
| 2.0 | ||
| Total acceptance | 9.0 | |
| Luminosity | 5.9 | |
| Total cross section | 14.4 |
The EWK background template is taken from Monte Carlo modeling of all non-MJB backgrounds. The primary EWK backgrounds include a gauge boson accompanied by jets. To determine a shape uncertainty on the EWK background, an alternative background model is developed using +jets data. There are similarities between +jets and +jets production, but the kinematics are not identical due primarily to the large mass difference between the bosons and the photon. Also, selection requirements applied to the +jets events are not identical to those used in the +jets sample. The decays involving neutrinos leave a signature of in the detector, while the photon’s is measured in the calorimeter. For this reason, in +jets events we require the vector sum of the photon and any in the event to be greater than 60 GeV, treating this sum as analogous to the in +jets events. To correct for the differences in kinematics and selection, the +jets events are weighted by the ratio of the distributions in the EWK background Monte Carlo samples to a +jets pythia sample. This method accounts for any production differences, while allowing common sources of uncertainty, such as detector effects, parton distribution functions, and initial and final state radiation, to cancel out. Another consideration in the +jets data sample is the contribution of events, which will cause a peak in the distribution. We use a pythia Monte Carlo sample to subtract this contribution. After these corrections, the difference between the +jets and default EWK background shapes is very small. We then use the adjusted +jets distribution to perform a signal extraction fit. The systematic uncertainty due to the shape of the EWK background is estimated as the difference in the final parameter values between the results obtained from this fit and the fit with the default EWK background shape. This method accounts for a combined effect of JES, JER, and modeling of jets in the Monte Carlo.
The dominant source of systematic uncertainty on the signal acceptance and the cross section measurement is the uncertainty associated with the jet energy scale. The JES affects several of the variables used in the event selection. The effect of the JES uncertainty is quantified by varying the jet energies in the signal Monte Carlo by the variations of the JES. Other sources of systematic uncertainty affecting the measured cross section are the JER, the resolution model used in calculating the significance, the trigger inefficiency calculated from events, the initial and final state radiation (ISR/FSR), and the parton distribution functions (PDF). An additional uncertainty originating from the luminosity measurement is also taken into account Acosta:2002hx . A summary of the sources of systematic uncertainty is given in Table 1.
VII Results
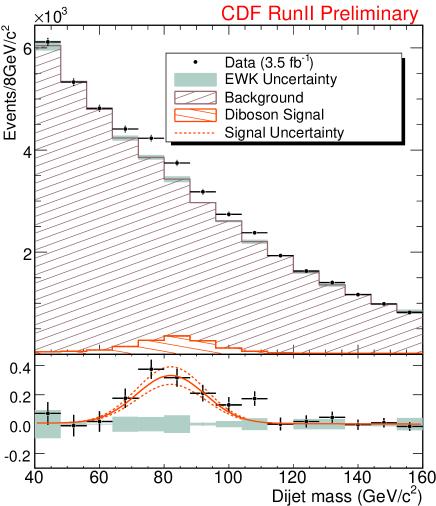
The measured yields for signal and background from the fit to data are given in Table 2, with the extracted number of signal events measured to be . The acceptances for the , , and processes are estimated as 2.5%, 2.6%, and 2.9% respectively from the Monte Carlo simulations. In the calculation of the combined cross section, we assume each signal contributes proportionally to its predicted SM cross section, which is 11.7 pb for , 3.6 pb for , and 1.5 pb for . Since the sample utilizes a large number of trigger paths, the luminosity of the sample is best calculated by counting the number of events in the -triggered sample and comparing to the well understood muon-triggered data. This gives a total effective luminosity of 3.5 fb-1. With this information, the measured signal events correspond to a cross section of pb, in agreement with a SM prediction of pb obtained from the mcfm program mcfm using the CTEQ6.1M PDFs cteq .
Figure 3 shows the fit result and a comparison between the extracted signal and the data after background subtraction. With the data binned as in Figure 3 we obtain a of 9.4 for 9 degrees of freedom, corresponding to a p-value of 40%. To assess the significance of the observed signal, we consider parameter variations for the sources of systematic uncertainty. Then the maximum likelihood value of a background-only fit is compared to the likelihood value returned by the full fit, and the difference is converted into significance numbers. This method finds that the observed signal corresponds to a significance of at least 5.3 standard deviations from the background-only hypothesis.
In summary, we use a plus dijet final state to measure the combined cross section in collisions at TeV to be pb. This is consistent with the SM prediction, and is the first observation in hadronic collisions of the electroweak production of vector boson pairs where one boson decays to a hadronic final state.
| Parameter | Fitted Value |
|---|---|
| Jet energy scale | |
| Yield of EWK background events | |
| Yield of MJB events | |
| Yield of diboson candidates |
Acknowledgements.
We thank the Fermilab staff and the technical staffs of the participating institutions for their vital contributions. This work was supported by the U.S. Department of Energy and National Science Foundation; the Italian Istituto Nazionale di Fisica Nucleare; the Ministry of Education, Culture, Sports, Science and Technology of Japan; the Natural Sciences and Engineering Research Council of Canada; the National Science Council of the Republic of China; the Swiss National Science Foundation; the A.P. Sloan Foundation; the Bundesministerium für Bildung und Forschung, Germany; the World Class University Program, the National Research Foundation of Korea; the Science and Technology Facilities Council and the Royal Society, UK; the Institut National de Physique Nucleaire et Physique des Particules/CNRS; the Russian Foundation for Basic Research; the Ministerio de Ciencia e Innovación, and Programa Consolider-Ingenio 2010, Spain; the Slovak R&D Agency; and the Academy of Finland.References
- (1) D. E. Acosta et al. (CDF Collaboration), Phys. Rev. Lett. 94, 211801 (2005); A. Abulencia et al. (CDF Collaboration), Phys. Rev. Lett. 98, 161801 (2007); T. Aaltonen et al. (CDF Collaboration), Phys. Rev. Lett. 100, 201801 (2008).
- (2) V. M. Abazov et al. (D0 Collaboration), Phys. Rev. Lett. 94, 151801 (2005) [Erratum-ibid. 100, 139901 (2008)]; V. M. Abazov et al. (D0 Collaboration), Phys. Rev. D 76, 111104 (2007).
- (3) V. M. Abazov et al. (D0 Collaboration), Phys. Rev. Lett. 102, 161801 (2009).
- (4) T. Aaltonen et al. (CDF Collaboration), Phys. Rev. Lett. 103, 091803 (2009).
- (5) K. Hagiwara, R. D. Peccei, D. Zeppenfeld, and K. Hikasa, Nucl. Phys. B 282, 253 (1987).
- (6) A. Abulencia et al. (CDF Collaboration), J. Phys. G 34, 2457 (2007).
- (7) D. Acosta et al., Nucl. Instrum. Methods Phys. Res., Sect. A 494, 57 (2002).
- (8) F. Abe et al. (CDF Collaboration), Phys. Rev. D 45, 1448 (1992).
- (9) A. Bhatti et al., Nucl. Instrum. Methods Phys. Res., Sect. A 566, 375 (2006).
- (10) A. Bhatti et al., IEEE Trans. Nucl. Sci. 56, 1685 (2009).
- (11) M. Goncharov et al., Nucl. Instrum. Methods Phys. Res., Sect. A 565, 543 (2006).
- (12) T. Sjostrand, S. Mrenna, and P. Skands, J. High Energy Phys. 0605, 026 (2006).
- (13) R. Brun, R. Hagelberg, M. Hansroul, and J. C. Lassalle, version 3.15, CERN-DD-78-2-REV.
- (14) M. L. Mangano, M. Moretti, F. Piccinini, R. Pittau, and A. D. Polosa, J. High Energy Phys. 0307, 001 (2003).
- (15) W. Verkerke and D. Kirkby, In the Proceedings of 2003 Conference for Computing in High-Energy and Nuclear Physics (CHEP 03), La Jolla, California, 24-28 Mar 2003, pp MOLT007, arXiv:physics/0306116.
- (16) J. M. Campbell and R. K. Ellis, Phys. Rev. D 60, 113006 (1999).
- (17) J. Pumplin, D. R. Stump, J. Huston, H. L. Lai, P. M. Nadolsky, and W. K. Tung, J. High Energy Phys. 0207, 012 (2002).