Analysis of the fraction of clear sky at La Palma and Mt.Graham sites
Abstract
The amount of available telescope time is one of the most important requirements when selecting astronomical sites, as it affects the performance of ground-based telescopes. We present a quantitative survey of clouds coverage at La Palma and Mt.Graham using both ground- and satellite-based data. The aim of this work is to derive clear nights for the satellite infrared channels and to verify the results using ground-based observations. At La Palma we found a mean percentage of clear nights of per cent from ground-based data and per cent from satellite-based data. Taking into account the fraction of common nights we found a concordance of per cent of clear nights for ground- and satellite-based data. At Mt.Graham, we found a per cent agreement between Columbine heliograph and night-time observing log. From Columbine heliograph and the Total Ozone Mapping Spectrometer-Ozone Monitoring Instrument (TOMS-OMI) satellite, we found that about per cent of nights were clear, while satellite data (GOES, TOMS) are much more dispersed than those of La Palma. Setting a statistical threshold, we retried a comparable seasonal trend between heliograph and satellite.
keywords:
Atmospheric effects – Site testing – Statistical.1 Introduction
The identification and characterization of a site for the future European Large Telescope (E-ELT) is a key issue. Moreover a quantitative survey of cloud cover for the areas selected as candidate sites for the telescope is and will continue to be an essential part of the process of site selection for future large telescopes in the same class as the E-ELT.
In fact, the performance of large telescopes at optical and infra-red wavelengths is critically dependent on atmospheric cloud cover. Cloud cover is a key parameter at the time of site selection and also affects scientific output during the life of the telescope. For instance, a night-time seasonal trend of fewer clear sky can reduce regular access to the sky.
Typically it is possible to quantify the presence of clouds at telescope sites using ground-based observations that provide a real time knowledge of the atmospheric condition. The fraction of clear sky can be determined using either instruments (i.e all-sky cameras) or observer estimates. Long-term records from many ground-based telescopes, which list the number of nights available for observing, are now accessible and it is possible to begin a reliable statistical study. However, this technique alone is not suitable for identifying future candidate sites where there are no telescopes.
An easy evolution of this analysis is the use of meteorological satellites that provide measurements of cloud cover and other critical parameters for site testing covering large areas with different spatial and temporal resolution. Taking into account that, most of the meteorological satellites are equipped with similar instrumentation, it is not difficult to compare distinct sites observed by two or more different satellites. Additionally, since satellite data archives now cover long time periods, it is possible to have for each site the trend of these parameters in both long and short time scale. Erasmus and Sarazin (2002 ) were among the first to demonstrate the successful application of satellite data for monitoring, comparison and forecasting evaluations. Erasmus and van Rooyen (2006 ) quantified cloud cover at La Palma using Meteosat satellite and validating them using the ground based measurements taken at Carlsberg Meridian Telescope (CMT).
In this paper we present the results of a study of cloud cover using satellite- and ground-based data obtained in two different important astronomical sites: the Observatorio del Roque de Los Muchachos (ORM) located in La Palma (in Canary Islands), hosting several international telescopes and among of them the Galileo National Telescope (TNG), and Mount Graham (in Arizona), hosting the Large Binocular Telescope (LBT). The results are compared with Erasmus and van Rooyen (2002 ) and Erasmus and Sarazin (2006 ). The present paper is organized as follows. In Section 2, we describe both the ground and satellite data bases adopted. In Section 3, we describe the satellite data acquisition procedure, and in Section 4 we show the data reduction procedure. Section 5 gives a discussion of the results.
2 DATA
The primary aim of this work is to derive the number of clear nights. To quantify the amount of clear sky over ORM and Mt.Graham sites we used different set of data collected at both ground and satellite facilities available partially via World Wide Web and partially thanks to the courtesy of the observatory staff. The validation of satellite data are also performed via correlations between ground-based and satellite-based data. In particular we used meteorological satellites that have geostationary orbits because these ensure large coverage of the globe and a suitable resolution. Fig. 1 shows the time coverage of the data bases used.

2.1 Ground-based data
| Year | Annual mean down time |
|---|---|
| (per cent) | |
| 2000 | 26.7 |
| 2000 | 26.6 |
| 2000 | 26.1 |
| 2000 | 28.2 |
| 2000 | 37.3 |
| 2000 | 39.4 |
| 2000 | 30.2 |
| 2000 | 26.4 |
| 2000 | 29.6 |
The first detailed analysis of more than 10 yr of meteorological data obtained using the TNG meteorological station at ORM, can be found in the following two papers: Lombardi et al. (2006 ) (hereafter Paper I) and Lombardi et al. (2007 ) (hereafter Paper II). Paper I shows a complete analysis of the vertical temperature gradients and their correlation with the astronomical seeing. In contrast, Paper II shows an analysis of the correlation between wind and astronomical parameters as well as the overall long-term weather conditions at ORM. Differences in the microclimate at the ORM have been demonstrated in a detailed comparison between synoptic parameters taken at three different locations at the observatory on a spatial scale of about 1 km. Moreover, the ORM is shown to be almost dominated by high pressure and characterized by an averaged relative humidity lower than per cent. The first detailed reports on night-time cloudiness at La Palma were given by Murdin (1985 ), who reported per cent of nights at La Palma were usable during the period of 1975 February-September (see his Table 2 in Murdin 1985).
Thanks to the kindness of the staff at the TNG and LBT staff, the updated end-of-night report have been available allowing us to extend the time baseline to the range 1975-2008 for the TNG telescope. The LBT logbook, available from National Institute for Astrophysics (INAF) and Max Planck Institute time, is only available since 2008 and this gives a time baseline only for two years.
Fig. 2 shows the distribution of the mean monthly values for nights lost as a result of bad weather (i.e. cloudy nights or with strong wind or nights affected by the calima) for 2007 (long dashed line) and 2008 (short dashed line), derived from the first analysis of the TNG logbook. The continuum line of Fig. 2 shows the monthly mean value computed from 2000 to 2008. It is evident that June is the month that has the minimum number of bad nights. The maximum number of nights lost as a result of the weather does not reach per cent of the total allocate nights. Table 1 reports the annual mean values of the downtime computed from 2000 to 2008. We can see that the mean value is almost stable in these last nine years, giving a value of per cent of lost nights.

We have also analyzed for the two years 2007 and 2008 all the astronomical useful nights at TNG using two different criteria. In the first criterion we extracted the information from the lost time weather string reported in the end-of-night report. If the night was fully used, no lost time should be found in this string. Using this information, we separated the nights used into fully useful nights (i.e. the dome is open the whole night) and partially useful nights (i.e. less than 5 h are lost because of the weather). The results are given in Table 2. As discussed in the following, the adopted criterion is more stringent than that of Arderberg (1983 ).
| 2007 | 2008 | |||
|---|---|---|---|---|
| 100 per cent used | Used 5 h. | 100 per cent used | Used5h | |
| January | 25.8 | 29.0 | 35.5 | 29.0 |
| February | 46.4 | 24.1 | 20.7 | 24.1 |
| March | 38.7 | 12.9 | 32.2 | 22.6 |
| April | 46.6 | 26.7 | 40.0 | 23.3 |
| May | 70.9 | 9.7 | 54.8 | 29.0 |
| June | 73.3 | 10.0 | 86.7 | 13.3 |
| July | 90.3 | 6.4 | 87.1 | 9.7 |
| August | 90.3 | 3.2 | 67.7 | 22.6 |
| September | 73.3 | 16.7 | 33.3 | 20.0 |
| October | 38.7 | 32.2 | 35.5 | 22.7 |
| November | 20.0 | 16.7 | 48.3 | 20.7 |
| December | 51.6 | 16.1 | 32.2 | 19.3 |
| mean | 55.5 | 17.0 | 47.8 | 21.3 |
From Table 2 it can be seen that the TNG telescope is opened for the whole night and without interruptions for more than per cent of all the nights considered. If we compute the mean percentage of the two years, considering both totally and partially useful nights, we find that the telescope operated the per cent of the total nights. We can conclude that this value is in agreement with the values expected for good astronomical sites. Erasmus and van Rooyen (2006 ) gave a percentage of 74.7 per cent for usable nights at Cerro Tololo Inter-Americn Observatoy for the period 1997 June to 1999 April, derived from ground-based observations. Moreover, at the ORM, Arderberg (1983 ) measured per cent of nights to be photometric in 1982 and per cent in 1983. In his analysis, Arderberg defined as photometric every night having at least six hours of uninterrupted clear sky. The mean value of per cent of photometric nights, computed in 1982 and 1983 by Arderberg (1983 ) is in agreement with our mean value of per cent, obtained using the more restricted criterion of per cent fully used nights. This means that in case of six consecutive hours of clear sky, a full night is very likely to be photometric according to Arderberg’s definition.
In the second criterion, we classified the nights using the sky condition comments. We classified the nights as clear (i.e. cloud-free) and mixed (i.e. partially used because of the presence of clouds during the night). We also took into account the calima. In this type of selection, if the night presents strong wind or humidity, it appears mixed in our classification, while it may appear not usable using the previous criterion because the dome may be closed for safety. Table 3 shows the mean monthly percentage obtained. A comparison between Table 2 and Table 3 shows that the percentage of fully used nights is similar to the percentage of per cent clear nights. This means that when a night is fully used it is very likely to be completely clear. However, table 3 gives a higher number of total usable nights. This is probably because, as we have just said, the mixed sky conditions may include also strong wind or humidity conditions. We notice that a per cent of nights in 2008 were lost as a result of high humidity or strong wind.
The same classification has been done for LBT telescope. Table 4 shows the distribution obtained for the quality of nights. The LBT logbook is limited to a sample of only 50 nights (July and August do not have data because the telescope is closed due to the monsoon), but for the completeness of the discussion we decided to collect them in Table 4. A comparison between Table 3 and Table 4 shows a comparable percentage of clear days, while at Mt.Graham the percentage of mixed nights is higher. Unlikely to La Palma site, no calima events has been found at Mt.Graham.
The criterion to discriminate between photometric and spectroscopic is not unique. It is difficult, for example, to judge at the beginning of the night before starting the observations whether the sky is completely clear, in sense of clouds free, or whether the airborne dust will significantly affect the observing conditions. For this specific point, we used the CMT extinction files to set the clear sky quality at La Palma site.
Regarding Mt.Graham, an interesting criterion was used, based instead on the morning sky conditions (Steward Observatory, 1987 ), but is not used in this analysis. Thanks to the weather station of the United States Forest Service (USFS) located 2.1 km far from the LBT (Columbine peak), we correlated the log of night observations with data from the heliograph an instrument that records the Sun’s radiation in the wavelengths from UV to IR. This data base covers all the period since 2001 September.
We also used the rainfall data base of the weather station of Safford Agriculture Center111See http://www.wrcc.dri.edu/cgi-bin/cliMAIN.pl?azsaff because of its longtime baseline, since 1940. The cross check gives complementary results to those of Columbine peak.
| Name | year 2007 | year 2008 | ||||
| Month | Clear | Mixed | Calima | Clear | Mixed | Calima |
| (%) | (%) | (%) | (%) | (%) | (%) | |
| January | 25.8 | 25.8 | 3.2 | 19.3 | 35.5 | 6.4 |
| February | 53.6 | 17.9 | 3.6 | 17.2 | 41.4 | 10.3 |
| March | 26.7 | 20.0 | 10.0 | 35.5 | 29.0 | 16.1 |
| April | 56.7 | 13.3 | 3.3 | 46.7 | 30.0 | 6.7 |
| May | 58.1 | 6.4 | 9.7 | 48.4 | 29.0 | 0 |
| June | 83.3 | 13.3 | 0 | 83.3 | 6.7 | 10.0 |
| July | 61.3 | 0 | 35.5 | 67.7 | 0 | 25.8 |
| August | 93.5 | 3.2 | 3.2 | 45.2 | 9.7 | 35.5 |
| September | 76.7 | 6.7 | 0 | 33.3 | 33.3 | 0 |
| October | 51.6 | 35.5 | 0 | 38.7 | 54.8 | 0 |
| November | 16.7 | 43.3 | 0 | 48.3 | 17.2 | 0 |
| December | 58.1 | 25.8 | 0 | 33.3 | 32.3 | 0 |
| mean | 55.2 | 17.6 | 5.7 | 43.1 | 26.6 | 9.2 |
| 2008 | |||
|---|---|---|---|
| Clear | Cloudy | Mixed | |
| (per cent) | (per cent) | (per cent) | |
| Mean | 60.0 | 10.0 | 30.0 |
2.2 Satellite-based data
| Name | Long. | Lat. | range | Spatial | Temporal | used years |
|---|---|---|---|---|---|---|
| Res. [km] | Res. [h] | |||||
| GOES 12 | -75∘ | 0∘ | 6.5 - 7.0 (B3) | 8 | 3 | 2007-2008 |
| 10.2 - 11.2 (B4) | 4 | 3 | 2007-2008 | |||
| GOES 8 | -122∘ | -5∘ | 6.5 - 7.0 (B3) | 8 | 3 | 2007-2008 |
| 10.2 - 11.2 (B4) | 4 | 3 | 2007-2008 | |||
| Nimbus7 | polar | 0.32 - 0.40 | 111 | 24 | 1978-1993 | |
| Earth-Probe | polar | 0.32 - 0.40 | 111 | 24 | 1996-2005 | |
| OMI | polar | 0.35 - 0.50 | 3 | 24 | 2004 - present |
Data were derived using Geostationary Operational Environmental Satellite (GOES) 12 for ORM and GOES 8 and GOES 12 for Mt.Graham, which are meteorological satellites monitoring cloud cover and water vapour. Both satellites are the new generation of GOES family, an American geosynchronous weather facilities of the National Oceanic and Atmospheric Administration (NOAA). GOES 12 is able to observe the full Earth disk in both visible and IR regions of the electromagnetic spectrum and can observe and measure cloud cover, in addition to other important meteorological parameters. Two GOES satellites are typically used to provide coverage of the entire hemisphere. When the two satellites are in operation, one satellite covers the GOES east position, located over the Equator at 75∘E, and the other one is located at GOES west position over the Equator at 135∘W. These two satellites provide imagery of North and South American continents as well as Pacific and Atlantic Oceans with an overlapping area of coverage. GOES 8 was launched in 1994 April and operated from 1994 November to 2003April. GOES 12 was launched on 2001 July and replaced GOES 8 in 2003 April. The two spacecrafts carry an imager, a ’sounder’ and a X-ray imager. The imager is a Cassegrain telescope covering five wavelength channels, one in the visible bands (), and four in the infrared (, , , and ) bands. It can provide images covering km2 every 41 seconds, by scanning the area in 16 square kilometer sections. Full Earth-disk scans are scheduled every 3 h. It should be noticed that GOES 12 covers La Palma area near the edge of the field of view. Taking into account the curvature of the Earth we obtain a projection of about 57∘ in latitude and 28∘ in Longitude, corresponding to a factor 1.1 in Latitude and 1.8 in Longitude.
Thanks to this set up, it is possible to have the same instrumental configuration for the ORM and Mt.Graham and to compare them in a suitable way.
We have also included data from polar satellite of the Total Ozone Mapping Spectrometer (TOMS) family to extend the statistics of clear days at Mt.Graham. These satellites were planned to study atmospheric ozone, but their data can be used for cloud cover. Four TOMS satellites were launched from 1978 to the present. Because of the failure of the second satellite, Meteor-3, we have only used data from the remaining three: Nimbus-7(1978-1993), Earth-Probe (1996-2005), and ozone Monitoring Instrument (OMI); (from 2004). We used the overpass data222See ftp://toms.gsfc.nasa.gov/pub/omi/data/overpass/ covering a square of 110 km2 centered on Tucson city (Arizona). Table 5 summarize the main parameters of the satellites used.
3 Satellite data acquisition
For this work, we used GOES 12 equipped with the imager. Among the five available channels, we selected the water vapour channel (channel 3, hereafter called b3 band) centered at , and the cloud coverage channel (channel 4, hereafter called b4 band) centered at . The b3 band is sensitive between and is able to detect high-altitude cirrus clouds. The b4 band is sensitive between and is able to detect middle-level clouds. The output of the detector is proportional to the energy reaching the detector areas per unit time (radiance). It is also possible, given the intensity and the wavelength of the radiance, to derive the equivalent brightness temperature using an appropriate Planck function. This was the procedure adopted by Erasmus and van Rooyen (2006 ).
We selected the IR channel because water vapour absorbs electromagnetic radiation and then re-emits it in various wavelength bands, in particular in the infrared region at . If clouds are not present, the emissions at reaching the satellite are largely not absorbed by the atmosphere, so that radiance values measured are a result of emission from the surface. However, when clouds are present they behave as absorbing and emitting ”surfaces” so that, under these conditions, radiation reaching the satellite is from the cloud top, which has a lower emissivity as a result of a lower temperature.
The GOES data have the highest spatial resolution ( for channel b4 and for channel b3) compared with the old generation satellites. Data are prepared by the Comprehensive Large Array-data Stewardship System (CLASS), an electronic library of NOAA environmental data333See www.class.ngdc.noaa.gov, and are stored as rectified full earth disk images in a format called AREA files. We processed them using McIDAS-V Version 1.0beta1, a free visualization and data analysis software package. The first step to collect data was to extract the right sector centered close to the TNG and LBT.
Regarding the TNG, we know that it has latitude N and longitude W. We identified and extracted from the sector a subimage of having the central pixel centered on (or near) the TNG coordinates. We obtained sub-images having the central pixel of N latitude and W longitude. Both the TNG and subimage coordinates reside in the same pixel that is also the instrumental resolution. For each night we took into account available observations at four different hours to cover the entire observed night, at 20:45, 23:45, 02:45 and 05:45 UTC. The mean of these four values has been used in our analysis.
Regarding Mt.Graham, data from 1995 January to 2008 December have been analysed: until 2003 April, the data come from GOES 8, and then GOES 12 has been used. For each night we selected data at two different hours: at 17.45 and 02.45 UTC (10:45 and 19:45 of local time, respectively). When no data was available at those time, we used images taken at different times, up to 1.5 h after or before. Our aim was to select two hourly sets of data, one during daytime and one during night-time. However, it was not possible to built homogeneous series at 05:45 or 08:45 UTC (22:45 and 01:45 of local time, respectively) because during spring and autumn the GOES change acquisition timetable and do not often cover these times.
The analogous data base has been extracted for LBT, located at N latitude, and W longitude. We selected subimages with the pixel centered at this position. After a detailed analysis of the GOES daily signal coincident with the log data, we found the best correlation with the signal at 10:45 and 19:45 local time (see also Fig.7).
4 Data analysis


Fig. 3 shows the distribution of the mean infrared emission at the ORM for the b3 and b4 bands in the upper and lower panels, respectively, for 2008. It is evident that b3 band ( water vapour) shows higher values of emissivity in the summer time period, corresponding to a higher temperature and a low percentage of clouds ( d), than those in the autumn. The lower panel of Fig. 3 for the band shows a flatter distribution of emissivity.


Fig. 4 shows the daily distribution of the emissivity for the b3 and b4 bands at Mt.Graham. The seasonal effects of this site are evident in both the bands, distinguishing the monsoon period. This seasonal trend in b4 band is much more evident than at ORM. This trend requires the normalization of the flux in order to allow a selection of the night quality from a predetermined fixed threshold (see later for discussion). The monsoon period is seen in July and August. A spline interpolation was adopted because of the discontinuity of the monsoon period.
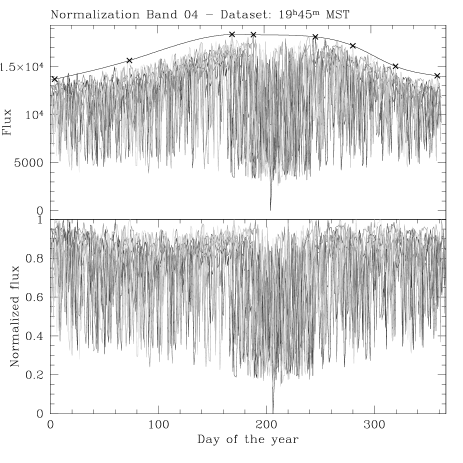
Fig. 5 shows the distribution of the emissivity in b4 band ( top) and the distribution of normalized emissivity ( bottom) centered at Mt.Graham. The normalization function is used to extract the other values of emissivity under the assumption that the behavior is the same all year.
A comparison of the two Fig. 3 and Fig. 4 shows that the satellite reaches higher values of emissivity in both bands at Mt.Graham compared to La Palma. A deeper analysis has to be carried out to check the existence of correlations with other parameters to understood this different value of emissivity between the two sites. In this paper, we have checked possible seasonal effects, and Fig. 6 shows the distribution of the emissivity at ORM for the b3 (filled squares) and b4 (open triangles) bands in two different periods of the year. The upper panel of Fig. 6 shows the distribution of three consecutive days (clear, mixed and cloudy) in winter time. The clear day reaches a value of about 14000 units in b4 band and a mean value of about 9700 units in the cloudy day. The presence of cold cirrus produces the oscillation of the counts in cloudy day. A similar behavior can be seen in b3 band with a lower value of counts. The bottom panel of Fig. 6 shows the distribution of two consecutive days in summer time (only clear and cloudy because we found no mixed and consecutive day). We see that the clear day reaches a value of about 16000 units in b4 band a greater value with respect the winter value, probably because of the different mean air temperature. A more evident effect of the arriving perturbation can be seen in b3 band with a drop of the counts.


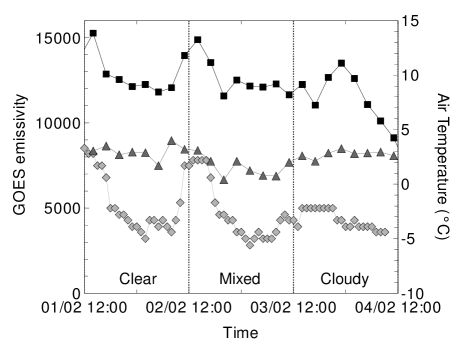
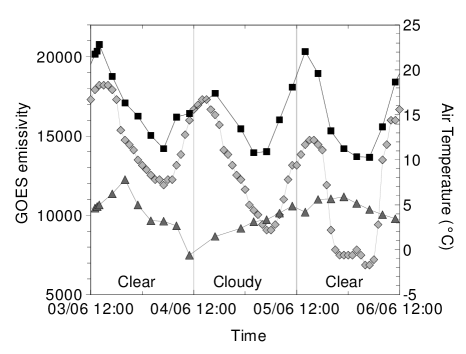
To meke an easy comparison of the seasonal behavior of the two sites, we include here the analogous distribution for Mt.Graham. Fig. 7 shows the distribution of b3 (triangles) and b4 (squares) bands of GOES 12 satellite during some winter (upper panel) and summer (lower panel) days in 2008, compared with the temperature of the air measured by the Columbine weather station (diamonds, right axis). We confirm that the signal from La Palma is systematically lower than Mt.Graham, in spite of the lower altitude. A tentative explanation could be a higher extinction of the satellite signal because of the longer of optical path.
Fig. 7 clearly shows the difficulty in finding the right threshold of GOES fluxes. When the day (and night) is clear, air temperature and b4 band values follow a day/night cycle. When a perturbation arrives, the daily peak usually disappears. However, the winter graphic shows a peak of b4 band flux during the night, even if the air temperature remains stable. The satellite probably measured the temperature of the clouds,which in that case had a greater temperature than the ground. Using the threshold method to distinguish clear days from cloudy days, this day would be identified as clear. In our sample, there is only marginal evidence (if any) of lower minimum temperatures during covered nights compared to clear nights. The most evident difference, instead, is a lower emissivity in the late afternoon just before a cloudy night. The local, ground temperature, may have an important role on GOES measurements. Furthermore the higher signal during the summer does not seem to lead to better discrimination between clear and cloudy nights. Noise in the data and resolution effects have been tested also comparing the single pixel data to nine-pixels averages during nights recorded from the ground; however, the plots are almost identical. More tests are needed to check the reliability of nights time GOES at Mt.Graham.
4.1 La Palma: the threshold method
Considering the sky quality comments as derived from the end-of-night report at TNG, we correlate the values of b3 and b4 bands of GOES with the corresponding night quality. Fig. 8 shows the distribution of the emissivity obtained from b3 (x-axis) and b4 (y-axis) bands as a function of the different type of nights for 2007 (filled triangles) and 2008 (open squares). Each type of night is plotted separately to better identify the distribution along the panels. Fig. 8 shows good correlation between TNG classification and emissivity. In fact, it is evident that at higher b3 and b4 band values it generally corresponds to a clear night, and at lower b3 and b4 band values it corresponds to a cloudy night. In contrast, mixed nights have a distribution among all the possible values, probably due to the season.

In order to have a more objective analysis of clear conditions, we used and cross-correlated the same satellite data with the corresponding atmospheric extinction as published in the website of the CAMC telescope444See http://www.ast.cam.ac.uk/dwe/SRF/camc_extinction.html. In this analysis, we presume that sky conditions ( with the two telescope having a close locations) were the same and extinction parameter is able to identify not only useful nights but also the photometric nights. The nightly values of extinction were derived from CCD frames in the Sloan Digital Sky Survey (SDSS) r’ band.
Each frame contains an average of photometric standard stars. In our analysis, we assumed that if no value of extinction existed or if it was equal to zero, it was probable that no observation took place because of the bad sky conditions. Nights with technical problems have not been included (233 nights).
Fig. 9 shows the distribution of the extinction as a function of GOES b3 (upper panel) and b4 (lower panel) band emissivity. The points represent all the nights with an extinction value not equal to zero and are classified by extracting information from TNG logbook for 2007 and 2008. They show a large spread of the extinction values in both infrared bands, some of which have been classified as cloudy at TNG. Clear nights are located in a well-defined locus of the b4 band. It is interesting to note that per cent of all the nights reporting calima on the TNG report in 2007 and 2008, have extinction values greater then 0.13. Moreover, those nights having reported no calima but some clouds have extinction values greater or equal to 0.13 but lower b3 and b4 values than the nights with calima. Most of our selected clear nights (88 per cent) present an astronomical extinction less than 0.13 mag. The extinction value of 0.2 mag airmass-1 on clear nights was found to be discriminant for calima events in a previous paper of Lombardi et al. (2008 ).


Fig. 10 shows the distribution of the GOES 12 emissivity as a function of TNG night report only for those nights not plotted in Fig. 9 because no extinction value was reported (about 123 nights with ”zero extinction” classification). We can see that the majority of the plotted points are located in the panels marked mixed and cloudy. In fact, considering the TNG logbook for 2007 and 2008, we found that the per cent of these nights with no extinction at CMT are classified as cloudy or mixed ones, while only the per cent are classified as clear nights or with the calima.

To conclude we decided to use Fig. 9 to define the threshold values for both b3 and b4 band to distinguish satellite clear nights from cloudy ones. In particular we decided to obtain the satellite sample of clear nights, setting the GOES threshold to 6500 for b3 band and 13200 for b4 band. The ground sample is obtained using all the nights with CMT extinction values. The result is shown in Fig. 11 where dashed lines indicate the threshold that we choose to separate clear nights. All GOES nights presents in b3 band values greater than 6500 and in b4 band values greater than 13200 are clear, all the nights with b3 band values less than 6500 and b4 band values less than 13200 are cloudy, and the other cases are mixed. This choice has been adopted by optimizing the discrimination of the different nights and minimizing the contamination. It should be noticed that this empirical criterium is different from the method used by Erasmus based, instead, on the derived temperatures. With this adopted limits, we obtained the following statistics: GOES identified per cent of clear nights for 2008 and per cent for 2007, while from ground observation we know that the per cent of all nights were clear for 2008 and the per cent for 2007. Thus, it seems that, using our GOES processing method, clear nights are overestimated of about per cent.


4.2 Mt.Graham: a new approach
Fig. 12 shows the results of the same adopted procedure that correlate nights quality based on LBT report and GOES emissivity. The separation between clear, mixed and covered nights on the base of b3 and b4 GOES bands is not as evident as la Palma data. This could in part be the result of an intrinsic GOES data interpretation at Mt.Graham, and in part a result of poor statistics. In order to improve the latter, after a number of tests, we decided to follow a new different approach using the heliograph data from Columbine peak. The archive is maintained by the Western Regional Climate Center555 see the web page http://www.wrcc.dri.edu/cgi-bin/rawMAIN.pl?azACOL and data are freely downloaded. For the purpose of this paper, we downloaded the daily table from 2001 March (from when the heliograph data are available). This database is not complete: for some days no data were recorded or were only partially recorded; for the first case the event is highlighted, but not the second. So we verified the reliability of the data checking day per day the data base and classifying days for completeness: perfects if data covered the entire day, good if only one hour data lacked, bad if more than one hour was not recorded. We found that perfect days make up per cent of the total, good per cent, and bad days per cent. We only used perfect and good days in this analysis, covering per cent of the considered period. Fig. 13 shows the distribution of Sun emissivity, as integrated daily fluxes, for 2008, where the bad days appear as flux drops.

The monsoon period (day 180 to about 240) is evident. Because of the strong seasonal effect, the heliograph data have been normalized like the GOES data using a spline fit. Finally the normalized daily fluxes have been compared with the end-of-night reports of LBT. The correlation is presented in Fig. 14 where the correspondence of the heliograph flux with the night-time data is very tight, with a concordance of per cent of clear nights when the threshold of the normalized flux is set at . It is evident that the day/night difference at Mt.Graham is almost negligible if we consider only clear days, but not when considering mixed/cloudy days, where per cent of the samples fall in the other category.


A similar procedure was used to compare the TOMS-OMI reflectivity with the logbook of LBT. In this case the best threshold was found to be 0.08. The results are visible in Fig. 15. It is evident that heliograph and TOMS-OMI data distinguish clear nights better than GOES satellites. The upper-right panels of Figs. 14 and 15 show, respectively, the flux and the reflectivity distribution of the clear nights. Mixed nights (lower-left panels), instead, are less separable. Dashed lines indicate the threshold that we choose to separate clear from mixed and bad nights.
Because the observation logbook is available only for 2008 and its concordance with the heliograph is very good, we decided to use the heliograph data to extend the reference data in the past, to 2002, while TOMS data are available from 2004. Then we compared both GOES b3 and b4 normalized fluxes with the heliograph data. We found two different thresholds, where the percentage of clear nights found by GOES was comparable with that obtained with TOMS-OMI and the heliograph in the overlapped period. The two values are 0.66 and 0.8 of the b3 and b4 normalized flux respectively for the heliograph and for the TOMS.
5 Discussion
5.1 La Palma site
In our analysis at La Palma site we used 731 nights obtaining the sky comments from TNG end-of-night reports. After the cross-correlation of the TNG nights with the CMT extinction, the total number of nights used for the final statistics was 375: these we can define photometric or, at least, spectroscopic on the basis of Table 2. We obtained 700 nights from GOES database, covering the period 2007-2008. Fig. 11 shows the thresholds adopted to select night quality. All those having emissivity greater than 6500 counts in b3 band and a values greater than 13200 counts in b4 band are defined as clear nights. In contrast, we defined as cloudy all the nights with b3 band values less than 6500 and b4 band values less than 13200; all other cases are classified as mixed. For ground observations, we defined clear nights all those ones with no clouds, humidity, strong wind or calima.
| Name | 2007 | 2008 | ||
|---|---|---|---|---|
| month | CMT | GOES | CMT | GOES |
| (per cent) | (per cent) | (per cent) | (per cent) | |
| January | 43.8 | 43.8 | - | - |
| February | 65.2 | 60.9 | - | - |
| March | 30.0 | 60.0 | 66.7 | 100.0 |
| April | - | - | 59.1 | 68.2 |
| May | 33.3 | 66.7 | 53.8 | 73.1 |
| June | 100.0 | 100.0 | 89.5 | 100.0 |
| July | 58.3 | 100.0 | 75.0 | 96.4 |
| August | 91.3 | 100.0 | 50.0 | 92.3 |
| September | 81.5 | 63.0 | 62.5 | 87.5 |
| October | 57.7 | 57.7 | 55.0 | 85.0 |
| November | 75.0 | 50.0 | 66.7 | 33.3 |
| December | - | - | 38.1 | 0.0 |
| mean | 63.6 | 70.2 | 61.6 | 73.6 |
With these adopted limits we found a mean statistical percentage of clear nights of per cent from ground data and per cent for satellite data. It seems that there is a quite good correlation between ground and satellite data, but the satellite overestimates the clear nights by about per cent, as already found by Erasmus and van Rooyen (2006 ).
The next step was to quantify the nights classified as clear using both ground and satellite data. We found that the per cent of the common nights (365, i.e. half of the total sample) are clear for both ground and satellite data for 2007, and per cent for 2008, with a mean percentage of per cent. Table 6 shows the distribution of the monthly percentage of the common clear nights at La Palma in the years 2007 and 2008. Moreover we note that most of the clear nights have an extinction less than 0.13. Months with indicate that no data are available from GOES database or from CMT extinction file. There is a large spread of the agreement during the months and also in the two considered years.
Using the Meteosat in geostationary orbit at , at the ORM Erasmus and van Rooyen (2006 ) found 68.7 per cent of clear nights (i.e. cloud free) from ground based data, on the basis of 629 nights in the period of 1999-2002, compared with our percentage of per cent. In contrast, they found a percentage of per cent from satellite data, compared with our mean of per cent. Moreover, they found 52.5 per cent of photometric nights for both satellite and ground data, a much lower value than our mean value of per cent. We note that Erasmus and van Rooyen (2006 ) report 83.7 and 85.3 per cent of photometric hours for satellite and ground data, including the time when only part of the sky was photometric. A summary of the number of photometric nights can be found at www.otri.iac.es/sitesting/UserFiles/File/photometric-time.pdf .
Instead, the estimated percentage of spectroscopic nights is different. If we assume that the partially used nights are spectroscopic, we found from the logbook a mean value of about per cent. Erasmus and van Rooyen found a mean value of per cent. Instead, from satellite they found that per cent are spectroscopic nights, compared with our result of about per cent. Finally, we found that the per cent are spectroscopic nights for both the satellite and the ground-based data, compared with per cent given by Erasmus and van Rooyen.
Finally, we considered the nights affected by the calima. We found that about per cent of nights affected by the calima are considered clear for GOES, the satellite does not distinguish the calima.
A test has been carried out to verify if the satellite and ground data are more in agreement when considering nights affected by the calima and the clear nights together, rather than considering only clear nights. Under this assumption, we obtained that the clear nights (i.e. cloudless nights) plus nights affected by the calima, are per cent for ground selection for 2008 (compared with per cent for GOES) and per cent for 2007 (compared with per cent for GOES). The mean percentage is per cent, showing a very good agreement between satellite data and ground-based observation. We can conclude that satellite does not distinguish the calima event. Fig. 16 shows this result, where the monthly distribution of the clear night fraction is plotted from TNG and CMT logbooks (dashed line) and GOES 12 (solid line). The agreement of the two plots is excellent except for December.
The final step was to understand how many nights were clear for both ground and satellite data in this database including nights affected by the calima. We found that the per cent of all the clear nights are effectively clear for both GOES and ground for 2007 and the per cent for 2008. We found a mean percentage of per cent, compared with the previous mean of per cent of clear nights not including the calima. It is evident that the percentages are similar and this is probably because of the low number of nights affected by the calima. We emphasize that the satellite selects clear nights without making assumptions about the transparency of the sky.

5.2 Mt Graham site
At Mt Graham the total number of clear days analyzed in the period 2002-2008 are 912 from the heliograph and 964 from GOES. The common number of clear days is 661, with a relative fraction of per cent of common days versus the total number of clear days from the heliograph. Fig. 17 shows the monthly composite distribution of the monthly average fraction of clear night computed from the heliograph database, the Toms-Omi satellite, GOES data taken at 17:45 and 02:45 UTC (10:45 and 19:45 local time, respectively), data from Mt Graham site testing (Steward Observatory 1987 ) and the rain distribution derived from Safford (Agriculture center) database. With the obvious exception of Mt Graham site testing, all the data are from the period of 2007-2008. There is a general qualitative agreement among the different methods (the rainfall is clearly anticorrelated with the clear night fraction) with the heliograph data. A high peak in May is evident, as well the sharp cut-off between May and June, and a secondary peak in autumn. This trend is in very good agreement with the Kitt Peak logbooks of photometric time fraction analyzed by D.L.Crawford (Steward Observatory 1987 ; see also the data of usable time available at http://www.noao.edu/kpno/usrhnbk/user-App.html). The GOES data are higher than the average of the other data in September and October and lower in May. While the fraction of usable time ( per cent) is in agreement with the other methods, the distribution is clearly more noisy. The 1982-1983 site testing data are in a very good agreement with the heliograph data, except during October-December where these data are much lower. On average the site testing data are lowest. We recall that winter time in Arizona presents high variability, connected with the episodic invasions of storms coming from north-west. The resulting yearly usable fraction is between per cent and per cent. It should be noticed that GOES data analysis from Erasmus 2002 at Mt Graham gives a usable fraction much higher that all our indicators ( per cent clear and per cent usable), in particular during the monsoon season. This suggests that GOES data interpretation at Mt Graham presents some unresolved multiparametric problems and the results are very sensitive to the data treatment. The difficulty in the quantitative interpretation of GOES data is extensively discussed in literature (Stove et al. 1988 , Khyier et al. 2004 , and Jung et al. 2004 ).
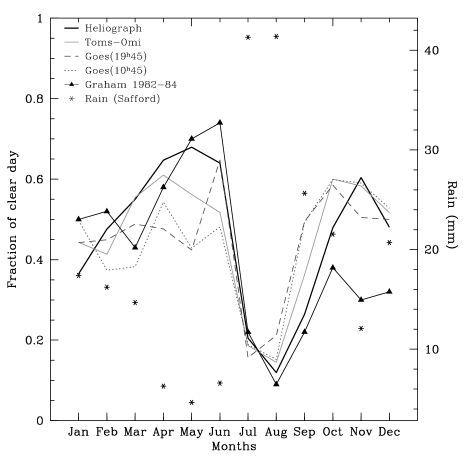
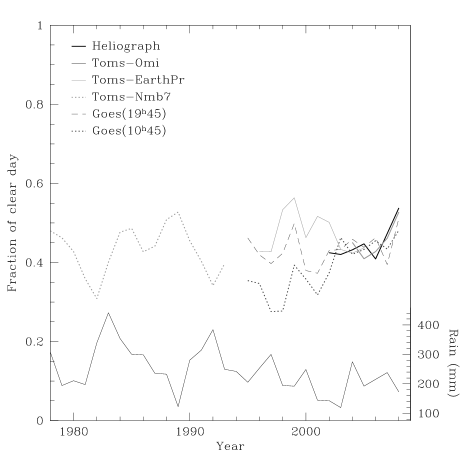
Fig. 18 shows the long-term yearly composite distribution of the fraction of clear night fraction computed using the heliograph database, the TOMS (OMI, Earth probe and Nimbus7) satellite data, the GOES 8 and 12 data taken at the 19:45 and 10:45 local time and the rain distribution derived from Safford database. It can be seen as the rain distribution is very well anticorrelated with the distribution of the clear time, in particular with the clear time record in the database of Nimbus-7. A major drop in the fraction of clear time occurred between 1982 and 1983, corresponding to a sharp rainfall peak. This was also the period of the Mt Graham site testing. According to the suggestion discussed in the site testing report we confirm that the lower fraction reported (and discussed above) was due to a climate fluctuation. A general trend with decreasing rainfall and increase of the clear time fraction between 1980 and 2008 can also be seen. The year 2008 (in particular the spring) was recorded in Arizona as one of the driest of the last fifty years.
6 Conclusion
We have presented a quantitative survey of cloudy coverage at la Palma and Mt Graham using both ground and satellite data. In order to quantify the amount of clear nights, we used different databases, in particular the end-of-nights reports obtained at TNG and LBT telescopes, the CMT extinction file for La Palma and the heliograph and rainfall databases at Mt Graham. Satellite data are derived from GOES 12 at La Palma and GOES 8 and 12 at Mt Graham. A further check have been done only for Mt Graham using the TOMS family satellites.
The analysis mainly addresses the years 2007 and 2008 but a long-term analysis is also reported for Mt Graham. The sample at La Palma is composed of 731 consecutive nights. After the cross correlation with the extinction file, this is reduced to 365 nights. The analysis at Mt Graham is based on 912 days. The sample from satellite is composed of 700 nights at la Palma and 964 at Mt Graham. A fixed threshold in the GOES IR emissivity selects the clear nights by satellite. At La Palma we have obtained that per cent of the 365 sampled nights are selected clear from ground, and per cent of the 365 nights are selected clear from satellite. Taking into account the common nights between ground and satellite data we found that per cent of the nights are selected clear for both. This shows good agreement but indicates that about per cent of the clear nights from ground are lost by the satellite data. At Mt Graham we found a good agreement between Columbine heliograph and night time observing log. In this case, that satellite found only per cent of the total of clear days found by the heliograph.
Two relevant additional conclusions can be derived from the Mt Graham analysis, as follows:
-
•
the rainfall trend at Safford can be used as tracer of the night time conditions at Mt Graham and possibly also in the whole Arizona area.
-
•
the limited day/night weather evolution at Mt Graham makes the results of a very simple device as the heliograph, useful to monitor with high accuracy the local status of the night time clear sky.
In addition, at la Palma we can derive the following conclusions:
-
•
It is possible to define a threshold in satellite emissivity to select clear nights with an uncertainty of per cent.
-
•
A good correlation exists between GOES 12 satellite and ground-based data.
-
•
Using the common selected nights we found that per cent are classified clear from both GOES 12 satellite and ground logbook.
-
•
The marginal increase to per cent of the concordance obtained including calima events confirm that the satellite is able to distinguish only the presence of clouds.
A further analysis of the satellite data (e.g.a wider field, the simultaneous use of different channels, etc.) is suggest to improve the prediction of clear nights. Furthermore, we are studying the fraction of clear nights lost for high humidity or strong wind.
6.1 ACKNOWLEDGMENTS
The authors acknowledge dr.Vincenzo Testa, from National Institute for Astrophysics, Roland Gredel, from Heidelberg Max Planck Institute for Astronomy, Antonio Magazzu from TNG and the former TNG Director Ernesto Oliva for the collaboration.
This activity is supported by the European Community (Framework Programme 7, Preparing for the construction of the European Extremely Large Telescope, Grant Agreement Number 211257).
References
- (1) Arderberg, A., 1983, in Arderberg A. and Woltjer L., eds., Proc. of ESO Workshop N.18, Site Testing for Future Large Telescopes. ESO,Graching bei Munchen,p. 73
- (2) Erasmus,D., Sarazin,M., 2002, in Vernin,J., Benkhaldoun, Z., Munoz-Tunon, C., Eds, ASP Conf. Series, 266, p. 310-326
- (3) Erasmus,D., van Rooyen,R., 2006, in Stepp, L.M. Ed., Proc. of SPIE Vol. 6267, Ground-based and Airborne Telescopes.
- (4) Jung,J.A., Schreiner A.J., Felts W.F., Thomas, S.M., Schimt, T.J., Daniels, J., 2004, Conf. on satellite Meteorology and Oceanography, see P7.4
- (5) Khyier, M.M., Norden,M/L., Doelling,D.L., Chakrapani, V., Minnis,P., Smith, W.L., 2004, Conf. on satellite Meteorology and Oceanography, see P7.6
- (6) Lombardi,G.,Zitelli,V., Ortolani,S., Pedani,M J., 2006, PASP, 118, 1198 (Paper I)
- (7) Lombardi, G., Zitelli, V., Ortolani, S., Pedani, M. 2007, PASP, 119, 292 (Paper II)
- (8) Lombardi, G., Zitelli, V., Ortolani, S., Pedani, M., and Ghedina, A., 2008, A&A, 483, 651-659
- (9) Murdin, P., 1985, Vista in Astronomy, 28, 449-465
- (10) Steward Observatory (Arizona), the scientific justification for the Mt Graham Observatory, Vol.I, 1987, The University of Arizona.
- (11) Stowe L.L., Wellemeyer C.G., Eck T.F., Yeh H.Y.M., and the Nimbus-7 Cloud data processing team, 1988, Journal of Climate, 1, 445.