Systematics of parton fragmentation in - and nuclear collisions
Abstract
Parametrizations of fragmentation functions (FFs) from - and p-p̄ collisions are combined with a parton spectrum model in a pQCD folding integral to produce minimum-bias fragment distributions. A model of in-medium FF modification is included. Calculated fragment distributions are compared with hard components from p-p and Au-Au spectra. Data are well described by pQCD over a large kinematic region for a range of Au-Au centralities.
pacs:
12.38.Qk, 13.87.Fh, 25.75.Ag, 25.75.Bh, 25.75.Ld, 25.75.NqI Introduction
RHIC collisions are conventionally described in terms of hydrodynamic (hydro) evolution of a thermalized bulk medium and energy loss of energetic partons (hard probes) in that medium. Hydro should dominate spectra below 2 GeV/c, parton fragmentation above 5 GeV/c, and “quark coalescence” in the intermediate interval.
However, recent analysis of spectrum and correlation structure has revealed minijet structures in RHIC collisions ppcorr1 ; ppcorr2 ; axialci ; hijscale ; ptscale ; ptedep ; daugherity . Two-component analysis of p-p and Au-Au spectra reveals a corresponding hard component (minimum-bias fragment distribution), suggesting that jet phenomena extend down to 0.1 GeV/c ppprd ; hardspec . Minijets minijet appear to dominate the transverse dynamics of nuclear collisions at energies above 15 GeV and provide unbiased access to fragment distribution structure down to a small cutoff energy for scattered partons (3 GeV) and to the smallest detectable fragment momenta ( GeV/c).
Minijets can be studied in the form of -spectrum hard components isolated via the two-component spectrum model. Measured hard components are compared with pQCD fragment distributions (FDs). Parton spectrum parameters and modifications to fragmentation functions (FFs) in more-central Au-Au collisions are inferred evolve . The goal is a comprehensive pQCD description of all nuclear collisions.
II Two-component model
The two-component (soft+hard) spectrum model was first obtained from a Taylor-series expansion of p-p spectra on uncorrected event multiplicity for ten multiplicity classes ppprd . The soft component was interpreted as longitudinal nucleon fragmentation, the hard component as transverse scattered-parton fragmentation.
The two-component model for p-p collisions with soft and hard multiplicities is
| (1) |
Coefficient scales as , is a Lévy distribution on and is a Gaussian plus QCD power-law tail on transverse rapidity ppprd . To compare with A-A spectra we define with reference model and similarly for .


The corresponding two-component model for per-participant-pair A-A spectra is
where () is the soft component and is the A-A hard component (with reference ) ppprd ; hardspec . Ratio is an alternative to nuclear modification factor . Centrality measure estimates the mean nucleon path length. We are interested in the evolution of hard component or ratio with A-A centrality.
III Fragmentation functions
- (e-e) fragmentation functions (FFs) have been parametrized accurately over the full kinematic region relevant to nuclear collisions ffprd . Light-quark and gluon fragmentation functions ( = e-e, p-p, A-A) are described above energy scale GeV by a two-parameter beta distribution on normalized rapidity ffprd . Fragment rapidity for unidentified hadrons is , and parton rapidity . Parameters vary slowly and linearly with above GeV and can be extrapolated down to GeV.
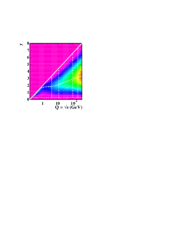
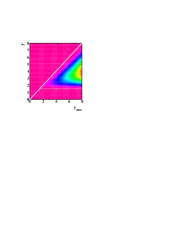
Fig. 1 (first panel) shows measured FFs for three energy scales from HERA/LEP tasso ; opal . The curves are parametrizations which describe data over the entire fragment momentum range. Fig. 1 (second panel) shows the FF ensemble vs energy scale as a surface plot ffprd .
Figure 1 (third panel) shows FF data from p-p̄ collisions at FNAL cdf1 . The dotted line represents the lower limit for e-e FFs. There is a significant systematic difference between p-p and e-e FFs. The CDF FFs also reveal suppression at larger parton energies relative to LEP e-e systematics. Fig. 1 (fourth panel) is a surface plot of the p-p FF parametrization evolve —the e-e FF parametrization modified by cutoff factor
| (3) |
with determined by the CDF FF data cdf1 . The cutoff represents real fragment and energy loss from p-p relative to e-e FFs. The difference suggests that FFs may not be universal.


IV QCD fragment distributions
The parton spectrum from minimum-bias scattering into an acceptance near projectile mid-rapidity can be parametrized as
with . The cutoff factor
| (5) |
represents the minimum parton momentum which can lead to detectable charged hadrons as neutral pairs. Parton spectrum and cutoff parameters are determined by comparing FDs with p-p and Au-Au spectrum hard components.
Fig. 2 (first panel) shows the parton spectrum (solid curve) with cutoff GeV inferred from a p-p spectrum hard component evolve . The bold dotted curve is an ab-initio pQCD calculation cooper . The spectrum integrates to mb, consistent with pQCD theory sarc .
The pQCD folding (convolution) integral used to obtain fragment distributions is
| (6) |
where is the FF ensemble from some collision system (e-e, p-p, A-A, in-medium or in-vacuum), and is the parton spectrum evolve . Hadron spectrum hard component represents the fragment yield from scattered parton pairs into acceptance . Efficiency factor includes the probability that the second jet also falls within . is the effective interval for scattered partons. ( mb for GeV) is the cross section for NSD p-p collisions.
Fig. 2 (second panel) shows integrand of Eq. (6) with unmodified FFs from e-e collisions and lower bound at ( GeV/c) (dotted line). Fig. 2 (third panel) shows the corresponding FD (solid curve), the “correct” FD describing inclusive hadrons from partons produced by free parton scattering from p-p collisions. The dash-dotted curve is the hard-component model inferred from p-p spectrum data ppprd . The FD from e-e FFs lies well above the measured p-p hard component for hadron GeV/c (), and the mode is shifted down to GeV/c. The “correct” e-e FD strongly disagrees with the hard component of the p-p spectrum. Nevertheless, the e-e FD is the proper reference for nuclear collisions evolve .

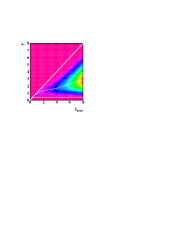


Fig. 2 (fourth panel) shows FD as the solid curve, with measured FFs from p-p̄ collisions. The mode of the FD is GeV/c. The solid points are hard-component data from p-p collisions and the dash-dotted curve is p-p model function ppprd . The comparison determines parton spectrum parameters ( GeV), and exponent and establishes a quantitative relationship among parton spectrum, measured FFs and measured spectrum hard components over all , not just a restricted interval above 2 GeV/c.
V Parton “energy loss” model
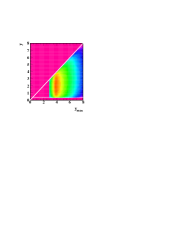
Fragmentation in A-A collisions requires a model of parton “energy loss” or medium modification. We adopt a minimal model of FF modification (Borghini-Wiedemann or BW) bw . Figure 3 (first panel) illustrates the BW model (cf. Fig. 1 of bw , = ). In-vacuum e-e FFs for and 200 GeV from the beta parametrization are shown as dashed and solid curves ffprd . We can simulate BW accurately by changing parameter in by (dash-dotted and dotted curves) evolve . Small reductions at larger fragment momenta (smaller ) are compensated by much larger increases at smaller momenta. The largest changes (central Au-Au) correspond to an inferred 25% leading-parton fractional “energy loss.” Fig. 3 (second panel) shows the modified e-e FF ensemble with FF modes shifted to smaller fragment rapidities .
Figure 3 (third panel) shows (solid curve), the FD obtained by inserting in-medium e-e FFs from the second panel into Eq. (6). The dotted curve is the reference from in-vacuum e-e FFs. The mode of is GeV/c. Fig. 3 (fourth panel) shows results for p-p FFs. Major differences between p-p and e-e FDs appear below GeV/c (). Conventional comparisons with theory (e.g., data vs NLO FDs) typically do not extend below 2 GeV/c phenixnlo . The large difference between the two collision systems below 2 GeV/c reveals that the small- region, conventionally assigned to hydro phenomena, may be essential for effective study of fragmentation evolution in A-A collisions.
VI Fragmentation evolution
Measured FFs are combined with a parametrized pQCD parton spectrum to produce calculated for comparison with measured spectrum hard components . Figure 4 (first panel) shows spectrum hard components (solid curves) for five centralities from 200 GeV Au-Au collisions hardspec . The hard components scale proportional to , as expected for parton scattering and fragmentation (jets). The points are from 200 GeV NSD p-p collisions ppprd . The dashed curve is , and the upper dotted curve is with , which corresponds to the most-central Au-Au curve (0-12%). The parton spectrum cutoff for has been reduced from 3 GeV () to 2.7 GeV () to match the central Au-Au hard component near .
Jet-related spectrum structure can also be studied with ratios. The conventional spectrum ratio at RHIC is . Because it includes the spectrum soft component strongly suppresses fragment contributions at smaller . Hard-component evolution with centrality is better resolved by ratio . However, studies in Ref. evolve reveal that the proper reference for all systems is the in-vacuum FD from e-e FFs, not p-p FFs. We therefore define ratios with xx = ee, NN, AA and yyy = med or vac to be compared with equivalent spectrum hard components .
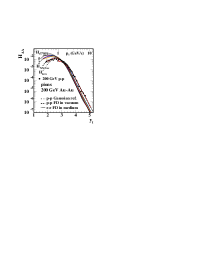
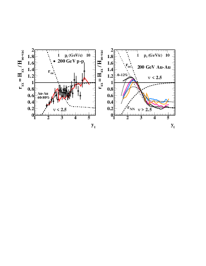
Figure 4 (second panel) shows ratios redefined in terms of the ee-vac reference: (p-p data – points), (peripheral Au-Au data – solid curve hardspec ) and calculated (dash-dotted curve) and (dashed curve) all divided by reference . Strong suppression of p-p and peripheral Au-Au data apparent at smaller results from the cutoff of p-p FFs.
Figure 4 (third panel) shows measured for more-central Au-Au collisions (solid curves) above a transition point on centrality at , with partial restoration of the suppressed region at smaller and strong suppression at larger . The latter has been a major observation at RHIC (high- suppression, “jet quenching” starraa ). Newly apparent is the accompanying large increase in fragment yield below 2 GeV/c, still strongly correlated with the parent parton daugherity . Changes in fragmentation depend strongly on centrality near the transition point. It is remarkable that the trend at 10 GeV/c corresponds closely to the trend at 0.5 GeV/c. , and ratios based on the e-e in-vacuum reference are well described by pQCD FDs from 0.3 to 10 GeV/c evolve .
VII Conclusions
Hard components of spectra can be identified with minimum-bias parton fragmentation in nuclear collisions. Minimum-bias fragment distributions (FDs) can be calculated by folding a power-law parton energy spectrum with parametrized fragmentation functions (FFs) derived from - and p-p̄ collisions. Alterations to FFs due to parton “energy loss” or “medium modification” in Au-Au collisions are modeled by adjusting FF parametrizations consistent with rescaling QCD splitting functions. The reference for all nuclear collisions is the FD derived from in-vacuum - FFs. Relative to that reference the hard component for p-p and peripheral Au-Au collisions is found to be strongly suppressed for smaller fragment momenta. At a specific point on centrality the Au-Au hard component transitions to enhancement at smaller momenta and suppression at larger momenta, consistent with FDs derived from medium-modified - FFs.
I thank the organizers of ISMD 2009 for a delightful and informative conference. This work was supported in part by the Office of Science of the US DOE under grant DE-FG03-97ER41020.
References
- (1) R. J. Porter and T. A. Trainor (STAR Collaboration), J. Phys. Conf. Ser. 27, 98 (2005), hep-ph/0506172.
- (2) R. J. Porter and T. A. Trainor (STAR Collaboration), PoS C FRNC2006, 004 (2006).
- (3) J. Adams et al. (STAR Collaboration), Phys. Rev. C 73, 064907 (2006).
- (4) Q. J. Liu, D. J. Prindle and T. A. Trainor, Phys. Lett. B 632, 197 (2006).
- (5) J. Adams et al. (STAR Collaboration), J. Phys. G: Nucl. Part. Phys. 32, L37 (2006).
- (6) J. Adams et al. (STAR Collaboration), J. Phys. G 33, 451 (2007).
- (7) M. Daugherity (STAR Collaboration), J. Phys. G 35, 104090 (2008).
- (8) J. Adams et al. (STAR Collaboration), Phys. Rev. D 74, 032006 (2006).
- (9) T. A. Trainor, Int. J. Mod. Phys. E 17, 1499 (2008), arXiv:0710.4504.
- (10) X. N. Wang, Phys. Rev. D 46, R1900 (1992).
- (11) T. A. Trainor, Phys. Rev. C 80, 044901 (2009), arXiv:0901.3387.
- (12) T. A. Trainor and D. T. Kettler, Phys. Rev. D 74, 034012 (2006).
- (13) W. Braunschweig et al. (TASSO Collaboration), Z. Phys. C 47, 187 (1990).
- (14) M. Z. Akrawy et al. (OPAL Collaboration) Phys. Lett. B, 247, 617 (1990).
- (15) K. Goulianos (CDF Collaboration), Proceedings of the “QCD and high energy hadronic interactions,” XXXII Rencontres de Moriond, Les Arces, France, March 22-29, 1997,
- (16) F. Cooper, E. Mottola and G. C. Nayak, Phys. Lett. B 555, 181 (2003).
- (17) I. Sarcevic, S. D. Ellis and P. Carruthers, Phys. Rev. D 40, 1446 (1989).
- (18) N. Borghini and U. A. Wiedemann, hep-ph/0506218.
- (19) A. Adare et al. (PHENIX Collaboration), Phys. Rev. D 76, 051106 (2007).
- (20) C. Adler et al. (STAR Collaboration), Phys. Rev. Lett. 89, 202301 (2002).