A Suzaku Observation of NGC 4593: Illuminating the Truncated Disk
Abstract
We report results from a 2007 Suzaku observation of the Seyfert 1 AGN NGC 4593. The narrow Fe K emission line has a FWHM width 4000 km s-1, indicating emission from 5000 . There is no evidence for a relativistically broadened Fe K line, consistent with the presence of a radiatively efficient outer disk which is truncated or transitions to an interior radiatively inefficient flow.
The Suzaku observation caught the source in a low-flux state; comparison to a 2002 XMM-Newton observation indicates that the hard X-ray flux decreased by 3.6, while the Fe K line intensity and width each roughly halved. Two model-dependent explanations for the changes in Fe K line profile are explored. In one, the Fe K line width has decreased from 10000 to 4000 km s-1 from 2002 to 2007, suggesting that the thin disk truncation/transition radius has increased from 1000–2000 to 5000 . However, there are indications from other compact accreting systems that such truncation radii tend to be associated only with accretion rates relative to Eddington much lower than that of NGC 4593. In the second model, the line profile in the XMM-Newton observation consists of a time-invariant narrow component plus a broad component originating from the inner part of the truncated disk (300 ) which has responded to the drop in continuum flux. The Compton reflection component strength is 1.1, consistent with the measured Fe K line total equivalent width with an Fe abundance 1.7 times the solar value. The modest soft excess, modeled well by either thermal bremsstrahlung emission or by Comptonization of soft seed photons in an optical thin plasma, has fallen by a factor of 20 from 2002 to 2007, ruling out emission from a region 5 lt-yr in size.
Subject headings:
galaxies: active — galaxies: Seyfert — X-rays: galaxies — galaxies: individual (NGC 4593)1. Introduction
Accretion onto supermassive black holes in many Active Galactic Nuclei (AGN) is generally thought to proceed via a radiatively efficient, optically thick, geometrically thin disk (“-disk”, e.g., Shakura & Sunyaev 1973), as evidenced by their optical/UV continua (the “big blue bump”; Sun & Malkan 1989). Galactic black hole systems also contain evidence for such a component; the thermal blackbody emission extends into the soft X-ray band. In Seyferts, the Fe K emission line at 6.4 keV line is a key tracer of the radiatively efficient circumnuclear material. Narrow lines with Doppler-broadened FWHMs of a few thousand km s-1 are virtually ubiquitous in X-ray spectra of low-redshift Seyferts observed with XMM-Newton, Chandra-HETGS or Suzaku (e.g., Yaqoob & Padmanabhan 2004, Nandra 2006) and indicate material originating light-days or farther from the black hole, e.g., in the outer disk or molecular torus. Fe K line emission originating near the innermost stable orbit of the disk yields a broad (FWHMs 0.1) and redshifted profile sculpted by general and special relativistic effects in the regime of strong gravity (Fabian et al. 1989, 2002), although to accurately gauge the strength of the line, one must correctly model any continuum curvature which may be associated with ionized absorption along the line of sight (e.g., Reeves et al. 2004, Turner et al. 2005).
However, the flow in compact systems accreting at relatively low values relative to the Eddington limit may contain a radiatively inefficient component (a radiatively inefficient accretion flow or RIAF; Narayan et al. 1998, Quataert 2001); a configuration consisting of an inner RIAF flow which is surrounded by an -disk beyond some transition radius (e.g., Esin et al. 1997) has been suggested for some low-luminosity AGN (Lu & Wang 2000 and references therein). In the case of the Seyfert 1 AGN NGC 4593, modeling of the optical/UV continuum indicates blackbody emission from a truncated thin disk, with an inner radius of emission of 30 1111 (Lu & Wang 2000). An observation with XMM-Newton in 2002 indicated a FWHM line width of 110001000 km s-1; assuming a black hole mass of , this width suggests an inner extent of no less than roughly 1000 (Brenneman et al. 2007, hereafter B07). No broad Fe K line has been confirmed with XMM-Newton (Reynolds et al. 2004, B07). These results were consistent with those obtained from a Chandra-HETGS observation in 2001, from which Yaqoob & Padmanabhan (2004) measured a FWHM line width of km s-1. An earlier ASCA observation in 1994 indicated line emission from a radius of 30, consistent with the thin disk truncation radius suggested from optical/UV continuum (“big blue bump”) spectral energy distribution (SED) fitting (Lu & Wang 2000). Furthermore, the 2002 XMM-Newton observation revealed, in addition to the Fe K core, line emission from ionized Fe, likely Fe XXVI (B07). Such line features are relatively rare in Seyfert X-ray spectra, and could potentially originate in the collisionally ionized transition region between the inner radiatively inefficient flow and the thin disk (e.g., Lu & Wang 2000).
Another diagnostic reflection component present in hard X-ray spectra is the Compton reflection hump peaking at 20–30 keV, expected when the hard X-ray power-law continuum illuminates optically thick material. The strength of the Compton reflection hump was found to be 1 in a 1997 observation with BeppoSAX (Guainazzi et al. 1999); = 1 corresponds to a slab covering 2 sr of the sky as seen from the illuminating X-ray source. The Suzaku X-ray observatory is the first since BeppoSAX to provide continuous coverage from below 1 keV to at least 50 keV, allowing users to spectrally deconvolve the broadband continuum components (absorbing components, the primary power-law, and the Compton reflection hump), but Suzaku’s lower 10 keV background yields a more accurate determination of .
In this paper, we report results from an observation of the nucleus of NGC 4593 with Suzaku in 2007, with the goals of constraining the Fe K emission profile and accurately determining the strength of the Compton reflection hump in order to constrain the geometry of the circumnuclear accreting gas. As demonstrated below, Suzaku caught the source at an atypically low 2–10 keV flux level, a factor of almost 4 lower than during the XMM-Newton observation. We observe significant changes in the Fe K profile between the 2002 XMM-Newton and 2007 Suzaku observations which may be related to the decrease in continuum flux. We also report evolution in the strength of the soft excess, and, tentatively, the ionized Fe K emission.
The rest of this paper is organized as follows: Section 2 describes the observations and data reduction. In Section 3, we present fits to the Fe K emission complex observed with Suzaku and compare the results to those for the 2002 XMM-Newton observation. In Section 4, we present fits to the 0.3–76 keV broadband Suzaku time-averaged spectrum, and again compare the results to those obtained from XMM-Newton to investigate long-term spectral variability of the broadband emission components. The results are discussed in Section 5.
2. Observations and Data Reduction
NGC 4593 ( = 0.00900, Strauss et al. 1992; = 12h39m39.4s, = –5d20m39s, J2000.0 coordinates from the NASA Extragalactic Database) was observed with Suzaku from 2007 December 15 at 04:44 UT until 2007 December 17 at 23:20 UT (observation ID 702040010). We used data from both the X-ray Imaging Spectrometer (XIS; Koyama et al. 2007) CCDs and the Hard X-ray Detector (HXD; Takahashi et al. 2007). For the HXD, we used only data collected with the PIN diodes; we did not consider GSO data in the paper due to the faintness of the source relative to the GSO background. The XIS-nominal pointing position was used. Further details of the Suzaku observatory are given in Mitsuda et al. (2007).
2.1. XIS Reduction
The XIS data used in this paper were version 2.1.6.16 of the screened data provided by the Suzaku team; data collected within 436 s of passage through the South Atlantic Anomaly (SAA) were discarded, and data were selected to be at least 5 in elevation above the Earth rim (20 above the day-Earth rim). All XIS data were taken in normal clocking mode.
The XIS consists of four CCDs, numbered 0–3. XIS-0, 2, and 3 are front-illuminated (FI), the fourth (XIS-1) is back-illuminated (BI) and features an enhanced soft X-ray response. Use of XIS-2 was discontinued after 2006 November (when it was damaged due to a likely micro-meteoroid impact). The cleansis script was used to remove hot or flickering pixels. Source spectra were extracted from a 3 radius centered on the source. The background was extracted using four circles of radius 1.5, each located 6 from the source. The XIS-FI CCDs were in 33 and 55 editmodes, for a net exposure time after screening of 118.8 ks per XIS. XIS-1 was also in 33 and 55 editmodes, for a net exposure of 118.4 ks. Response matrices and ancillary response files (ARFs) were generated for each XIS independently using xissimrmfgen version 2007-05-14 and xissimarfgen version 2008-04-05 (Ishisaki et al. 2007). The XIS 0 and 3 source and background spectra were added using mathpha; response files and ARFs were added using addrmf and addarf, respectively. All spectra were binned to a minimum of 50 counts bin-1 to allow use of the statistic (Gehrels 1986).
To examine the accuracy of the XIS RMFs and determine residual line width due e.g., to imperfect CTI correction, we generated spectra for the emission lines generated by the 55Fe calibration sources illuminated two corners of each XIS. Using the above response matrices and ARFs, and XSPEC v.11.3.2ag, we fit the spectrum for each calibration source with a model consisting of three Gaussian components to model emission from Mn K, K, and K (expected line centroids of 5.899, 5.888, and 6.490 keV, respectively). The Mn K line energy centroids for the co-added XIS-FI, XIS-0, XIS-3, and for the XIS-BI were 5.908 0.001, 5.906 0.002, 5.910 0.002, and 5.902 0.003 keV, respectively; such discrepancies are consistent with the accuracy (0.2 at the Mn K energy) of the energy calibration of the XIS. Fitting the co-added XIS-FI calibration source lines without the response file, we determined the FWHM energy resolution during the observation to be 168 eV.
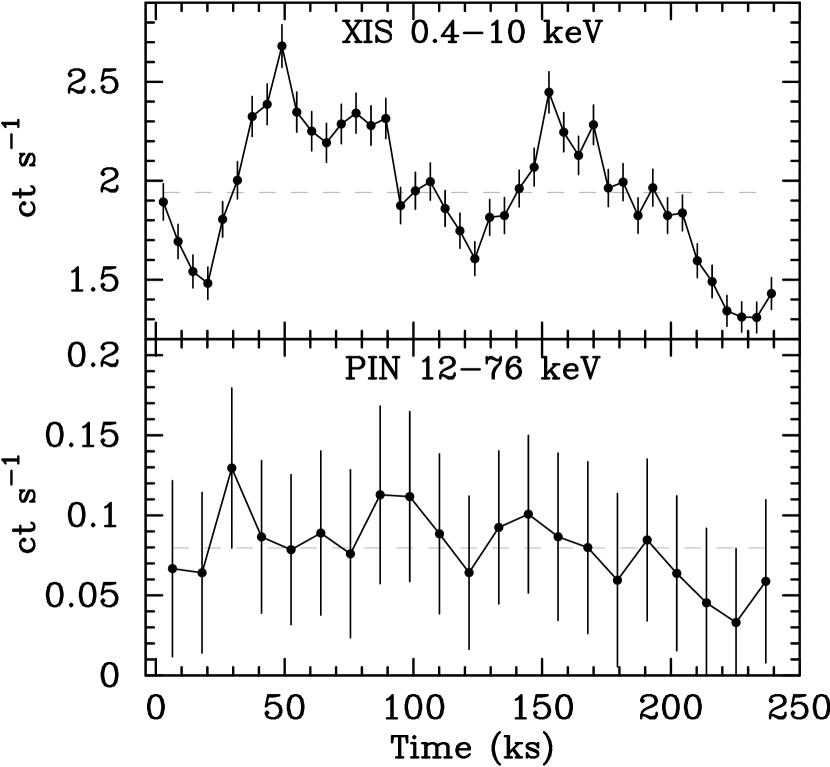
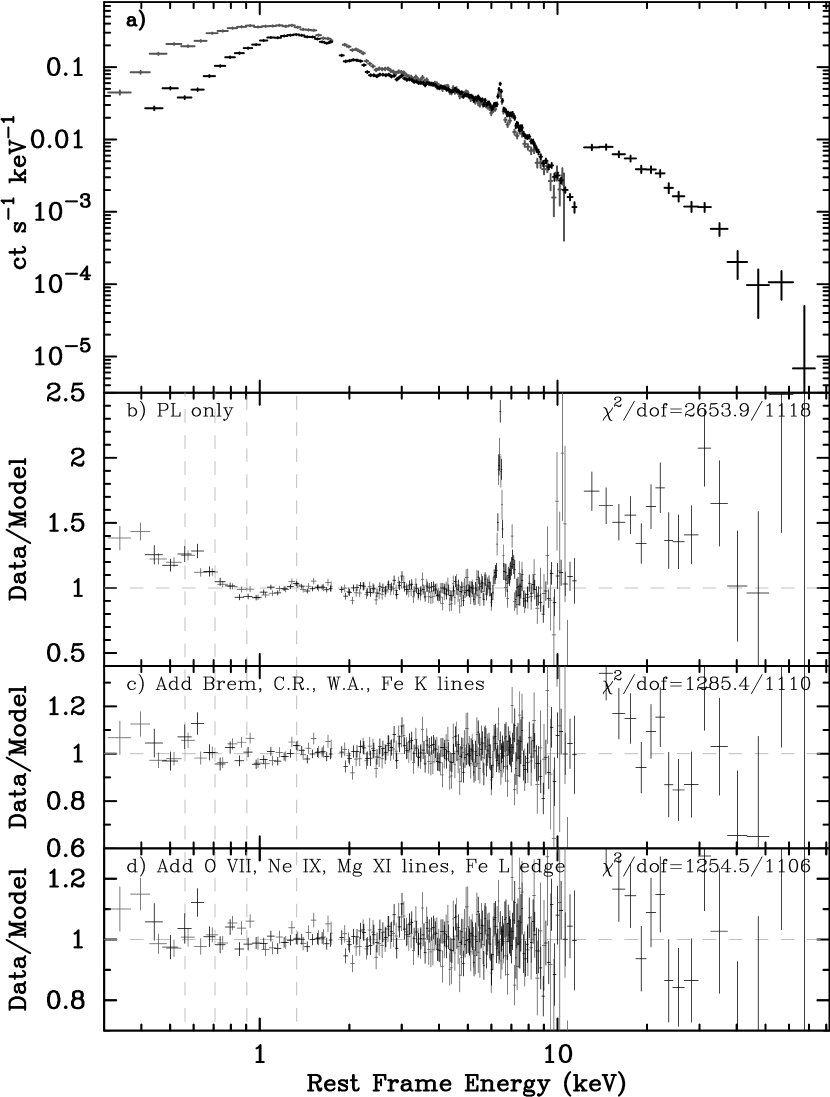
The 0.4–10 keV light curve, combined from all three operating XISes and binned to 5760 s, is plotted in the top panel of Fig. 1; the variability amplitude (see Vaughan et al. 2003 for definition) is .
2.2. HXD-PIN Reduction
The HXD-PIN is a non-imaging instrument with a 34 square FWHM field of view. 12–76 keV PIN source spectra were extracted from version 2.1.6.16 event files provided by the HXD instrument team. PIN background count rates are variable and strongly depend on the time since SAA passage (Kokubun et al. 2007), data were selected according to the following criteria: at least 500 s since SAA passage, geomagnetic cutoff rigidity (COR) 8 GV, and day- and night-Earth elevation angles each 5. Instrumental (non-X-ray) background spectra for the PIN were provided by the HXD Team, who generated the background using the calibrated GSO data for the background monitor (”tuned” background, with METHOD=LCFITDT). The current accuracy of the PIN non-X-ray background (NXB) model for a 1 day observation is 1.5 (1 peak-to-peak residuals) below 50 keV (Fukazawa et al. 2009). Both the source and background spectra were generated with identical good time intervals, and the source exposure was corrected for instrument dead time (a 6.8 effect; the background event files were already deadtime-corrected by the HXD Team). This yielded a good exposure time of 90.2 ks. To model the contribution to the total background from the Cosmic X-ray Background (CXB), a spectrum of the form 9.0 10-9(/3keV)-0.29 exp(/40keV) erg cm-2 s-1 sr-1 keV-1 (Gruber et al. 1999) was used (see the Suzaku ABC Guide for further details). The total (X-ray plus particle) background 12–76 keV flux was 8.6 10-10 erg cm-2 s-1.
The source spectrum was binned to a minimum of 400 counts bin-1. We used the response file aehxdpinxinome420080129.rsp. The mean 12–76 keV net source flux and count rate were 4.9 10-11 erg cm-2 s-1 and 0.077 ct s-1, respectively. The 12–76 keV net source light curve, binned to 11520 s (two satellite orbits), is plotted in the bottom panel of Fig. 1; error bars include a 2 systematic uncertainty (Fukazawa et al. 2009). The variability amplitude was 13.8.
There is a possible contaminating X-ray source, 1WGA J1239.7–0526, located about 5 south of NGC 4593, and thus in the field of view of the PIN. However, as demonstrated in the Appendix, we estimate that in the 12–76 keV band, this source contributes only 710-13 erg cm-2 s-1 to the observed 12–76 keV spectrum of NGC 4593 (about 1.5 of the net source flux), and can be safely ignored.
3. Model Fits to the Fe K Bandpass Spectrum
All spectral fitting in this paper used XSPEC v.11.3.2ag. The abundances of Lodders (2003) were used. In all fits below, a neutral Galactic column of 1.89 1020 cm-2 was included (Kalberla et al. 2005). Unless otherwise stated, all errors below correspond to = 2.71 (90 confidence level for one interesting parameter when the errors are symmetric) with the XIS-BI/XIS-FI normalization left free (best-fit values were usually close to unity) and the PIN/XIS normalization set at 1.16 (Maeda et al. 2008).
Previous soft X-ray observations of NGC 4593 have indicated absorption features attributed to an outflowing, warm absorber system. Using data from a 108 ks Chandra-LETGS observation in 2001 February and a 10 ks XMM-Newton observation in 2000 July, Steenbrugge et al. (2003) modeled two zones of ionized absorption along the line of sight: a highly-ionized zone with log = 2.610.09 erg cm s-1 and a column density cm-2, plus a more lowly-ionized zone with ionization parameter log near 0.5 erg cm s-1 and near cm-2; , where is defined as the isotropic 1–1000 Ryd ionizing continuum luminosity, is the electron number density, and is the distance from the central continuum source to the absorbing gas. Both zones were measured to be outflowing at –400 km s-1 relative to systemic. From an 80 ks observation with Chandra-HETGS in 2001 June, McKernan et al. (2003) confirmed the highly-ionized absorber, deriving cm-2 and log = erg cm s-1, although they derived a lower outflow velocity relative to systemic. The high-column, high-ionization component manifests mainly itself via H- and H-like lines, the most prominent ones being N VII, O VIII, Ne IX, Ne X, Mg XII, Si XIII, and Si XIV, as well as an absorption edge due to O VIII, There is also line absorption due to Fe L XX–XXV which, in CCD resolution spectra, yields an absorption trough near 0.9 keV and a series of blended edges which yield a trough from 1.3 to 2.2 keV. The low-column, low-ionization component manifests itself via O V and O VI absorption and is not expected to contribute strongly to CCD resolution spectra above 0.2 keV. McKernan et al. (2003) also reported a neutral Fe L3 edge at 707 eV due to dust along the line of sight in the host galaxy of NGC 4593 (this feature was also detected by B07 in their analysis of the XMM-Newton pn spectrum). A moderately strong, steep soft excess has been known since an EXOSAT observation by Pounds & Turner (1988) and has been phenomenologically modeled using thermal bremsstrahlung and Comptonization models (e.g., B07).
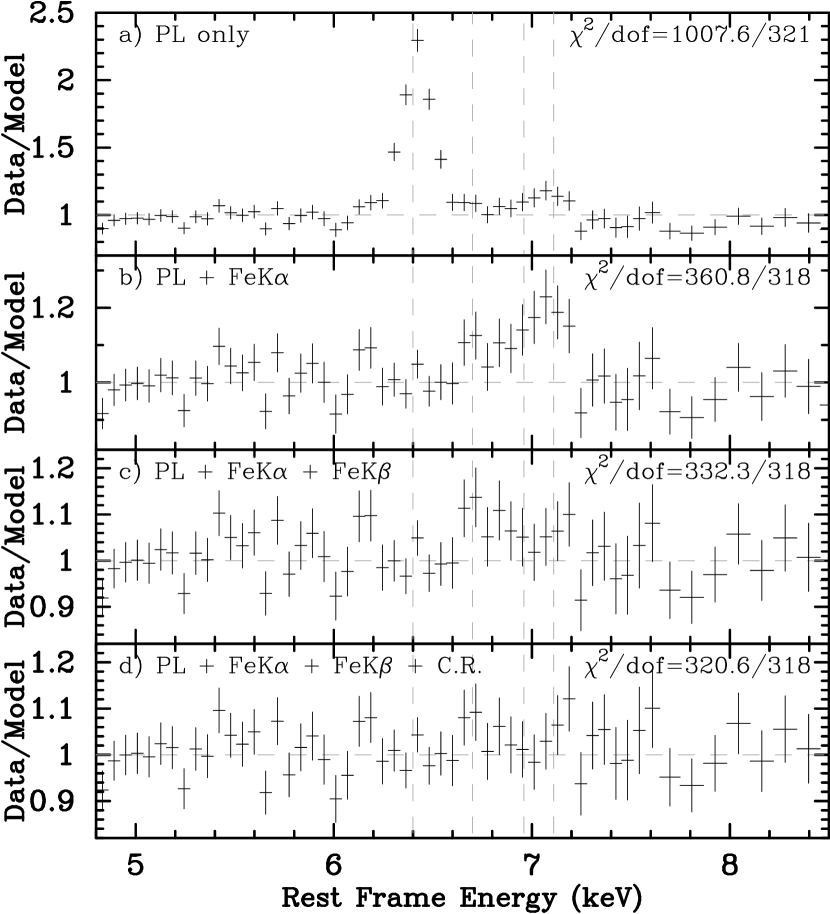
To fit the Fe K bandpass, we restricted ourselves to the 4–11.5 keV band of the co-added XIS-FI spectrum, where warm and neutral absorption and the soft excess are not expected to have an impact. Data/model residuals to a simple power-law are plotted in Figure 2a, and reveal that in addition to the clear Fe K emission line at 6.4 keV, there is emission near 7.0 keV (all photon energies are rest frame unless otherwise stated). A model consisting of a power-law plus a Gaussian component to model the Fe K line yields =360.8/318; residuals are plotted in Fig. 2b. We added a Gaussian with energy centroid fixed at 7.056 keV to model Fe K emission, with the normalization held at 0.13 times that of the Fe K emission line (i.e., assuming K emission from neutral Fe; untying this parameter did not yield a significant improvement in this or any subsequent fit). fell to 332.3/318. Data/model residuals are plotted in Fig. 2c. To model the effects of an Fe K edge at 7.11 keV due to Compton reflection, we added a pexrav component (Magdziarz & Zdziarski 1995), with an inclination angle of 30 assumed, and a power-law cutoff set at 500 keV. The reflection strength was kept fixed at 1.08 and the Fe abundance was kept at solar, as per the best-fit model to the 0.3–76 keV Suzaku spectrum (see Section 4). fell to 320.6/318. This is our best-fit model to the Fe K bandpass spectrum; best-fit parameters are given in Table 1.
Data/model residuals are plotted in Fig. 2d. There appear to be some moderate (7) positive residuals at 6.7 keV, the energy of Fe XXV. However, there was no significant improvement to the fit when we added another Gaussian component with energy centroid fixed at 6.70 keV and width fixed at 1 eV. fell by only 2.5 for one less , significant at only the 88 confidence level according to an -test (and at 87.5 according to Monte Carlo simulations.)222As pointed out by Protassov et al. (2002), it is improper to use the -test to determine the statistical significance associated with comparing a model which contains an emission or absorption line to a “null hypothesis” model where the line does not exist. This is because the -test cannot be used when the null values of one parameter lie on the boundary of possible parameter values. In the case of any emission or absorption line, the boundary condition of zero line flux occurs for the null hypothesis model. When the -test is used in this manner, the resulting statistical significance is at best only an “estimate” of the true stastical significance. In this paper, we include the results from the -test, but we also include results using Monte Carlo simulations, described in detail in Section 3.3 of Porquet et al. (2004). In these simulations, one searches over the possible energy ranges where a feature may be expected to be detected, fitting an unresolved Gaussian at multiple energy bins to test if fitting spurious features due to photon noise can yield a reduction in as large as the reduction associated with including the emission/absorption line in the model. In the case of a line with an expected observed energy, e.g., 6.70 keV in the case of an expected Fe XXV emission line, we searched over an energy range which was centered on the line expected energy and had a width the FWHM resolution of the instrument. Throughout this paper, we list the statistical significances determined from Monte Carlo simulations in parentheses following the significances estimated using the -test. The upper limit on the intensity (equivalent width, ) to Fe XXV emission was ph cm-2 s-1 (19 eV).
B07 reported detection of an emission line near 6.9 keV, likely associated with Fe XXVI. We added to our model a narrow (width =1 eV) Gaussian component with energy centroid fixed at 6.96 keV, but no there was no significant improvement to the fit, as was 2.71 for one less . The upper limit on the intensity () to Fe XXVI emission was ph cm-2 s-1 (17 eV).
The Fe K line’s width is 41 eV (41 eV after subtracting in quadrature the instrumental broadening of 9 eV based on the fits to the 55Fe calibration sources in Section 2.1). The line is 25519 eV. The best-fit energy centroid of the Fe K line in the co-added spectrum is 6.4210.007 keV, or 6.4120.007 keV after accounting for the small gain offset as indicated by the 55Fe calibration line. The best-fit line energies in separate fits to the individual XIS-0 and XIS-3, and XIS-1 spectra are 6.4220.009, 6.4080.009 keV, and 6.4010.014 keV, respectively, after accounting for the gain offsets in each of those detectors. The small implied offset from 6.40 keV in the co-added spectrum is likely not real, given that XIS-3 and XIS-1 each indicate emission consistent with neutral Fe, and there may be a slight energy scale problem associated with XIS 0 under investigation as of this writing. We also note that the Fe K line width in each XIS is consistent with that from the co-added spectrum.
We tested for the presence of a Compton shoulder, expected if the bulk of the narrow Fe K line (hereafter also referred to as the “core”) originates in Compton-thick material. We modeled such a component using a Gaussian component with energy centroid fixed at 6.32 keV and width left free.333The sum of first scatterings of Fe K photons forms a “shelf”-like feature extending redward from 6.400 keV, with the maximum downward energy shift due to a single Compton scattering being 0.156 keV; the shape of the “shelf” and the intensity relative to that of the Fe K core are dependent upon geometry, column density of the reflecting material, and viewing angle (see e.g., Murphy & Yaqoob 2009; Watanabe et al. 2003; Matt 2002). Given the quality of the current data set and the energy resolution of the XIS, a Gaussian emission component can be an adequate substitute for a first-scattering Compton shoulder if the energy centroid is constrained to 6.244 keV (ideally, centered near 6.32 keV) and the width is 0.1–0.2 keV. We found an upper limit to the intensity () to Compton shoulder emission of ph cm-2 s-1 (44 eV), or about 24 that of the Fe K core.
3.1. Comparison with the 2002 XMM-Newton Observation
To investigate possible evolution of the Fe K emission complex, we compared the results obtained with Suzaku to those obtained in a re-analysis of the 76 ks observation in 2002 June by the XMM-Newton (ObsID 0059830101). We downloaded Observation Data Files (ODF) events data and reprocessed events for the European Imaging Photon Camera (EPIC) pn detector using XMM Science Analysis Software v.7.1.0. Further details of the observation are given in B07. Source and background spectra were extracting using standard analysis methods for a good exposure time of 53 ks (the pn had been in small window mode to prevent pile-up). The source spectrum was grouped to a minimum of 40 ct bin-1.
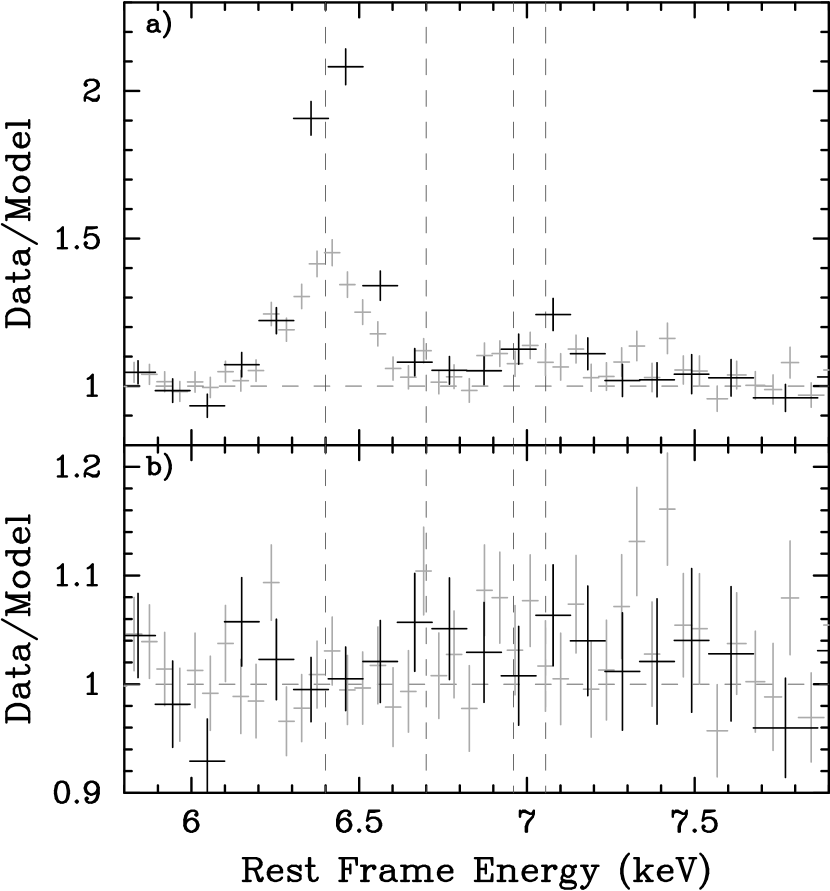
We fit the 4–11.5 keV pn spectrum with a model consisting of a power-law component plus Gaussian components to model emission from Fe I K and K, and Fe XXVI. We also included a Compton reflection component using pexrav with fixed at 1.08.444Fixing at 1.08 follows the assumption that the Compton reflection component has tracked the continuum flux over 5 years. If the absolute normalization of the Compton hump tracked the intensity of the Fe K line from 2002 to 2007, then we would expect to increase by a factor of 2.24–2.42 (consistent with tracking the of the Fe line). In the 2002/XMM-Newton spectrum, if were really 2.42, then we would observe a significant Fe K edge at 7.1 keV. With the lack of 10 keV coverage, the value of is poorly constrained, but fixing at 2.42 (or any value 1), with solar Fe abundance, yielded edge-like residuals in emission above 7.1 keV. Thawing the Fe abundance did not yield data/model residuals as good as when had been fixed at 1.08. The exact choice of in the fits is thus somewhat arbitrary, but does not significantly affect our conclusions in the paper regarding the evolution in the observed width of the Fe K line or in the soft excess. It was not significant to include an edge at 7.11 keV (optical depth 0.03), so the choice of is somewhat arbitrary given that there was no simultaneous 10 keV energy coverage. However, the depth of the Fe K edge does not significantly affect the conclusions, and so we include this component for completeness. The best-fit parameters are listed in Table 1 for comparison with the 2007 Suzaku results; parameters are consistent with those obtained by B07 for the Fe K and the Fe XXVI lines. Fig. 3a shows data/model residuals to a model consisting of only a power-law and a Compton reflection hump for both the XMM-Newton and Suzaku Fe K bandpass spectra; Fig. 4 shows contour plots of line intensity versus centroid energy to this model indicating the significance of including an unresolved Gaussian component. Fig. 3b shows the data/model residuals when the Fe K and Fe K lines are additionally modeled.
We also tested for a possible Compton shoulder, modeled the same way as in Section 3.1; the upper limit to Compton shoulder emission intensity () was ph cm-2 s-1 (22 eV), or 23 that of the Fe K core.
Comparing the results from the 2007 Suzaku and 2002 XMM-Newton observations, several things are apparent. While the 4–10 keV flux has decreased from erg cm-2 s-1 in 2002 to erg cm-2 s-1 in 2007 (a factor of 3.6), the total intensity of the Fe K line has decreased from (2002) to ph cm-2 s-1 (2007), a factor of only 1.6. The Fe K line thus has increased from 114 11 eV (2002) to 25519 eV (2007). In this model where the Fe K line is modeled with a single Gaussian component, the width has decreased from 8717 eV (2002) to 41 eV (2007). The two line widths are inconsistent up to the = 9.5 (99.7, or 3) confidence level. Given that the XIS and the pn have similar energy resolution near 6 keV, the evolution in line width is likely intrinsic to the source.
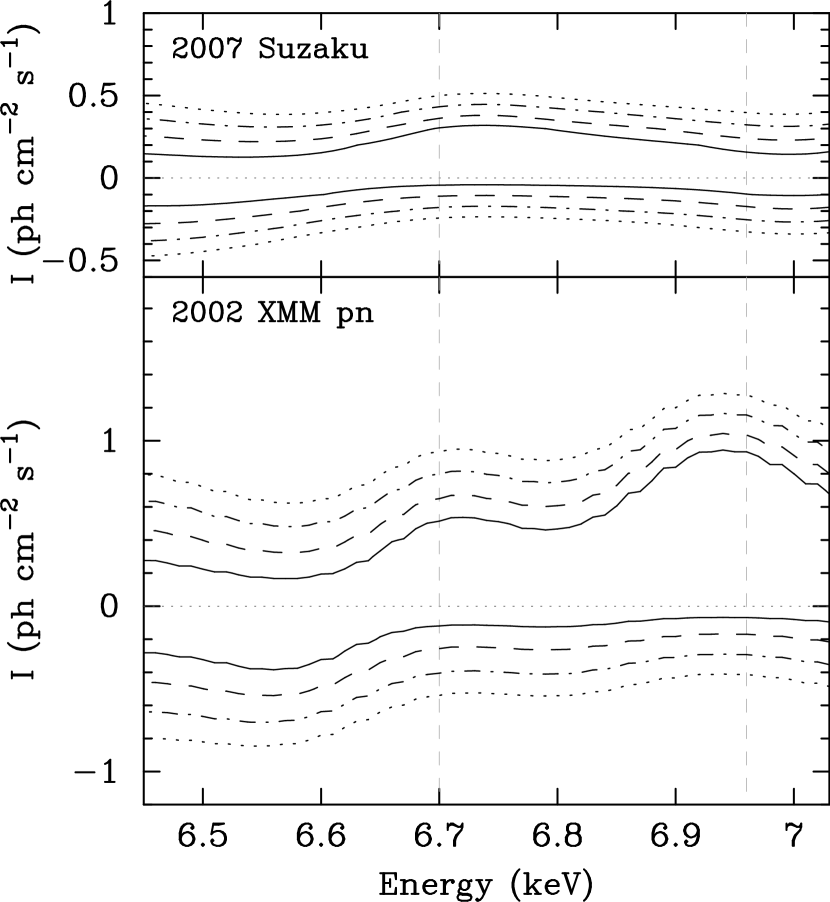
Finally, there is highly tentative evidence that the ionized emission blueward of 6.4 keV has evolved, too. The lower limit to the intensity of the Fe XXVI line in the pn spectrum and the upper limit to Fe XXVI emission (assuming an unresolved line in each case) are just barely consistent at the 90 confidence level Figs. 3b and 4 hint at a marginal change in line intensity as well. We caution, however, that, given the energy resolution and the quality of the spectrum, there is likely blending between the Fe XXVI and Fe K lines and Fe K edge at 7.11 keV, and the width of the Fe XXVI line is not constrained.
3.2. Dual-Gaussian Fit to the Fe K Core
As an alternative, we considered the possibility that the Fe K core in NGC 4593 consists of two Gaussian components, one narrow (width 40 eV) and one relatively broader, with 100 eV. The narrow component is assumed to be present in both spectra. The broad component is assumed to respond to the drop in continuum flux and assumed to be detected only in the 2002 XMM-Newton spectrum and to be too faint to be detected in the 2007 Suzaku spectrum.
We first fit the XMM-Newton spectrum with this “dual-Gaussian” model. The narrow Gaussian component’s width was fixed at 41 eV, the best-fit value from the Suzaku fit, and the broader Gaussian component’s width was left free. The intensity of the narrow Gaussian, , was initially kept fixed at the best-fit value from the Suzaku spectrum, ph cm-2 s-1, as might be expected if this component has not responded to the drop in continuum flux in the Suzaku spectrum; thawing this parameter did not yield a significant improvement in the fit and constraints on were poor. The intensity of the broad line, , was left as a free parameter. Both Gaussian energy centroids were fixed at 6.40 keV. In the best-fit model, = 1106.3/1092, eV, ph cm-2 s-1. The s of the narrow and broad components in the model were 64 eV and eV, respectively, i.e., both components comprise roughly equal fractions of the total line flux.
Returning to the Suzaku spectrum, we added to our best-fit model a Gaussian component with width fixed at 177 eV. This did not yield a significant improvement in the fit; the upper limit to the intensity () was ph cm-2 s-1 (65 eV).
4. The Broadband Suzaku Spectrum
We fit the XIS-FI data from 0.4–11.5 keV, the XIS-BI data from 0.3–10.5 keV, and the PIN data from 12–76 keV. Due to calibration uncertainties associated with the instrumental Si K edge, data from 1.75–1.83 keV were ignored in the XIS-FI and from 1.75–1.87 keV in the XIS-BI data. All the data are plotted in Figure 5a.
Data/model residuals to a simple power-law component absorbed only by the Galactic column are shown in Figure 5b and indicate spectral features reported in previous studies: an absorption feature near 0.9 keV, the moderate soft excess at lower energies, and an excess 12 keV which is likely the Compton reflection hump.
Our “initial guess” model was based on the best fit to the XMM-Newton spectrum by B07. It consisted of the following components: a power-law; a Compton reflection hump modeled with pexrav, with abundances set to solar values, an inclination angle of 30 assumed, and a power-law cutoff set at 500 keV; and a soft excess phenomenologically parametrized as thermal bremsstrahlung emission, using the model zbrem in xspec. We modeled one zone of ionized absorption with an xstar v.2.1l table which assumed solar abundances, a turbulent velocity of 200 km s-1 and an input photon spectrum of 2. The absorber’s outflow velocity relative to systemic was kept fixed at –400 km s-1 (Streenbrugge et al. 2003) The best-fit model had = 1285.4/1110; residuals are plotted in Figure 5c.
We then added components to model features reported in previous observations. We added narrow (width = 1 eV) Gaussian components to model line emission from O VII (energy centroid fixed at 561 eV) and Ne IX (energy centroid fixed at 905 eV), features reported using Chandra-HETGS by McKernan et al. (2003); dropped to 1279.8/1109 and then 1272.6/1108, respectively. We next added an Fe L3 edge with energy fixed at 707 eV, reported by both McKernan et al. (2003) and B07; fell to 1262.1/1107. A final improvement in the fit was achieved by adding a third narrow Gaussian near 1.33 keV, the energy of He-like Mg, where there still remained +3 to +4 residuals. We assumed emission from Mg XI and fixed the Gaussian energy centroid at 1.331 keV; fell to 1254.5/1106. Data/model residuals are plotted in Figure 5d. Best-fit model parameters are listed in Table 2. An additional layer of absorption, either neutral or ionized, was not required in our model. It was not significant to thaw the Fe abundance of the pexrav component from solar values.
In the best-fit model, the power-law component had = , and the warm absorber was modeled using a column density = cm-2 and an ionization parameter of log=2.39 0.17 erg cm s-1. The best-fit value of was 1.080.20, and Fig. 6 shows a contour plot of as a function of . The uncertainties here are statistical only, and calculated assuming the PIN/XIS-FI normalization is fixed at 1.16.555When the PIN/XIS-FI normalization was allowed to vary, it went to a value above 1.5, which is highly inconsistent with Suzaku calibration. The PIN/XIS-FI normalization was thus kept fixed at 1.16 in all fits. Assuming 1.5 systematics in the absolute background flux, the systematic uncertainty on is an additional 0.15 (not plotted in Fig. 6).
We explored alternate parametrizations of the soft excess. Modeling the soft excess as a simple power-law yielded a good fit, with = 1257.3/1106 for best-fit values of and power-law normalization at 1 keV of ph cm-2 s-1 keV-1. A good fit was also achieved assuming thermal Comptonization emission, modeled using comptt in xspec (Titarchuk 1994). A spherical geometry was assumed, as was an input soft photon temperature of 50 eV. In the best-fit model, was 1255.8/1105 for a plasma temperature of keV and optical depth 0.28. In the best-fit model for each cases, data/model residuals and the 0.4–1.0 keV flux of the soft excess component were virtually identical to those obtained for the best-fit model assuming thermal bremsstrahlung emission. All other model parameters were consistent with those obtained when thermal bremsstrahlung emission was modeled.
We next tested if emission from a relativistically broadened Fe K line was required. We used a laor component in xspec (Laor 1991). The inner radius, outer radius, disk inclination, and emissivity index were initially kept fixed at 1.5 , 400 , 30 and –3, respectively. Similar to Reynolds et al. (2004) for the 2002 XMM-Newton spectrum, no significant improvement to the fit was found even when thawing the inner radius or disk inclination ( dropped by less than 2). The upper limit to the broad Fe K line intensity () was ph cm-2 s-1 (40 eV).
We next explored if the soft excess and Compton reflection component could be modeled in a self-consistent manner by assuming reflection from an ionized surface. We used the table model reflion.mod (Ross & Fabian 2005), and set the input photon index equal to that for the primary power-law. Initially, the Fe abundance relative to solar values was kept fixed at 1.0. In the best-fit model, was 1368/1106 for near 1500 erg cm s-1, with poor data/model residuals. The fit was able to model correctly most of the soft excess flux, but underpredicted the strength of the Compton reflection hump, even as the best-fit value of went to 1.0. Allowing to vary did not improve the fit. We next modeled relativistic blurring of the ionized reflected emission with kdblur. We kept the outer radius of blurring fixed at 400 and allowed the inner radius to vary from 1.24 to 200 . However, no further significant improvement to the fit was found for any value of the inner radius tested. Ionized reflection models are not discussed further.
4.1. A Re-analysis of the 2002 XMM-Newton pn Broadband Spectrum
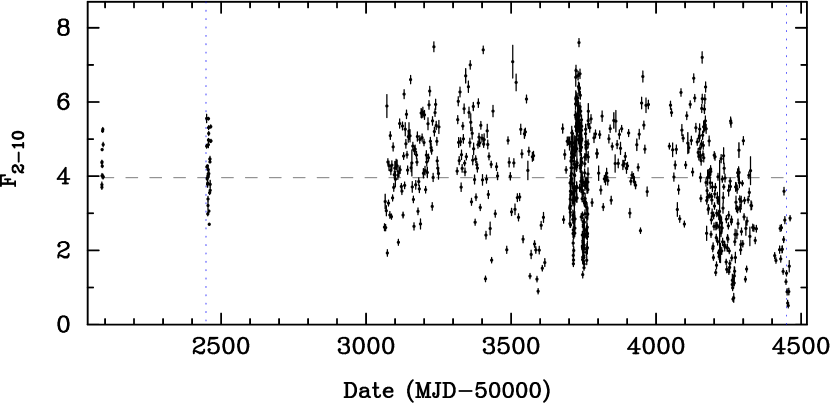
In the best-fit model, the observed (absorbed) 2–10 keV flux was erg cm-2 s-1, a factor of 3.8 lower than that reported by B07 for the 2002 XMM-Newton observation. This is also a factor of 3.8 lower than the long-term average 2–10 keV flux as determined by continuous Rossi X-ray Timing Explorer Proportional Counter Array (RXTE-PCA) monitoring from 2004 February to 2007 December666We downloaded all the public archive data for NGC 4593 and created a 2–10 keV light curve, binned for each observation, standard extraction methods; the reader is referred to e.g., Markowitz et al. (2003) for details on light curve extraction and to Edelson & Nandra (1999) for details regarding on PCA background subtraction. (Figure 7; see also Summons et al., in prep.).
To explore long-term variability of the spectral components in a model-dependent fashion, we tried to apply our best-fit Suzaku model to the 0.2–12 keV 2002 XMM-Newton pn spectrum, while allowing as few parameters as possible to change between models to both spectra. As per Section 3.2, we allowed the Fe K line energy centroid, width, and intensity to vary, and we added a narrow Gaussian component to model Fe XXVI line emission. We modeled the warm absorber using the same xstar table model as for the Suzaku spectrum.
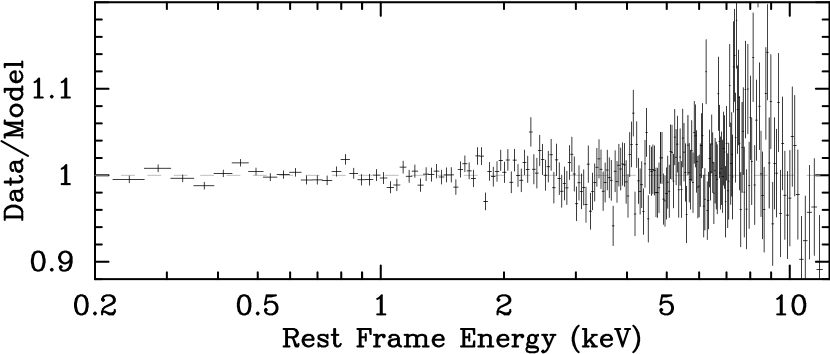
We found that, in order to achieve a good fit and good data/model residuals (, it was necessary and sufficient to thaw the power-law normalization, power-law photon-index, bremsstrahlung normalization and temperature, Fe L3 edge depth , and warm absorber column density . Best-fit values for these parameters are listed in Table 3, alongside the corresponding values from the Suzaku fit. All other parameters were kept frozen at the values listed in Table 2. The best-fit model had =1793.2/1756; data/model residuals are plotted in Fig. 8. We found that it was not necessary to include in the model a second, lower-ionization warm absorber along the line of sight.
As reported by B07, the total absorbed 0.5–10 keV flux during the 2002 XMM-Newton observation was erg cm-2 s-1, a factor of 4.7 higher than the total absorbed 0.5–10 keV flux during the 2007 Suzaku observation. However, the broadband spectral changes between the two spectra cannot be explained solely by changes in power-law normalization and photon index; the best-fit model to the pn spectrum in this case had and unacceptable data/model residuals, particularly below 2 keV. Our model fits indicate that the difference in between the two observations is not highly statistically significant, as the column densities are consistent at the confidence level. (The variation in is not likely real, either; there is some mild degeneracy between and , and the values of are consistent at the 99 confidence level (). If this component is associated with dust in the host galaxy along the line of sight at least several pc from the black hole, then we would not expect any temporal variation in .) Evolution in the normalization of the soft excess must contribute to the change in soft X-ray flux between the two observations. For comparison purposes, we now focus on the 0.4–2.0 keV unabsorbed flux, , of this component.
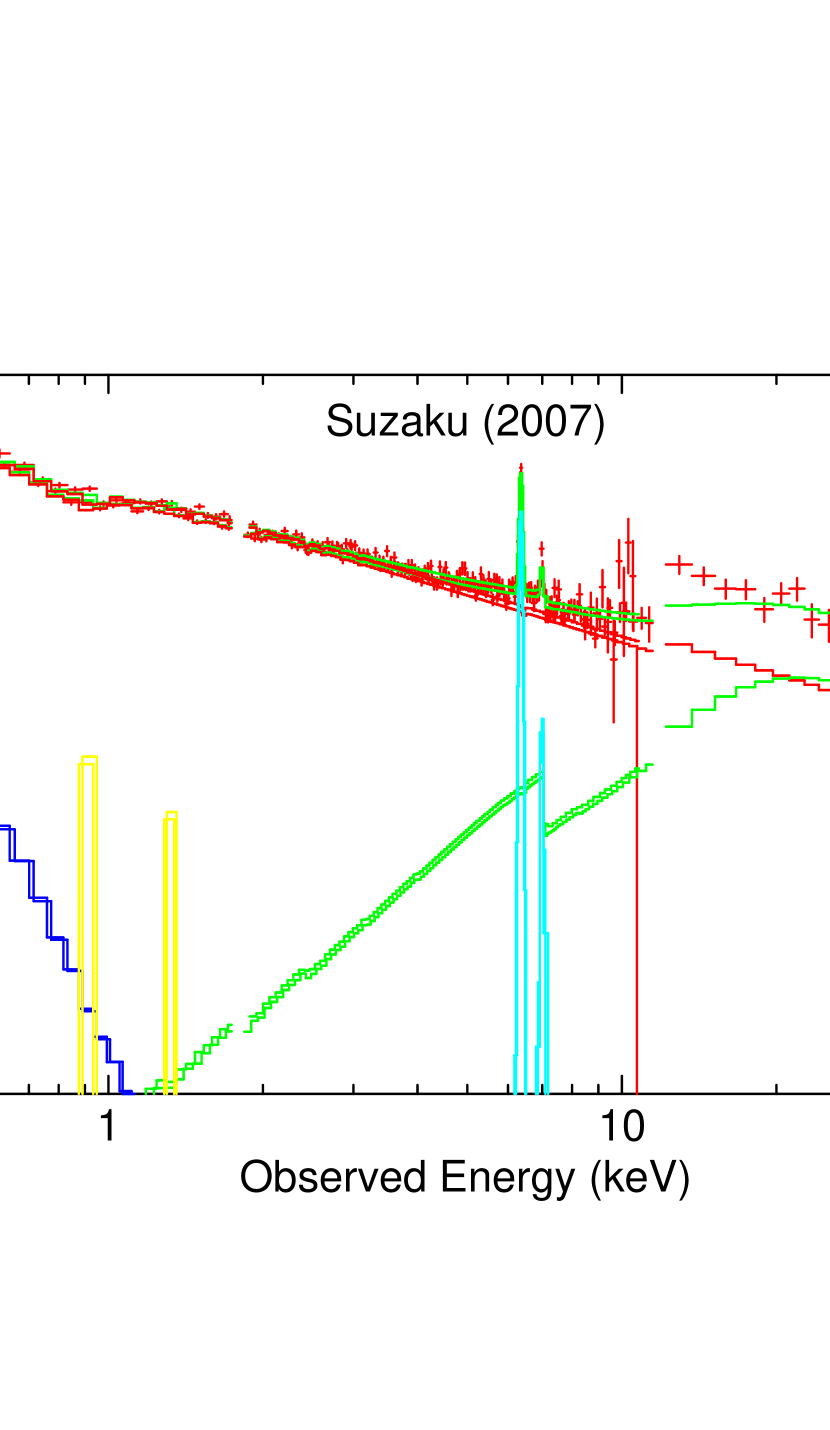
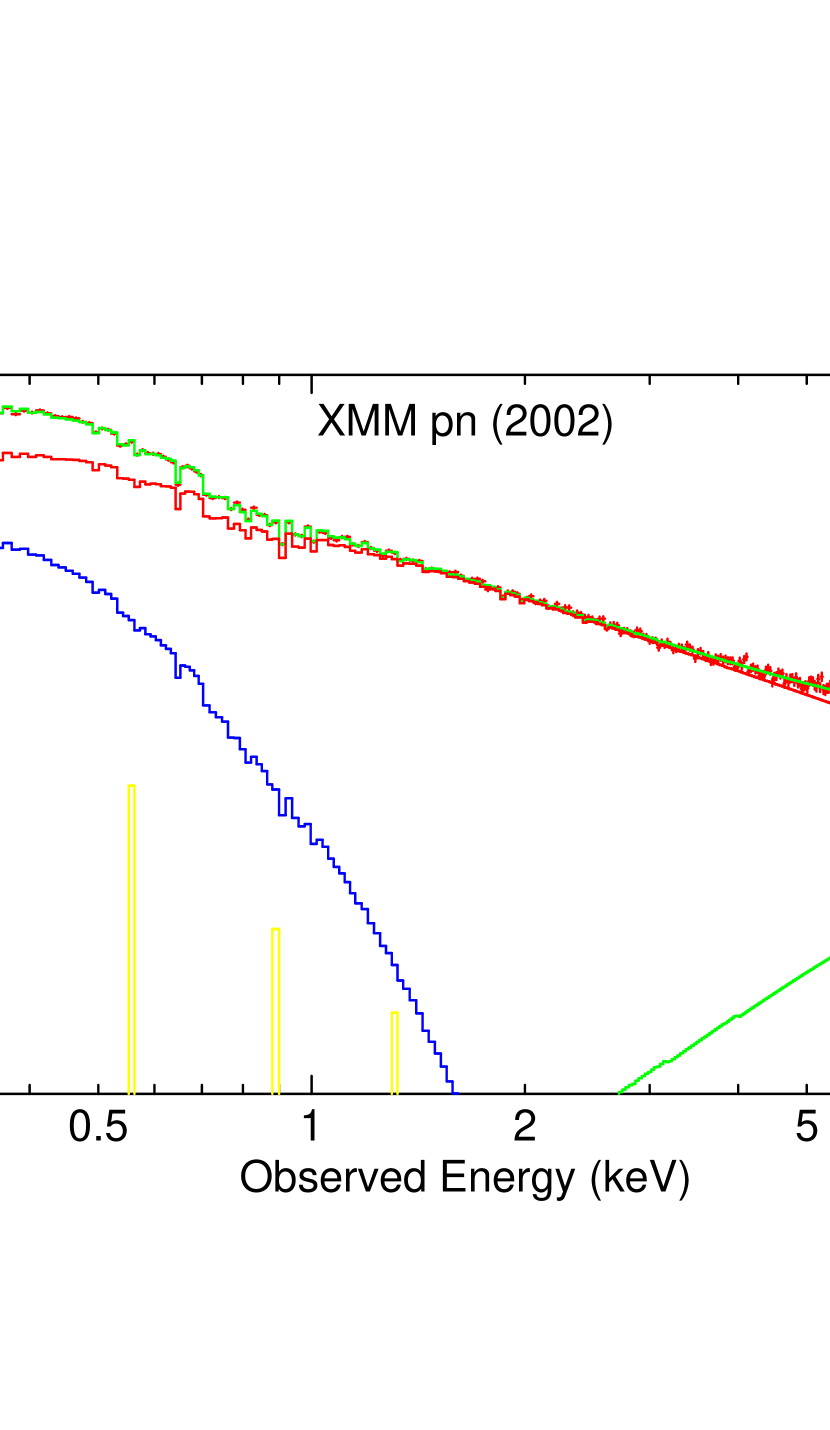
The normalization of the soft excess in the Suzaku spectrum is not well constrained due to its faintness. Assuming thermal bremsstrahlung emission, we find erg cm-2 s-1 for this component in the Suzaku spectrum (uncertainties are based on the error on the normalization of this component). The value of of this component in the pn spectrum was erg cm-2 s-1. We conclude that, in the context of modeling the soft excess as thermal bremsstrahlung emission, the normalization has dropped by at least a factor of 20. Unfolded model spectra for our best-fit models to the pn and Suzaku spectra assuming thermal bremsstrahlung emission are shown in Figs. 9 and 10, respectively.
In the XMM-Newton spectrum, we substituted the thermal bremsstrahlung component with a thermal Comptonization component, again using COMPTT, and keeping the geometry parameter, input soft photon temperature, and plasma temperature fixed at the best-fit values found for the Suzaku spectrum; only the optical depth and normalization were allowed to vary. This yielded a similar good fit, with = 1922.6/1755; best-fit values for the free parameters are listed in Table 3. of the Comptonization component was erg cm-2 s-1 (flux uncertainty is from the uncertainty on the normalization of this component). This flux is a factor of at least 20 higher than the corresponding flux from the best-fit Suzaku model, erg cm-2 s-1.
5. Discussion and Conclusions
5.1. Summary of Observational Results
We have presented results from a Suzaku observation of the nucleus of the Seyfert AGN NGC 4593 in 2007 December, and we compare our spectral fits for both the Fe K bandpass and the broadband X-ray spectrum with those obtained from a 2002 XMM-Newton EPIC-pn observation. Suzaku caught the source at a relatively low X-ray flux level: the 2–10 keV continuum flux during the Suzaku observation was a factor of 3.8 lower.
The Fe K line intensity has dropped by a factor of 1.7, suggesting that roughly half of the total line flux has responded to the drop in continuum flux. One of our main results is that the Fe K line is significantly more narrow in the Suzaku observation. Modeling the line as a single Gaussian, we find that the width has dropped from eV in 2002 to eV in 2007. We also modeled the line using a dual-Gaussian model composed of relatively narrow and broad lines. The former dominates the Suzaku profile and is assumed to be time-invariant; in the XMM-Newton spectrum, both lines are modeled to have roughly equal intensity and the broad component has a width eV. There is highly tentative evidence for the Fe XXVI emission line at 6.96 keV to have dropped in intensity from 2002 to 2007, assuming an intrinsically narrow (unresolved) line: in the Suzaku observation, the line is not significantly detected ( eV).
In our broadband fits to the 0.3–76 keV spectrum, the primary power-law component, commonly attributed to inverse Comptonization of soft seed photons in a hot corona (e.g., Haardt et al. 1994), was relatively flat, with near 1.65. The Compton reflection component had a relative strength . We also model a modest soft excess using both thermal bremsstrahlung emission and thermal Comptonization of soft seed photons, similar to B07, and we obtain similar results. Importantly, we find the soft excess has dropped in flux by a factor of at least 20 between the XMM-Newton and Suzaku observations. We model one zone of absorption along the line of sight, the previously seen highly-ionized (log 2.5) zone, with a column density similar to that obtained by McKernan et al. (2003) and Steenbrugge et al. (2003). There is no strong evidence for evolution of the warm absorber between the two observations. A relativistically broadened Fe K line was not detected in the Suzaku spectrum; Reynolds et al. (2004) demonstrated a similar result in the XMM-Newton spectrum.
5.2. Tracing the Truncated Disk with the Fe K Line
We explore two (model-dependent) scenarios to correlate the changes in Fe line intensity and profile with the observed drop in continuum flux. In the model where a single Gaussian was used to describe the Fe K profile, the width in the 2007 Suzaku observation was eV, which corresponds to a FWHM velocity of km s-1. This is roughly commensurate with the optical broad emission line width: Peterson et al. (2004) reported FWHM H and H line widths of and km s-1, respectively.777Peterson et al. (2004) reported that the continuum-line lag results were poor. The H lag was reported as lt-days but Peterson et al. (2004) recommended caution. The H lag was reportedly “completely unreliable.” Assuming that the line originates in gas that is in virialized orbit around the black hole, we can estimate the distance from the black hole to the line-emitting gas. Assuming that the velocity dispersion is related to as = (Netzer 1990), we use = . We use a black hole mass of , an estimate based on the relation between and stellar velocity dispersion in Seyferts (Nelson et al. 2004). The best-fit reverberation mapping estimate from Peterson et al. (2004), , is consistent with this estimate.
We find = m, or lt-days. As 1 corresponds to m for the black hole mass used, = . We cannot of course rule out contribution from an even more narrow Gaussian component originating in even more distant material. In the 2002 XMM-Newton observation, the corresponding measured line width (we use our best-fit value of eV) corresponds to a value of = m = lt-days, or (see also B07). B07 also used the lack of observed variability in the Fe line flux during the XMM-Newton observation to constrain the light-crossing time for the line-emitting gas to be at least 2000 .
One possible explanation to explain the change in Fe K line profile, insofar as it traces the geometrically thin, radiatively efficient disk, is that the innermost radius of the thin disk has increased over 5 years. A common model for accretion flows incorporating truncated thin disks is one where the thin disk transitions to an inner RIAF as the flow crosses a certain transition radius (Esin et al. 1997); a commonly invoked type of RIAF is an advected-dominated accretion flow (ADAF), wherein the disk is optically thin and geometrically thick (e.g., Narayan & Yi 1995). The largest width observed for the Fe K line thus could indicate . In this model, is expected to increase, and more of the inner thin disk evaporates, as the accretion rate relative to Eddington, , decreases in a given object. Supporting evidence for this comes from timing observations of black hole X-ray Binary systems during outburst decay: characteristic temporal frequencies in the power spectral density function (PSD), such as peaks of Lorentzian components and/or quasi-periodic oscillations, migrate towards lower temporal frequencies as decreases and the source luminosity fades, as the source evolves through the low/hard spectral state into quiescence (e.g., Axelsson et al. 2005, Belloni et al. 2005). In addition, the temperature and flux of the soft, thermally emitted component have been seen to decrease with in many sources (e.g., Gierliński, Done & Page 2008).
However, the predicted relationship between and remains unclear. Yuan & Narayan (2004) empirically derive that compact sources accreting at near , , and may be associated with values of near , , and , respectively. Assuming a 2–10 keV flux in 2002 of erg cm-2 s-1 from RXTE-PCA monitoring, a luminosity distance of 41.3 Mpc (following Mould et al. 2000, and using = 70 km s-1 Mpc-1 and = 0.73), the 2–10 keV luminosity erg s-1. From Marconi et al. (2004), an AGN with this has a bolometric luminosity erg s-1. The accretion relative to Eddington = is thus estimated to be 0.15 for the 2002 XMM-Newton observation. during the Suzaku observation is thus 0.04. Meanwhile, Lu & Wang (2000) have derived from SED fitting. These values of and our derived value of are not immediately consistent with the rough relation of Yuan & Narayan (2004), thus pointing toward models incorporating smaller values of (see below). Furthermore, most low- sources are radio loud, but NGC 4593 is not strongly radio-loud. Its 5 GHz flux has been measured to near 2 mJy (e.g., Schmitt et al. 2001), and its B-band flux is 6–16 mJy (e.g., McAlary et al. 1983), so the radio loudness parameter, defined as the ratio of these two values, is 3. Values 10 define a source as radio-loud (Kellermann et al. 1989). A connection between (proportional to the observed X-ray flux) and in NGC 4593 is thus qualitative only as well as speculative, especially since we have only two model-dependent estimates of .
There is also the question of whether the inner portions of a thin disk in AGN can evaporate and/or become radiatively inefficient on timescales of only a few years. As the accretion disks of BH XRBs are thought to evolve on timescales of at least hours to days, the corresponding timescales in NGC 4593 (black hole mass a factor of higher) would be decades to centuries. On the other hand, Marscher et al. (2002) interpreted rapid (duration of a couple weeks) dips in the X-ray light curve of the radio-loud Seyfert 3C 120 as periods when the inner portion of the disk evaporated, each event leading to ejection of material into the relativistic jet and a corresponding radio flare about a month later.
The total Fe K line intensity decreased from (2002) to (2007) ph cm-2 s-1, a factor of 1.7, while the observed 4–10 keV flux decreased from (2002) to (2007) erg cm-2 s-1, a factor of 3.6, i.e., roughly half of the total line flux has responded to continuum decrease. Modeling the Fe K line with a dual-Gaussian model attempted to separate the variable and non-variable emission components; in this model, a non-variable, narrow component is detected in both observations, and dominates the total line flux in the Suzaku spectrum, while a broader component is detected only in the XMM-Newton spectrum. The best-fit width of the broad line was eV, corresponding to FWHM velocity of km s-1, implying m = lt-days, or . This estimate is inconsistent with B07’s estimate of 2000 based on the invariance of the Fe K line during the XMM-Newton observation, but it is still consistent with the presence of a truncated thin disk (). could be invariant from 2002 to 2007, but an annular region on the thin disk spanning from to 1000–5000 (outer radius obviously speculative) could be responding to the drop in illuminating continuum flux. If the drop in Fe XXVI flux is real, then that line could also originate in this region. However, it is not clear in this model why material at (yielding the narrow line component), contributing roughly half of the total line intensity in 2002, has not responded to the drop in continuum flux, as it is well within a week’s light-travel time. The width of the narrow line had been fixed at eV in our modeling of the XMM-Newton profile, but contributions from a more narrow component likely cannot be ruled out. Such distant material could be responding to a previous higher continuum flux. The 2–10 keV RXTE-PCA monitoring light curve in fact showed a higher, more average flux level until roughly 300 days before the Suzaku observation (Figure 7).
A final possibility that does not require evolution in is that the inner disk may have become be too ionized to transmit an Fe line. In the context of models with a hot, ionized skin (Nayakshin, Kazanas & Kallman 2000), a disk illuminated by a power-law continuum with a photon index near 1.6, similar to that in the Suzaku observation, yields extremely weak Fe line emission.
Of course, both profile models are likely oversimplifications. The community could thus benefit from an X-ray observatory with few eV resolution combined with a large effective area near 6 keV to resolve the various components of the Fe K core as a function of time and/or continuum flux level, if multiple components do indeed exist, as well as resolve the Fe XXVI line.
5.3. The Compton Reflection Component
A Compton shoulder was not significantly detected in either the Suzaku or XMM-Newton spectra; we find upper limits to Compton shoulder emission (first-scattering) of 23 of the core. It is thus not obvious from this limit alone whether bulk of the Fe K line originates in Compton-thick material, especially the degree to which the strength of the Compton shoulder depends on the geometry of the material. However, no relativistically broadened Fe K line has been confirmed in NGC 4593, but we confirm from the broadband Suzaku spectrum the presence of a Compton reflection hump which thus must correspond to (at least some fraction of) the Fe K core emission. We can investigate if the measured strength of the Compton reflection hump, (statistical uncertainty only; 0.35 including the systematic uncertainty), can correspond to the observed Fe K line of 25519 eV. Following George & Fabian (1991), one expects an of 135 eV (using the abundances of Lodders 2003) to correspond to = 1 for an semi-infinite optically thick slab illuminated by a power-law continuum with = 1.7 and assuming solar abundances and an inclination angle of 30 relative to the observer’s line of sight. The observed values of and are thus consistent if the Fe abundance relative to solar, , is about 1.7, which is not unreasonable. For a truncated disk, this could be explained by having the Comptonizing corona consist of numerous flares lying in a sandwich-like geometry just above/below the thin disk (e.g., Haardt et al. 1994), such that the disk spans 2 sr of the sky as seen by each X-ray flare. However, very distant (pc-scale), Compton-thick material lying out of the line of sight, which cannot be ruled out as contributing to the observed Fe K emission profile, could also contribute to the total Compton reflection strength.
However, if the thin disk is truncated, then a semi-infinite slab may not be an appropriate geometry, especially if the central X-ray source is not immediately close to the reflecting disk. The of a truncated disk will be lower, but will depend on the location of the illuminating X-ray source. If we assume that the illuminating X-ray source is located on the disk symmetry axis a height above the disk, we can use the to constrain . George & Fabian (1991, their Fig. 15) demonstrate that the reflected flux is dominated by the region of the disk with 1–2. For a truncated thin disk with = several thousand , must also be several thousand above the black hole. A configuration in which the X-ray corona is associated with the base of a jet along the symmetry axis may thus be applicable, e.g., Markoff, Nowak & Wilms (2005). NGC 4593, like many Seyferts, is known to host a pc-scale radio component (size of 15 pc; Schmitt et al. 2001).
5.4. Spectral Variability of the Broadband Components
The primary-law component in Seyfert X-ray spectra is usually attributed to inverse Comptonization of soft seed photons. In an ADAF flow, thermal Comptonization is expected to dominate the X-ray emission unless the accretion rate is extremely low, in which case thermal bremsstrahlung emission dominates the X-ray spectrum (Narayan et al. 1998, Narayan 2005). One of our main results is that while the primary power-law component has dropped in flux by a factor of almost 4, the soft excess has dropped in flux by a factor of 20 between 2002 and 2007, ruling out an origin for the soft excess with a size greater than 5 lt-years. This drop is likely linked to the decrease in the primary X-ray power-law, i.e., it may be either a cause of an effect of it.
We explored two phenomenological models for the soft excess, bremsstrahlung and thermal Comptonization. In the presence of an ADAF flow, one can expect thermal bremsstrahlung emission with a temperature of K (Narayan & Yi 1995), but such temperatures are higher by over 2 orders of magnitude compared to the temperature derived from our model fits and by B07. We also modeled the soft excess as inverse Comptonization of soft seed photons with an assumed input temperature of 50 eV by an optically thin corona with a temperature keV, again obtaining similar results to B07. The location of such a process is not clear, though it could occur in the ionized skin of the thin disk (e.g., Magdziarz et al. 1998, Janiuk et al. 2001), or at the base of an outflowing jet. If both the soft excess and hard X-ray power-law components originate via Comptonization of disk seed photons, a decrease in the intensity of those soft seed photons (e.g., from an increase in ) between 2002 and 2007 could yield a correlated drop in both component’s flux. Another possibility is that the optical depth of the Comptonizing components may have changed.
References
- (1) Axelsson, M., Borgonovo, L. & Larsson, S. 2005, A&A, 438, 999
- (2) Belloni, T., Homan, J., Casella, P., et al., 2005, A&A, 440, 207
- (3) Brenneman, L.W., Reynolds, C.S., Wilms, J. & Kaiser, M.E. 2007, ApJ, 666, 817 (B07)
- (4) Edelson, R. & Nandra, K. 1999, ApJ, 514, 682
- (5) Esin, A.A., McClintock, J.E. & Narayan, R. 1997, ApJ, 489, 865
- (6) Fabian, A.C., Rees, M.J., Stella, L. & White, N.E. 1989, MNRAS, 238, 729
- (7) Fabian, A.C., Vaughan, S., Nandra, K., et al. 2002, MNRAS, 335, L1
- (8) Fukazawa, Y., Mizuno, T., Watanabe, S., et al., 2009, PASJ, 61S, 17
- (9) Gehrels, N. 1986, ApJ, 303, 336
- (10) George, I.M. & Fabian, A.C. 1991, MNRAS, 249, 352
- (11) Gierliński, M., Done, C. & Page, K. 2008, MNRAS, 388, 753
- (12) Gruber, D.E., Matteson, J.L., Peterson, L.E. & Jung, G.V. 1999, ApJ, 520, 124
- (13) Guainazzi, M., Perola, G.C., Matt., G., et al. 1999, A&A, 346, 607
- (14) Haardt, F., Maraschi, L. & Ghisellini, G. 1994, ApJ, 432, L95
- (15) Ishisaki, Y., Maeda, Y., Fujimoto, R., et al. 2007, PASJ, 59S, 113
- (16) Janiuk A., Czerny B. & Madejski, G.M., 2001, ApJ, 557, 408
- (17) Kalberla, P.M.W. et al. 2005, A&A, 440, 775
- (18) Kellermann, K. I., Sramek, R., Schmidt, M., Shaffer, D. B., & Green, R. 1989, ApJ, 98, 1195
- (19) Kokubun, M., Makishima, K., Takahashi, T., Murakami, T., Tashiro, M., Fukazawa, Y., Kamae, T., Madejski, G.M. et al. 2007, PASJ, 59S, 53
- (20) Koyama, K., Tsunemi, H., Dotani, T., Bautz, M., Hayashida, K., Tsuru, T., Matsumoto, H., Ogawara, Y. et al. 2007, PASJ, 59S, 23
- (21) Laor, A. 1991, ApJ, 376, 90
- (22) Lodders, K. 2003, ApJ, 591, 1220
- (23) Lu, Y. & Wang, T. 2000, ApJ, 537, L103
- (24) Maeda, Y., Someya, K., Ishida, M., et al., 2008, JX-ISAS-SUZAKU-MEMO-2008-06
- (25) Magdziarz, P., Blaes, O.M., Zdziarski, A.A., Johnson, W.N. & Smith D.A. 1998, MNRAS, 301, 179
- (26) Magdziarz, P. & Zdziarski, A.A. 1995, MNRAS, 273, 837
- (27) Marconi, A. et al. 2004, MNRAS, 351, 169
- (28) Markoff, S., Nowak, M.A. & Wilms, J. 2005, ApJ, 635, 1208
- (29) Markowitz, A., Edelson, R., Vaughan, S., et al. 2003, ApJ, 593, 96
- (30) Marscher, A.P., Jorstad, S.G., Gómez, J.-L., et al., 2002, Nature, 417, 625
- (31) Matt, G. 2002, MNRAS, 337, 147
- (32) McAlary, C.W., McLaren, R.A., McGonegal, R.J., Maza, J., 1983, ApJS, 52, 341
- (33) McKernan, B., Yaqoob, T., George, I.M. & Turner, T.J. 2003, ApJ, 593, 142
- (34) Mitsuda, K., Bautz, M., Inoue, H., Kelley, R., Koyama, K., Kunieda, H., Makishima, K., Ogawara, Y. et al. 2007, PASJ, 59S, 1
- (35) Mould, J.R., Huchra, J.P., Freedman, W.L., et al. 2000, ApJ, 529, 786
- (36) Murphy, K.D. & Yaqoob, T. 2009, MNRAS, 397, 1549
- (37) Nandra, K. 2006, MNRAS, 368, L62
- (38) Narayan, R. 2005, Ap&SS, 300, 177
- (39) Narayan, R., Mahadevan, R., & Quataert, E. 1998, in Theory of Black Hole Accretion Disks, ed. M. A. Abramowicz, G. Bjornsson, & J. E. Pringle (Cambridge: Cambridge Univ. Press), 148
- (40) Narayan, R. & Yi, I. 1995, ApJ, 452, 710
- (41) Nayakshin, S., Kazanas, D. & Kallman, T.R. 2000, ApJ, 537, 833
- (42) Nelson, C.H., Green, R.F., Bower, G., Gebhardt, K. & Weistrop, D. 2004, ApJ, 615, 652
- (43) Netzer, H. 1990, in Active Galactic Nuclei, ed. T. J.-L. Courvoisier and M. Major (Berlin: Springer), 57
- (44) Peterson, B.M., Ferrarese, L., Gilbert, K.M., et al. 2004, ApJ, 613, 682
- (45) Porquet, D., Reeves, J.N., Uttley, P. & Turner, T.J. 2004, A&A, 427, 101
- (46) Pounds, K.A. & Turner, T.J. 1988, MmSAI, 59, 261
- (47) Protassov, R., van Dyk, D.A., Connors, A., Kashyap, V.L. & Siemiginowska, A. 2002, ApJ, 571, 545
- (48) Quataert, E. 2001, in Probing the Physics of Active Galactic Nuclei, Peterson, B.M., Pogge, R.W., & Polidan, R.S. eds., ASP Conf. Proceedings, Vol. 224, p. 71
- (49) Reeves, J.N., Nandra, K., George, I.M., Pounds, K.A., Turner, T.J. & Yaqoob, T. 2004, ApJ, 602, 648
- (50) Reynolds, C.S., et al. 2004, MNRAS, 352, 205
- (51) Ross, R.R. & Fabian, A.C., 2005, MNRAS, 358, 211
- (52) Schmitt, H.R., Ulvestad, J.S., Antonucci, R.R.J. & Kinney, A.L. 2001, ApJS, 132, 199
- (53) Shakura, N.I. & Sunyaev, R.A. 1973, A&A, 24, 337
- (54) Steenbrugge, K., Kaastra, J.S., Blustin, A.J., et al. 2003, A&A, 408, 921
- (55) Strauss, M.A., Huchra, J.P., Davis, M., Yahil, A., Fisher, K.B. & Tonry, J. 1992, ApJS, 83, 29
- (56) Sun, W.-H. & Malkan, M.A. 1989, ApJ, 346, 68
- (57) Takahashi, T., Abe, K., Endo, M., Endo, Y., Ezoe, Y., Fukazawa, Y., Hamaya, M., Hirakuri, S. et al. 2007, PASJ, 59S, 35
- (58) Titarchuk, L. 1994, ApJ 434, 570
- (59) Turner, T.J., Kraemer, S.B., George, I.M., Reeves, J.N., Bottorff, M.C. 2005, ApJ, 618, 155
- (60) Vaughan, S., Edelson, R., Warwick, R. & Uttley, P. 2003, MNRAS, 345, 1271
- (61) Watanabe, S. et al. 2003, ApJ, 597, L37
- (62) White, N.E., Giommi. P. & Angelini, L. 2000 VizieR On-line Data Catalog, 9031, 0
- (63) Yaqoob, T. & Padmanabhan, U. 2004, ApJ, 604, 63
- (64) Yuan, F. & Narayan, R. 2004, ApJ, 612, 724
In this Appendix, we discuss the X-ray spectrum of 1WGA J1239.7–0526, an X-ray source located about 5 south of NGC 4593, at = 12h39m42.8s, = –5d26m15s (J2000.0 coordinates from the NASA Extragalactic Database), and in the Suzaku-XIS field of view during the observation of NGC 4593. Detection of this source in X-rays was first reported by ROSAT-PSPC (White, Giommi & Angelini 2000). Its Galactic latitude is +57, so it is likely not Galactic in nature. Its redshift is unknown. As this source is also in the field of view of the (non-imaging) HXD-PIN observation of NGC 4593, we extracted spectra of 1WGA J1239.7–0526 from the XIS to estimate the level of contamination in the HXD-PIN spectrum of NGC 4593.
Spectra were extracted in a manner similar to Section 2.1. ARFs were generated considering the source’s position 5 off-axis. Spectra were grouped to a minimum of 20 ct bin-1.
We fit the co-added 0.4–11 keV XIS-FI and 0.3–9 keV XIS-BI spectra in XSPEC with a model consisting of a simple power-law, with absorption by the Galactic column (1.88 1020 cm-2, Kalberla et al. 2005). This model yields a good fit with excellent data/model residuals, with = 369.0/378 for and a power-law normalization of ph cm-2 s-1 keV-1 at 1 keV. Absorbed fluxes for the 0.4–2 and 2–10 keV bands are and erg cm-2 s-1, respectively. Background fluxes were 0.31 (FI) and 0.53 (BI) times the modeled source flux in the 0.4–2.0 keV band, and 0.58 (FI) and 2.2 (BI) the modeled source flux in the 2–10 keV band.
Extrapolating this model to the HXD-PIN band yields a 12–76 keV flux estimate of erg cm-2 s-1, or about 1.5% of the net source flux of NGC 4593 in the 12-76 keV band. However, the HXD aimpoint is about 4 away from 1WGA J1239.7–0526; at this angular distance, the PIN effective area is about 90 of that on-axis; 1WGA J1239.7–0526 thus contributes only 1.35% of the net count rate of NGC 4593 in the PIN.
To test for the presence of variability in 1WGA J1239.7–0526, we extracted light curves from each XIS, binned them to 34560 s (6 satellite orbits), and added light curves from all three XISes. In the 0.4–2.0 keV band, an upper limit to of 15.2 is found. In the 2–10 keV band, we measured the variability amplitude .
| 2007 Suzaku | 2002 XMM-Newton | ||
|---|---|---|---|
| Component | Parameter | XIS-FI value | EPIC-pn value |
| 320.6/318 | 1105.0/1091 | ||
| Model Flux | 4–10 keV flux (erg cm-2 s-1) | ||
| Power-law | |||
| Compton Reflection | 1.08 (fixed) | 1.08 (fixed) | |
| Fe K emission line | Energy (keV) | 6.4120.007 | 6.396 0.012 |
| Width (eV) | 87 17 | ||
| Intensity (ph cm-2 s-1) | |||
| (eV) | 25519 | 114 11 | |
| Fe XXV emission | Energy (keV) | 6.70 (fixed) | 6.70 (fixed) |
| Width (eV) | 1 (fixed) | 1 (fixed) | |
| Intensity (ph cm-2 s-1) | |||
| (eV) | |||
| Fe XXVI emission line | Energy (keV) | 6.96 (fixed) | 6.96 (fixed) |
| Width (eV) | 1 (fixed) | 1 (fixed) | |
| Intensity (ph cm-2 s-1) | |||
| (eV) | 17 | 12 8 | |
| -test significance | N/A | 92 (97.5) | |
| Compton Shoulder emission | Intensity (ph cm-2 s-1) | ||
| (eV) | 44 |
Note. — Results are shown for the respective best-fit models for the 4–11.5 keV 2007 Suzaku XIS-FI spectrum and for the 4–11.5 keV 2002 XMM-Newton pn spectrum in which the Fe K line is modeled as a single Gaussian. In each case, the best-fit model consists of a power-law component, a Compton reflection component (pexrav), and emission lines due to Fe I K and Fe I K; a Fe XXVI emission line was included in the fit to the XMM-Newton pn data. In the Suzaku data, the Fe K line energy has been corrected to account for the gain shift of +9 eV as measured using the 55Fe calibration source spectra. The row labelled “-test significance” denotes the confidence level associated with including this component in the model according to an -test (omitted where line intensity is an upper limit only); values in parentheses denote statistical significance derived from Monte Carlo simulations (see Section 3 for details).
| Component | Parameter | Value |
|---|---|---|
| 1254.5/1106 | ||
| Model Flux | 2–10 keV flux (erg cm-2 s-1) | |
| Power-law | ||
| Norm. at 1 keV (ph cm-2 s-1 keV-1) | ||
| Warm Absorber | Column density (cm-2) | |
| log() (erg cm s-1) | 2.39 0.17 | |
| Compton Reflection | Refl. strength | 1.08 0.20 |
| Bremss. Component | (keV) | |
| Norm. | ||
| Unabsorbed (absorbed) | () | |
| Fe L3 Edge | Energy (keV) | 0.707 (fixed) |
| -test significance | 99.7 (96.4) | |
| O VII Emission Line | Energy (keV) | 0.561 (fixed) |
| Intensity (ph cm-2 s-1) | ||
| (eV) | ||
| -test significance | 90 (84) | |
| Ne IX Emission Line | Energy (keV) | 0.905 (fixed) |
| Intensity (ph cm-2 s-1) | ||
| (eV) | ||
| -test significance | 98.4 (95) | |
| Mg XI Emission Line | Energy (keV) | 1.331 (fixed) |
| Intensity (ph cm-2 s-1) | ||
| (eV) | ||
| -test significance | 98.9 (94) | |
| XIS-BI/XIS-FI | Norm. |
Note. — Best-fit model parameters for the Suzaku broadband fit with the soft excess modeled as thermal bremsstrahlung emission. See the xspec user manual for the units of the bremsstrahlung normalization. The rows labeled “-test significance” denote the confidence level associated with including this component in the model according to an -test; values in parentheses denote statistical significance derived from Monte Carlo simulations (see Section 3 for details). The uncertainty on is statistical only; the systematic uncertainty is an additional 0.15.
| 2002 XMM-Newton | 2007 Suzaku | ||
|---|---|---|---|
| Component | Parameter | EPIC-pn value | value |
| Thermal Bremsstrahlung model | |||
| 1793.23/1756 | 1254.8/1105 | ||
| (Absorbed) Model Flux | 2–10 keV flux (erg cm-2 s-1) | ||
| 0.5–2.0 keV flux (erg cm-2 s-1) | |||
| Power-law | 1.9010.006 | ||
| Norm. at 1 keV (ph cm-2 s-1 keV-1) | |||
| Warm Absorber | Column density (cm-2) | ||
| Fe L3 edge | Optical depth | ||
| Bremss. Component | (keV) | 0.28 0.01 | |
| Norm. | |||
| Unabsorbed (absorbed) | () | () | |
| Thermal Comptonization model | |||
| 1945.8/1757 | 1255.775 / 1105 | ||
| (Absorbed) Model Flux | 0.5–2.0 keV flux (erg cm-2 s-1) | ||
| Power-law | |||
| Norm. at 1 keV (ph cm-2 s-1 keV-1) | |||
| Warm Absorber | Column density (cm-2) | ||
| Fe L3 edge | Optical depth | 0.080.04 | |
| Comptonized Component | Temperature (eV) | 53 (fixed) | |
| Optical depth | 0.28 | ||
| Norm. | |||
| Unabsorbed (absorbed) | () | () | |
Note. — Results from applying the best-fit broadband models from the Suzaku observation to the 0.2–12 keV XMM-Newton pn spectrum, using thermal bremsstrahlung or thermal Comptonization components to model the soft excess. Col. (2) lists the parameters which were allowed to vary from their values in the Suzaku fit; the values for the XMM-Newton fits are listed in Col. (3). The corresponding values from the Suzaku fits are listed in Col. (4). See Table 2 for other model parameters for the thermal bremsstrahlung fit. Model fluxes are in units of erg cm-2 s-1. See the xspec user manual for the units of the Comptonized component.