e-mail sjulian@physics.utoronto.ca, Phone: +01-416-978-8188, Fax: +01-416-978-2357
2 H.H. Wills Physics Laboratory, University of Bristol, Bristol, BS8 1TL, United Kingdom
3 DRFMC, SPSMS, CEA Grenoble, 17 rue des Martyrs, 3805-4 Grenoble cedex 9, France
4 High Field Magnet Laboratory, Toernooiveld 7, 6525 ED Nijmegen, The Netherlands
XXXX
Observation of the J-sheet of the Fermi surface of YbRh2Si2
Abstract
We report a previously unobserved quantum oscillation frequency in . This is the first quantum oscillation that can definitely be assigned to the larger of the two major sheets of the Fermi surface predicted by band structure calculations. Previously observed frequencies were interpreted in terms of a ‘large’ Fermi surface, which includes the Yb 4-hole in the Fermi volume, that has been so strongly spin-split that it closely resembles the ‘small’ Fermi surface, which does not include the Yb 4-hole in the Fermi volume. The new frequency can also be incorporated into this picture, however there are some indications that the situation is more complicated than was assumed, suggesting a need for more advanced energy band calculations.
pacs:
1 Introduction
The circumstances in which the -electrons are, or are not, included in the volume of the Fermi surace is a central issue in heavy fermion physics in general, and in the theory of quantum criticality of heavy fermions in particular [1, 2]. Generally only the two extreme cases are considered to be permitted: either the Fermi suface is ‘large,’ in which case the f-electrons or f-holes are included in the Fermi volume, or it is ‘small,’ and they are not. A particularly elegant demonstration of a change of Fermi volume across a quantum critical point was found in CeRhIn5 under pressure [3], where de Haas-van Alphen oscillation measurements were used to measure the Fermi surface on either side of a pressure-induced quantum critical point separating antiferromagnetic and paramagnetic ground states.
YbRh2Si2 has played an important role in this discussion. Very modest magnetic fields are sufficient to suppress a weak antiferromagnetic state, producing a field-induced quantum critical point [4] or possibly a quantum critical phase [5]. A central feature of this quantum critical point is argued to be a change of the Fermi volume from small at low field to large at high field. The primary evidence for this comes from the Hall coefficient, in which a rapid change tends towards a discontinuous jump in the zero-temperature limit [6].
In principle, Fermi surface measurements can prove that such a Fermi surface transformation takes place. However, ARPES, which can only be done in zero field, cannot yet be carried out at sufficiently low temperatures, although it has yielded useful information at higher temperatures [7]. Quantum oscillation measurements such as the de Haas-van Alphen effect (dHvA), on the other hand, can be carried out at millikelvin temperatures, but require high magnetic fields. It would seem obvious that dHvA can at least verify that the FS is indeed large at high field, which would provide partial confirmation of the proposed scenario. However application of high magnetic fields to YbRh2Si2 has dramatic effects, producing a remarkable fall in the linear specific heat coefficient and in the coefficient of resisitivity, suggesting heavy fermion/Kondo physics is rapidly suppressed as the field increases from the quantum critical field up to 10 T; but above 10 T the suppression seems to be frozen part way, with still around [8, 9]. Additionally, between the QCP and 10 T the moment per Yb grows from zero to just above , but above 10 T this too becomes comparatively independent of applied field [8]. Within the ‘large’ Fermi surface scenario such a magnetization must arise from a substantial spin-splitting of the Fermi surface, whereas in the ‘small’ Fermi surface scenario it would come from polarization of local moments, which would themselves induce a small spin-splitting of the conduction bands such as is seen in the ferromagnetic system CeRu2Ge2 [11] or gadolinium [12]. The problem then arises of distinguishing between an extreme, spin-split version of the large Fermi surface and a spin-polarized version of the small, and this was addressed in our recent paper [13].
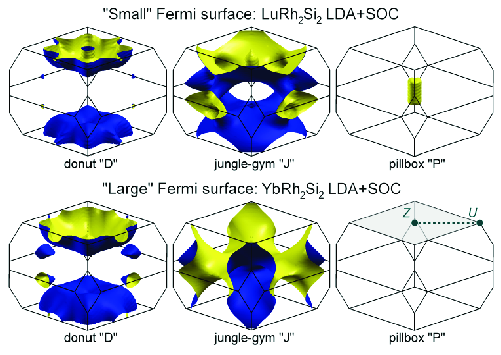
Quantum oscillation measurements map the Fermi surface via the Onsager relation, , which connects oscillation frequencies with extremal cross-sectional areas of Fermi surface [14]. In practice, it is necessary to compare the angle dependence of measured oscillation frequencies with the predictions of calculated band structures. In the case of YbRh2Si2 there are now a number of such calculations for both the large and small Fermi surfaces [7, 15, 16, 13, 10], and the Fermi surfaces shown in figure 1 are representative. Previous work [16, 13] found dHvA oscillation frequencies whose angle dependence matched neither the predicted large nor small Fermi surface exactly, but seemed closer to small, because some of the observed frequencies could be explained by orbits that pass through the ‘hole’ in the donut, or ‘D,’ surface, as described below. The D surface of the large Fermi surface does not have this hole (compare the the upper and lower surfaces on the left in figure 1). This was not interpreted as evidence that the Fermi surface of YbRh2Si2 is actually small at high field, which would directly contradict the quantum criticality scenario of reference [6]. Rather, an unusual field dependence of the dHvA frequencies below 11 tesla led us to propose that the apparent small Fermi surface was in fact a spin-polarized version of the large Fermi surface, which is produced when the magnetic polarization of the large Fermi surface is interrupted by a Lifshitz transition, after which the majority spin Fermi surface is trapped in the hybridization gap. Such a scenario has theoretical backing [17, 18], and was originally proposed for the metamagnetic transition of CeRu2Si2 [19].
A weakness of the previous dHvA studies is that all of the observed frequencies were assigned to the D sheet, and none to the J-sheet, which is certainly equally important thermodynamically. This left open the actual interpretation of the oscillation frequencies, and did not rigorously test the accuracy of band structure calculations. Here, we report further quantum oscillations studies, including the observation of a new, high frequency that we believe must originate on the J sheet of the Fermi surface.
2 Experiment
De Haas-van Alphen oscillations were measured using the standard field modulation technique [14]. The samples were mounted on a cryomagnetic system consisting of a dilution refrigerator with a base temperature below 20 mK and a 16/18 T superconducting magnet. The samples are platelets, grown from indium flux [16], with typical dimensions of 1 mm 2 mm 0.2 mm, which is somewhat smaller than optimal for these measurements. The main difference between the present measurements and those of reference [13] are a number of improvements in signal-to-noise ratio for these very weak signals, including the careful construction of pick-up coils that give the largest possible filling factor. The coils were placed in a rotation mechanism, and the field direction was varied in steps of about 2 degrees. In this paper we focus on measurements in the - plane, where the new high frequency was observed.
3 Results
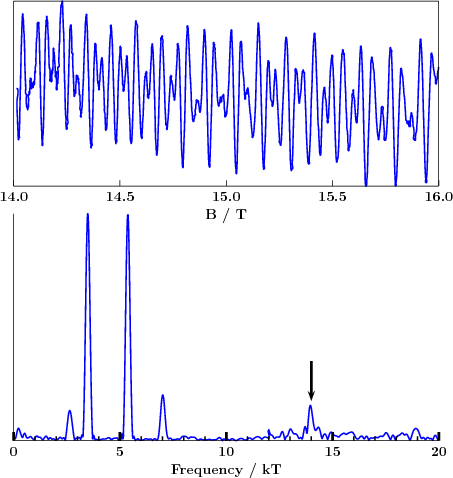
The upper plot in figure 2 shows a quantum oscillation trace between 14 and 16 T with the field along the (100) direction, while the lower trace shows the Fourier spectrum of this trace. In the Fourier spectrum the data above 12 kT have been multiplied by a factor of 10 to make the new peak, indicated by an arrow, more visible. Although the intensity of this signal is weak, it extends over an angular range of about 10 degrees, as seen in the right-hand panel of figure 3(c), which shows the angle dependence of observed frequencies in the - plane. It is necessary, in identifying this frequency as a new orbit, to exclude the possibility that it is the second harmonic of the peak that is seen at 7 kT in figure 2. For this reason it is important that we have carried out both mass studies, using the Lifshitz-Kosevich formula to obtain the quasiparticle mass from the temperature dependence of the oscillations [14], and that we have examined the angle dependence of the frequencies. The masses are given in table 1, but they are inconclusive, since the mass of the 14 kT peak is close to twice that of the 7 kT peak, as would be expected of a second harmonic. However, it is not unusual for masses to scale with frequency, as was found for example in UPt3 in the first detailed dHvA study of a heavy fermion metal [20], so this does not prove that the 14 kT oscillation is a harmonic of the 7 kT oscillation. Indeed, the angle dependence shows clearly that the ratio of two for these frequencies is a coincidence, because as we rotate the field away from the (100) direction the angle dependence is very different, and the ratio of the frequencies becomes different from two. We might similarly worry that the 7 kT is itself a second harmonic of the very strong 3.5 kT peak, however again the angle dependence does not support this in the sense that the 7 kT frequency extends over a much larger angular range than the 3.5 kT frequency, indeed, as discussed below, there are good reasons for expecting the frequencies on the ‘D’ sheet to come in pairs, as is the case with these two frequencies.
| (110) | (100) | |||
|---|---|---|---|---|
| 2.64 | ||||
| 3.48 | 3.22 | |||
| 5.37 | 5.65 | |||
| 7.01 | 6.15 | |||
| 6.54 | ||||
| 14.0 | ||||
4 Discussion
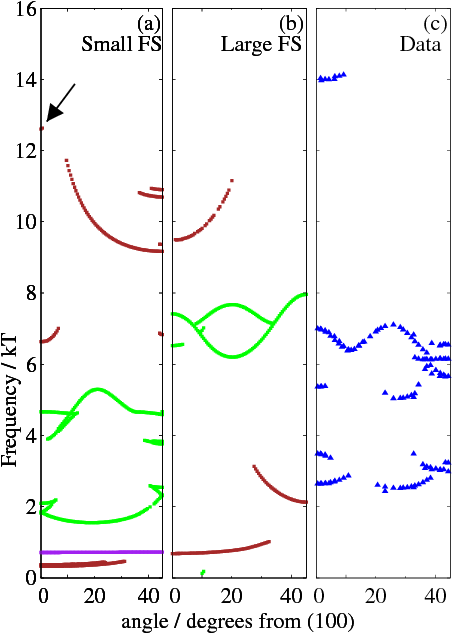
In figure 3(c) there are three groups of frequencies: one group between about 2.5 and 3.5 kT, a second between about 5 and 7 kT, and the lone high frequency near 14 kT close to the (100) axis. The two lowest groups had been observed before [16, 13], and the remarkable similarity in the angle dependence of frequencies in these two groups was noted, with roughly a factor of two between several of the frequencies, and some frequencies disappearing in one group and reappearing at twice (or one-half) the frequency in the other group. The interpretation of this behaviour is that both sets of orbits originate on the D surface, with the lower group arising from orbits that pass through the hole in the donut (see top-left figure in figure 1), while those in the upper group encircle the entire Fermi surface. This explains the factor of roughly two difference in frequency: they are almost the same orbit, but the lower set only go around half of the surface. Of course, as expected, there is not exact duplication, because the orbits that pass through the hole in the donut must be so-called ‘central’ orbits while those that do not go through the hole must be non-central. The two groups of frequencies are also seen in the predicted angle dependence of frequencies for the small D surface (green lines in figure 3(a)), but not for the ‘large’ Fermi surface, because the large D Fermi surface does not have a hole. This leads to the supposition that the Fermi surface must in this field range be closer in topology to the ‘small’ than to the ‘large’ Fermi surface.
The new branch at 14 kT, for tends to reinforce this interpretation, in the sense that the ‘small’ Fermi surface is predicted to give rise to a high frequency over a very limited range of angles near the (100) axis (indicated by the arrow in figure 3(a)). This is closer in frequency than a similar branch on the J surface of the large Fermi surface that starts near 9.5 kT and has a large angular range (see figure 3(b)). However, it is surprising, if the small Fermi surface is accurate, that the other predicted orbits from the J surface, extending from about 10 degrees over to the (110) axis, between 12 and 9 kT in figure 3(a), have not been observed. Although it is generally dangerous to conclude anything from failure to see a quantum oscillation, it seems likely that the required conditions of sample purity and temperature and field are being met. In this sense, the J surface of the large Fermi surface is in better agreement with the data, because it does not have any high frequencies near the (110) axis.
So the interpretation of this new frequency in terms of the large or small Fermi surfaces is ambiguous. However it is clear that the 14 kT frequency must originate on the J surface regardless of which model is used, as it is much larger than any predicted orbit on the D surface for either scenario.
We are currently investigating the angle dependence of quantum oscillations in the - and - planes, however our results have probably already reached the limit of what can be achieved by comparisons with the LDA calculated ‘small’ and ‘large’ Fermi surfaces. One possible approach will be to shift the Fermi levels in these calculations, to look for better agreement with our results, but there is probably a need for more advanced band-structure calculations, either employing dynamical mean-field theory [21] or using the renormalized band theory approach of Zwicknagl et al. [22].
5 Conclusions:
We have observed a new orbit in YbRh2Si2 corresponding to a major sheet of the Fermi surface, and comparison with calculations strongly suggests that this is the first observation of the thermodynamically important ‘J’ sheet of the Fermi surface. Interpretation of this orbit in terms of either the ‘large’ or ‘small’ Fermi surface scenario is problematic, and suggests the need for more advanced band structure calculations at high magnetic fields in this material.
This research was funded by the France-Canada Research Fund, the Canadian Institute for Advanced Research, and the National Science and Engineering Research Council of Canada.
References
- [1] P. Gegenwart, Q. Si, and F. Steglich, Nature Physics 4, 186 (2008).
- [2] T. Senthil, M. Vojta and S. Sachdev, Phys. Rev. B 69, 035111 (2004).
- [3] H. Shishido, R. Settai, H. Harima and Y. Onuki, J. Phys. Soc. Jpn. 74, 1103 (2005).
- [4] J. Custers et al., Nature 424 524 (2003).
- [5] S. Friedemann et al., Nature Physics 5, 465 (2009).
- [6] S. Paschen et al., Nature 432, 881 (2004).
- [7] G.A. Wigger et al., Phys. Rev. B 76, 035106 (2007).
- [8] Y. Tokiwa et al., Phys. Rev. Lett. 94, 226402 (2005).
- [9] P. Gegenwart et al., New J. Phys. 8, 171 (2006).
- [10] P.M.C. Rourke, A. McCollam, G. Lapertot, G. Knebel, J. Flouquet and S.R. Julian, J. Phys.: Conf. Series 150, 042165 (2009).
- [11] C.A. King and G.G. Lonzarich, Physica B 171, 161 (1991).
- [12] e.g. R. Ahuja, S. Auluck, B. Johansson and M.S.S. Brooks, Phys. Rev. B 50, 5147 (1994).
- [13] P.M.C. Rourke et al., Phys. Rev. Lett. 101, 237205 (2008).
- [14] D. Shoenberg, Magnetic Oscillations In Metals (Cambridge University Press, Cambridge, 1984).
- [15] M.R. Norman, Phys. Rev. B 71 220405(R) (2005).
- [16] G. Knebel et al., J. Phys. Soc. Jpn. 75, 114709 (2006).
- [17] S. Viola Kusminskiy et al., Phys. Rev. B 77, 094419 (2008).
- [18] K.S.D. Beach and F.F. Assad, Phys. Rev. B 77, 205123 (2008).
- [19] R. Daou, C. Bergemann and S.R. Julian, Phys. Rev. Lett. 96, 026401 (2006).
- [20] L. Taillefer and G.G. Lonzarich, Phys. Rev. Lett. 60, 1570 (1988).
- [21] J.H. Shim, K. Haule and G. Kotliar, Nature 446, 513 (2007).
- [22] P. Fulde, J. Keller and G. Zwicknagl, Solid State Phys. 41, 1 (1988).