A model of the reflection distribution in the vacuum ultra violet region
Abstract
A reflection model with three components, a specular spike, a specular lobe and a diffuse lobe is discussed. This model was successfully applied to describe reflection of xenon scintillation light (nm) by PTFE and other fluoropolymers and can be used for Monte Carlo simulation and analysis of scintillation detectors. The measured data favors a Trowbridge-Reitz distribution function of ellipsoidal micro-surfaces. The intensity of the coherent reflection increases with increasing angle of incidence, as expected, since the surface appears smoother at grazing angles. The total reflectance obtained for PTFE is about 70% for VUV light at normal incidence in vacuum and estimated to be up to 100% in contact with liquid xenon.
keywords:
Xenon scintillation, Reflectance, VUV, PTFE, Rough surfaces, Diffuse , reflectionMSC:
29.40.Mc , 87.64.Cc, 78.20.Ci, 43.30.Hw, 42.25.Gy1 Introduction
The scintillation light emitted in vacuum ultra-violet (VUV) region by noble gases/liquids (namely xenon, neon and argon) is used in particle physics detectors to detect very small energy depositions [1]. It is therefore desirable to know in detail the VUV reflectance inside these systems. Moreover, this knowledge is also relevant to applications of VUV sources in synchrotron ultraviolet radiation facilities.
Owing to a very low outgassing, chemical stability and high reflectance, PTFE (polytetrafluoroethylene) is a common choice for the inner walls of VUV systems [2],[3]. However, PTFE is an inhomogeneous dielectric whose reflection pattern is not sufficiently known in the ultraviolet. In this work we study the reflectance distributions of some fluoropolymers, namely PTFE, ETFE, FEP and PFA. Most of the existing reflection distribution studies have been developed in the framework of computer graphics and computer vision and tested only for visible light [4]. Experimental reflection data in the VUV region is difficult to obtain due to the light absorption by the oxygen molecules in air. We measured the reflectance of these fluoropolymers with xenon scintillation light (175 nm), using a specially built scatterometer, in which the atmospheric air can be replaced by a non absorbing gas such as pure nitrogen or argon [5]. Here we show data on the reflection by these surfaces along with the results of a model that describes effectively the observations.
The roughness of the surface, which has effect on both diffuse and specular reflections, is described as an ensemble of micro-surfaces randomly oriented in space, following a certain probability distribution function related to the surface structure [6]. A geometrical attenuation factor accounts for shadowing and masking by different micro-surfaces, especially at low grazing angles.
We conclude that three parameters suffice to describe the observed reflectance of unpolished samples of the aforementioned fluoropolymers, namely: i) the index of refraction, ii) the albedo of the surface and iii) a roughness parameter [7]. This model has been validated with data of various wavelengths, including VUV light from the scintillation of xenon (175 nm) and light from UV and green LEDs. The reflectance distributions of the samples were measured both in and out of the plane of incidence. It was found that smoother surfaces are better described if a specular reflection spike is also included to account for coherent reflection at the surface average plane.
Here we present a reflectance model of rough surfaces, considering that the light reflection is both diffuse and specular, with three components: i) the albedo due to internal sub-surface scattering of light, ii) the reflection at the surface by a myriad of random faces and iii) the coherent reflection spike.
We conclude that although the reflectance of the PTFE is mainly diffuse, the intensity of both the specular lobe and the coherent spike can be significant in the VUV, specially at grazing angles. Hence, this effect should be taken into account in detailed analyses of the light collection in scintillation detectors and other systems.
This work aimed primarily at describing the reflectance distributions of dielectric surfaces, namely in the VUV region, in a way suitable to be used in simulations and analysis of the light propagation through the volume of a scintillation chamber, up to the point of detection or absorption. In view of these applications this model was added as a class of the Geant4 Monte Carlo simulation toolkit [8] with the effect of improving the quality of the the simulations of experiments that rely on detection of the VUV light.
2 Modelling the Reflectance
The reflection pattern produced by a surface can be studied using the bidirectional reflectance intensity distribution function (BRIDF). This function is defined as the ratio between the intensity reflected along a viewing direction, v, and the radiation flux, , incident at the surface along the direction i [9]
| (1) |
where is the flux reflected per solid angle towards the viewing direction (see figure 1).
The reflectance distribution was modeled by a function comprising three different contributions: the diffuse lobe , the specular lobe and the coherent specular spike ,
| (2) |
In a dielectric the diffuse lobe is associated to internal scattering of the light that penetrates into the material and is scattered by sub-surface inhomogeneities back into the incoming medium. For smooth surfaces this process is approximately lambertian, corrected by the Fresnel equations of reflection [10],
where is Fresnel reflection coefficient , and are the indices of refraction above an below the surface and is the albedo of the surface, i.e. the fraction of the light which is not absorbed during the internal scattering.

The surface roughness, though small, is important to the specular reflected light, including the coherently reflected spike. To describe the lobe of specular reflection we adopt a geometric reflection approach in which specular reflection occurs at a myriad of micro-surfaces randomly oriented in space, with some probability distribution function, [6]. The corresponding BRIDF function can be put in the form [7],
| (3) |
where is a geometrical factor to account for the effects of shadowing between micro-surfaces and is a weighting factor corresponding to the fraction of light undergoing coherent reflection. The factor relates the geometry of the solid angle made by the normals of micro-surfaces with the solid angle to where they reflect [7][11]. The above process is in competition with the coherent reflection responsible for a specular spike in the reflectance distribution of the surface. This is a pure wave phenomenon and as such cannot be predicted by a geometrical approach to the reflection [12]. The coherent contribution can be written as
| (4) |
where measures the importance of the coherent reflection.
The coherent reflection wave can be predicted by the model of Beckmann-Spizzichino. However, this calculation uses conductor boundary conditions at the surface, which may not be satisfactory on a dielectric interface. Notwithstanding, this model predicts that the intensity of the specular spike behave as an exponential function of the surface roughness and of the incident and reflected angles [13], as
| (5) |
where and are the incident and reflection angles respectively, is the standard deviation of the distribution of the height irregularities of the surface, assumed Gaussian, and is the wavelength of the radiation. Thus, at large angles of incidence the surface appears smoother and the importance of the specular spike increases. However, the fits to the reflectance of the measured fluoropolymer dielectrics clearly suggest the following dependency
| (6) |
where is a constant to be fitted to the data.
As stated above, the shape of the specular lobe is related with the surface structure function. The surface is modeled by an ensemble of micro-surfaces oriented at random whose normals make angles with the macroscopic normal and are distributed according to some (usually unknown) probability distribution function (see figure 1). We compared the predictions based on two possible probability distribution functions: i) the Cook-Torrance function for V shaped micro-surfaces [15], , which is approximately gaussian for small roughness, and ii) the function deduced by Trowbridge-Reitz for ellipsoidal micro-surfaces [14], :
| (7) | |||||
| (8) |
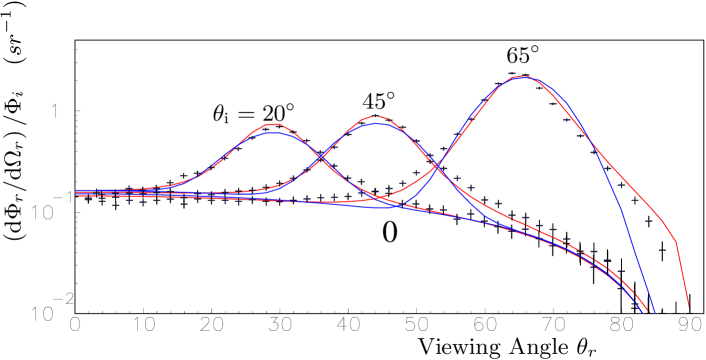
The two functions are normalized to unity and the parameters and measure, in each case, the roughness of the surface. The fits to the measured data suggest that the Trowbridge-Reitz function is more suitable to represent the probability distribution of the micro-surfaces (see figure 3). Therefore, in what follows we adopt this probability function unless otherwise stated.
The geometrical factor mentioned above, that corrects for shadowing and masking effects by adjacent micro-facets, was borrowed from Smith formulae [16],
where is the Heaviside step function and is a function which is given by
| (9) |
if the surface irregularities are distributed according to the Trowbridge-Reitz probability function [11].
3 Experimental results
| Sample | ||||
|---|---|---|---|---|
| Extruded () PTFE | 1.500.03 | 0.690.07 | 0.0550.007 | 3.00.3 |
| Extruded () PTFE | 1.460.04 | 0.630.07 | 0.0660.008 | 4.30.5 |
| Pressed PTFE | 1.450.04 | 0.740.07 | 0.0490.015 | 1.70.2 |
| PFA | 1.440.04 | 0.690.05 | 0.0570.006 | 2.40.4 |
| FEP | 1.410.02 | 0.220.04 | 0.0520.009 | 1.20.4 |
| ETFE | 1.440.03 | 0.130.01 | 0.0400.010 | 1.00.2 |
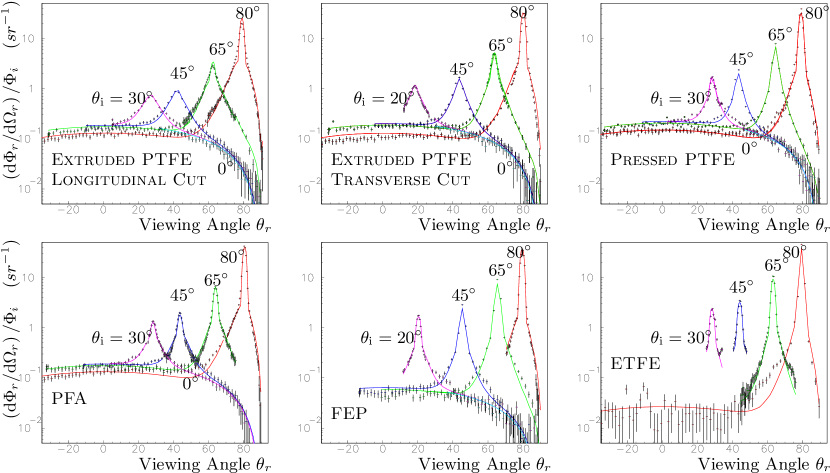
We observed the light reflected by samples of fluoropolymers for various incident and viewing angles, both in and out of the plane of incidence [7]. Figure 2 shows the reflection distribution functions for three different samples of polished PTFE and the copolymers PFA, FEP and ETFE, for the xenon scintillation light (175 nm), in the plane of incidence. The light was produced in a proportional counter filled with gaseous xenon. The experimental procedure and the chamber used for the measurements are described in detail in refs. [5] and [7].
The reflectance distributions of figure 2 show clearly the presence of the three contributions: a diffuse lobe, a specular lobe and a specular spike. The data was fitted with the function and the values of the four unknown parameters extracted, as shown in table 1.
In figure 3 we compare the fits to a sample of unpolished PTFE using either one of the function distributions or (eqs. 7 and 8). The agreement is clearly better if is used. Therefore, we used this function in all the fits shown in the figure 2.
PTFE and PFA show a pronounced diffuse lobe, corresponding to an albedo between 0.6 to 0.7. The intensity of this component varies as expected with the angle of incidence, being suppressed at large angles in result of decreasing the intensity of the transmitted wave and consequently the sub-surface scattering.
None of the samples measured is a pure diffuser. The coherent spike increases with the angle as expected and it is especially visible at large angles of incidence. Its observed width is merely instrumental due to the aperture of the incident beam and of the aperture of the photo-detector used in the experiment.
The effects of shadowing and masking reduce the specular lobe, specially at grazing angles, in which case the light is scattered towards elsewhere. The geometric factor referred to above is relevant at those angles (for angles in excess of ) to reproduce the observed suppression.
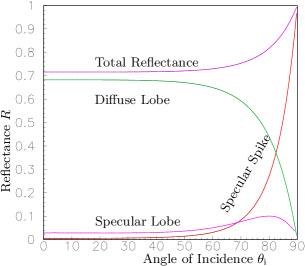
The total reflectance of the surface can be calculated for each angle of incidence by integrating the function for all viewing directions:
| (10) |
It is shown in figure 4 for polished pressed PTFE as a function of the angle of incidence, . The three reflection components that are shown remain fairly constant up to , the diffuse reflection dominating all along at 68%, whereas the specular lobe and specular spike amount to only 2.8% and 0.5% respectively. Above 70∘ the coherent spike is the main component of the specular reflection.
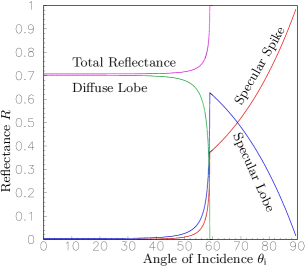
This model can be also applied to calculate the reflectance of PTFE in contact with a liquid instead of vacuum/gas. Assuming that the albedo and refraction index of PTFE remain the same it is straightforward to conclude that in this case much more light will be reflected by the surface. The expected reflectance predicted by this model for a PTFE liquid-xenon interface is plotted in figure 5.
4 Conclusion
The reflectance of polished fluoropolymers exhibit three main reflection components, a diffuse lobe, a specular lobe and a specular spike. The process can be modeled with only four free parameters and reproduces fairly well the details of the reflectance distribution measured in these materials.
The data show that the specular lobe is best reproduced if the reflecting surface is approximated in the model by an ensemble of ellipsoid-shaped micro-surfaces. This conclusion comes at no surprise though, since these materials are granular by nature.
The relative intensity of the coherent specular spike appears to vary exponentially with the cosine of the angle of incidence, . This is in contrast to the prediction of the Beckmann-Spizzichino model of a dependency in . This issue deserves additional studies in the future.
In a PTFE vacuum interface the diffuse lobe is dominant for most of the incident angles. However, the total reflectance computed for PTFE in contact with liquid xenon shows a much more pronounced contribution from the specular reflection. The average reflectance is in agreement with previous estimates resulting in values of 90% for the total reflectance assumed to be independent of the incident angle, in this case [18], [19].
References
- [1] T. Doke et al. Nucl. Instr. and Meth. A, 420:62–80, 1999.
- [2] G. J. Alner et al Phys. Rev., 28:287, 2007.
- [3] EXO Collaboration. Nucl. Instr. and Meth. A, 578:409–420, 2007.
- [4] M. Oren and S. K. Nayar. Proc. SIGGRAPH, 239–246, 1994.
- [5] C. Silva et al Nucl. Instr. Meth. A, 580:322, 2007.
- [6] K.E. Torrance and E.M. Sparrow J. Opt. Soc. Am., 57:1105–1114, 1967.
- [7] C. Silva. Submitted for publication
- [8] S. Agostinelli et al Nucl. Instr. Meth. A, 506:250-303, 2003.
- [9] F.E. Nicodemus et al. Considerations and Nomenclature for Reflectance. Nat. Bur. of Standards, Dep. of Commerce, Washington, D.C. 20234, 1977.
- [10] L. B. Wolff et al J. Opt. Soc. Am., 11:2956–2968, 1994.
- [11] B. Walter. Microfacet Models for Refraction through Rough Surfaces. Eurograph. Symp. on Rendering, Springer-Verlag, 2007.
- [12] J. A. Ogilvy J. Phys. D: Appl. Phys. 21:260-277 1988.
- [13] S. K. Nayar et al IEEE Trans. on Pattern Anal. and Machine Intell., 13:511, 1991.
- [14] T.S. Trowbridge and K.P. Reitz J. Opt. Soc. Am., 5:531–536, 1975.
- [15] R. L. Cook and K. E.Torrance. ACM Trans. on Graphics, 1:7–24, 1982.
- [16] B.G. Smith. IEEE Trans. on Antennas and Propagation, 15:788–790, 1967.
- [17] V. Solovov et al. Nucl. Instr. Meth. A, 516:462-474 2004.
- [18] M. Yamashita et al Nucl. Instr. Meth. A, 535:692 2004.
- [19] F. Neves et al IEEE Trans. on Nucl. Sci. 52:2793 2005.