Reflectance of Polytetrafluoroethylene (PTFE) for Xenon Scintillation Light
Abstract
Gaseous and liquid xenon particle detectors are being used in a number of applications including dark matter search and neutrino-less double beta decay experiments. Polytetrafluoroethylene (PTFE) is often used in these detectors both as electrical insulator and as a light reflector to improve the efficiency of detection of scintillation photons. However, xenon emits in the vacuum ultraviolet wavelength region (=175 nm) where the reflecting properties of PTFE are not sufficiently known.
In this work we report on measurements of PTFE reflectance, including its angular distribution, for the xenon scintillation light. Various samples of PTFE, manufactured by different processes (extruded, expanded, skived and pressed) have been studied. The data were interpreted with a physical model comprising both specular and diffuse reflections. The reflectance obtained for these samples ranges from about 47% to 66% for VUV light. Fluoropolymers, namely ETFE, FEP and PFA were also measured.
pacs:
29.40.Mc; 87.64.Cc; 78.20.Ci; 43.30.Hw; 42.25.GyI Introduction
Liquid and gaseous xenon particle detectors are being used in a number of applications including dark matter search Alner et al. (2007), neutrino-less double beta decay experiments Danilov et al. (2000) and searches for decays Ritt et al. (2006). Polytetrafluoroethylene (PTFE) is often used in these detectors both as electrical insulator and as a reflector to improve the detection efficiency of scintillation photons. The reflectance distribution function of this material needs to be known in order to improve the simulations of the detectors and the data analysis of the light collection. However, the xenon emits in the vacuum ultra violet region (=175 nm Doke et al. (1999)) and, to our knowledge, the optical reflectance distribution of PTFE has not been measured at those wavelengths.
PTFE, also known as Teflon® (), is a polymer produced from tetrafluoroethylene. The strong bound between carbon and fluorine leads to a high chemical stability in a wide range of temperatures between -200∘C and 260 ∘C, which makes it suitable for use in xenon scintillation detectors.
In this work we report on measurements of PTFE reflectance, including its angular distribution, for xenon scintillation light. The data were interpreted with a physical model comprising diffuse and specular lobes.
Measurements of the reflectance distributions are usually done inside a gonioreflectometer illuminated by a laser beam, the reflected light being sampled at different angles. However, not much data have been published on reflectance distributions, including data out of the plane of incidence. Furthermore, most published data are for visible light, not for VUV (Weidner et al. (1981), Bricola et al. (2007),Bendler et al. (1998), Weidner et al. (1985)). At these wavelengths the measurement is challenging and must be performed in vacuum or in a gas with low absorption in the VUV.
We measured the reflectance of various PTFE samples, produced by different processes (namely molded, skived, extruded and expanded). All these materials are obtained by suspension polymerization from tetrafluoroethylene, reduced to a fine powder, agglomerated in small pellets, and either: i) compressed in a mold, ii) extruded, iii) skived or iv) expanded by air injection, respectively Rytger (2004).
PTFE belongs to a family of materials known as fluoropolymers. This includes co-polymers of tetrafluoroethylene and ethylene; hexafluoropropylene; and , which are known as ETFE (or Tefzel®), FEP and PFA, respectively. The reflectance of these materials was also measured and compared with PTFE samples.
This work has been motivated by the need to derive a model of reflectance to be included in simulations and data analysis of detectors relying on production, propagation and detection of VUV light, namely those in which PTFE is used. We present measurements of the reflectance distributions along with results of a physical reflectance model fitted to the data.
II Experimental Set-Up


The experimental set-up used to measure the reflectance is depicted in Fig. 1, along with the system of coordinates. The construction and characterization of the chamber is detailed elsewhere Silva et al. (2007). The VUV light is produced in a strong electric field near the central anode wire of a proportional scintillation counter filled with gaseous xenon at 1.1 bar. Alpha-particles from 241Am are used as a source of ionization. The light exits through a fused silica window and is collimated by two pin-holes before reaching the surface of the sample to be measured. The sample is rotated to change the angles and and thus the angle of incidence. The light that is reflected by the sample is detected by the photomultiplier (PMT) shown in Fig. 1 at different viewing angles, . The measurements are performed inside a stainless steel box filled with gaseous argon, to prevent light absorption.
The reflected radiant intensity, , is calculated dividing the number of photons detected in the direction by the solid angle comprised by the PMT window. To measure the incident beam flux, , we placed the PMT directly to the beam, having previously moved the sample off the beam course.
For each measurement we set and and measured the reflected light at different viewing direction angles, . The data taking time was in average s, for each point . The background, measured by the PMT (with beam on but no sample) was about 0.13 photoelectrons per second , for all angles considered Silva et al. (2007).
The angles measured in the experiment: , and , are related with the angles and (Fig. 2) used in the reflection model through the following equations:
| (1) |
III Modelization of the reflection
The light reflected from a surface is in general a superposition of diffuse and specular contributions. Its angular distribution depends of the structure of the surface, and of sub-surface inhomogeneities of the medium Wolff et al. (1994), which cannot be known in detail. Therefore, the reflectance has to be treated statistically and parameterized to account for the roughness of the surface and the characteristics of the material.
Numerous approaches have been considered for describing the reflectance distributions. These include both empirical and physically motivated models Zhu et al. (2009). They often stem from the field of computer graphics, aiming at reproducing the reflectance functions of real objects, which is of paramount importance for perception in virtual reality environments. Though the focus is usually on visible light, the goal is always to parametrize the reflectance in order to reproduce the light distribution reflected from a surface.
The surface is modeled as an ensemble of micro-surfaces randomly oriented, according to some distribution function. Each micro-surface is defined by a normal , which is generally non-coincident with the global (macroscopic) normal of the surface considered at large, . Hence, two sets of angles have to be considered: i) global angles, relative to , and ii) local angles, referred to the normal of the local micro-surface, (see Fig. 2). As indicated, is the angle between and . For specular reflection the relations between the local and the global variables are
| (2) | |||||
| (3) |


The diffuse radiance of a surface is often assumed to be independent of the viewing direction (Lambert law), but in fact it is non-Lambertian in general. This has been attributed to variations in the amount of light that penetrates(exits) the sub-surface layers at different entry(exit) angles in result of the Fresnel equations. Hence, diffuse reflectance is best described by the Lambert law multiplied by a Fresnel coefficient Wolff et al. (1994). Moreover, a coarse surface is not Lambertian even if it is locally, since the radiance of several tilted Lambertian micro-surfaces is not the same for all viewing directions Oren and Nayar (1994). The resulting radiance is no longer Lambertian and, therefore, a diffuse reflectance model has to encompass the two effects Wolff et al. (1998).
The angular distribution of the reflectance can be conveniently expressed in terms of the Bidirectional Reflected Intensity Distribution Function (BRIDF) Nicodemus et al. (1977), which is by definition the intensity of the reflected light into a given direction per unit of incident beam flux,
| (4) |
where is an element of the solid angle towards the viewing direction and and are the incident and reflected fluxes of radiation, respectively. This function describes how reflected light is distributed in space for any given direction of incidence. It is therefore a suitable quantity to parametrize the observations. Given that the reflection has specular and diffuse components it is convenient to distinguish their contributions in the function ,
The incident flux of radiation impinging at a certain area of the surface is
where is the radiance of the source and is the solid angle subtended by the incident beam. The surface is a priori composed by many micro-surfaces and each micro-surface of has its own normal , distributed according to some probability distribution function, . The number of normals pointing within a solid angle is and the effective area of the micro-surfaces whose normal is within the solid angle is . We assume that the micro-surfaces have no preferred direction and, therefore, . The incident flux at the micro-surfaces is
Therefore, the specular radiated flux by the area into a direction is given by
| (5) |
where the geometrical attenuation factor accounts for shadowing and masking between micro-surfaces Smith (1967) and the Fresnel coefficient, , expresses the fraction of light that is reflected at the surface with normal . For unpolarized light,
| (6) |
where , and and are the refraction indices above and bellow the surface, respectively. The angles are defined in Fig.2.
For specular reflection the following relation holds Nayar et al. (1991), Walter (2007) (see Fig. 3)
| (7) |
and, therefore,
| (8) |
This argument follows closely the work of Torrance-Sparrow Torrance and Sparrow (1967).
The diffuse reflection flux by a smooth surface is given in Lambert approximation by
| (9) |
where is the diffuse albedo, and the factor is the Wolff correction factor that accounts for entry(exit) of light into(out of) the sub-surface layer Wolff et al. (1994). If the roughness of the surface is taken into account and a distribution of micro-surfaces is considered, then the diffuse reflection flux from a distribution of micro-surfaces ought to be
where is the fraction of whose normal is within and the factor accounts for the effectively radiating micro-area. Hence
| (10) |
This model proved successful in describing the diffuse reflection of various samples illuminated with visible light Wolff et al. (1998). The integral has been parametrized numerically in the form
| (11) |
where
and is the width of the distribution considered (eq. 13); is the Heaviside step function; ; and . Note that if this equation reduces to the Lambert law.
Putting it altogether, the reflectance distribution is described by the function
| (12) |
We considered that the surface is invariant to rotations about the normal, in which case can be set to zero. The function above has three parameters which have to be evaluated from observation of the light reflected by the surface: , and . These coefficients are in general functions of the wavelength, and additionally to be consistent with flux conservation.
The first term of function represents the specular reflection lobe Torrance and Sparrow (1967), whose width is proportional to the roughness of the surface, embodied in the distribution . For the distribution function we considered the function that was deduced by Trowbridge and Reitz assuming for the micro-surfaces an ellipsoidal shape Trowbridge and Reitz (1975),
| (13) |
In fact, this distribution seems the most successful in describing the data, when compared with other forms Walter (2007). As for the geometric attenuation factor , we considered the closed form due to Smith Smith (1967):
| (14) |
where
| (15) |
Though, this factor is only relevant for angles above .
Our goal is to fit the measured data with a function having the minimum physically meaningful parameters. The above model has only three free parameters, i.e. n, and , whose values are determined from a fit to the data set of points measured. A least squares minimization method based on a genetic algorithm was implemented specifically for this purpose. In evaluating , it is necessary to set the variable by stochastic sampling according to the probability distribution function referred above. The fit results are shown in the table 1. Examples of the fits are shown in figures 4 to 6.
The total reflectance is obtained by numerical integration of over all viewing directions,
| (16) |
using the fitted parameters mentioned above. The factor recalls that the integral includes all reflected light irrespective of its direction. This integral has been calculated numerically for the diffuse and the specular components of reflection. The results are plotted in Fig. 8 and shown in table 2 for various surfaces.
The fitted function stated above can be readily implemented in the Monte Carlo simulation of the propagation of light in scintillation detectors.
IV Experimental Results
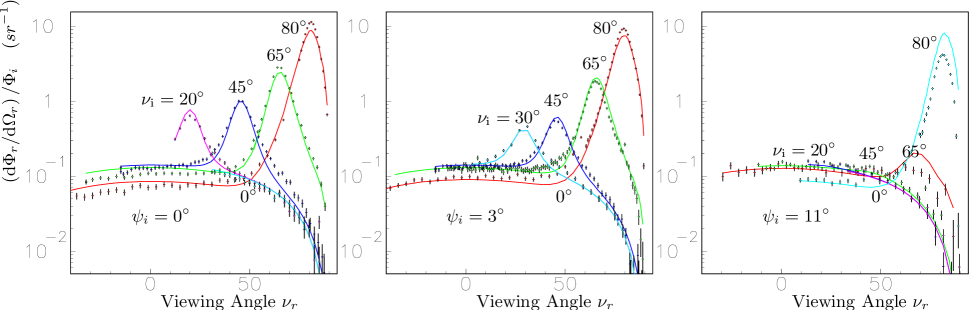
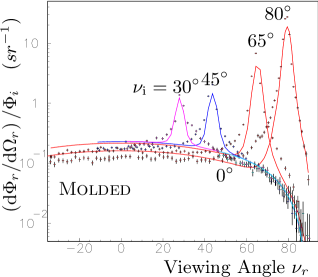
We measured the reflectance distribution of a mm tick piece of unpolished molded-PTFE for angles of incidence and inclinations .
The BRIDF function was fitted to the entire data set (2223 points), yielding for unpolished molded-PTFE: , and . A subset of these results is shown in Fig. 4, for the angles indicated. The curves represent the reflectances predicted by the overall fit to all data points measured, including measurements out of the incidence plan. This simple model seems to reproduce the main features observed in the data, despite the fact that data at high angles are included in the fit.
These results show that for the specular lobe is highly suppressed, whereas the intensity of the diffuse component does not change significantly, as would be expected for a consistent data set.
The integral of the reflectance function (eq. 12) is represented in Fig. 8 as a function of the angle of incidence, for specular and diffuse reflection components. The results show that the intensity of the diffuse lobe is nearly constant up to about , whereas the specular lobe increases with increasing angle of incidence as would be expected from the Fresnel equations. The specular lobe becomes more intense than the diffuse lobe for .
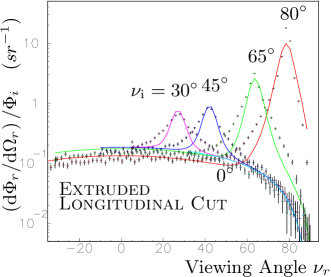
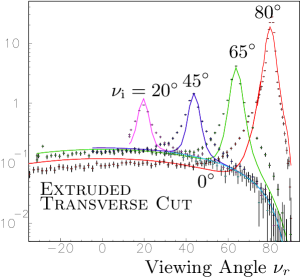
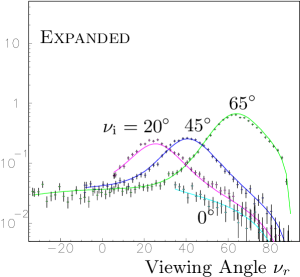
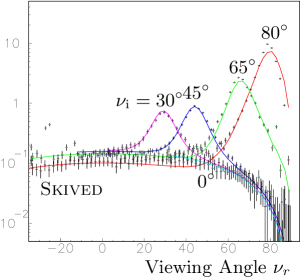
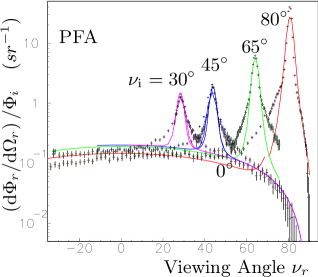
In Fig. 5 we show reflectance measurements of different kinds of PTFE, manufactured by the processes indicated, for light of nm. These samples had thickness of mm ( mm for extruded-PTFE) and were finished with ultra fine sandpaper (P2000) and polished prior to measurement (except expanded-PTFE owing to its mechanical properties). Two samples of extruded-PTFE were measure, cut along and transversely to the direction of extrusion, respectively (as they might have a preferred direction). The surface inclination angle was set to in all cases represented in Fig. 5.
| Fluoropolymer | ||||
|---|---|---|---|---|
| PTFE | Molded Unpolished | |||
| PTFE | Molded Polished | |||
| PTFE | Extruded⟂ | |||
| PTFE | Extruded∥ | |||
| PTFE | Skived | |||
| PTFE | Expanded | |||
| PFA | ||||
| FEP | ||||
| ETFE |
The curves in Fig. 5 represent the best overall fit of function , considering all data. The values of the fitted parameters are shown in table 1. As shown, the index of refraction appears to be between 1.25 for the FEP sample and 1.56 for the expanded sample. The width of the specular lobe is between 0.014 and 0.064 for the molded and skived surfaces, respectively.
The reflectance distributions are similar for extruded, skived and molded samples. However the reflection of expanded-PTFE appears to be quite different from the others, showing less diffuse light and a much broader specular lobe.
| Molded Unpolished | |||||||
|---|---|---|---|---|---|---|---|
| Molded Polished | |||||||
| Extruded⟂ | |||||||
| Extruded∥ | |||||||
| Skived | |||||||
| Expanded | |||||||
| PFA | |||||||
| FEP | |||||||
| ETFE | |||||||
The reflectance of each sample is obtained by integrating the distribution function for the fitted parameters referred above. The results are presented in table 2 for angles of incidence and . They show that the reflectance is mainly diffuse, with the diffuse lobe accounting for more than 90% of the reflection at (70% for expanded-PTFE). At 65∘ the diffuse lobe accounts for more than 80% of the reflection (48% for the expanded sample). These results show clearly that the relative contribution of the diffuse lobe is larger for the samples with higher reflectance.
The expanded PTFE shows the lowest reflectance of all measured. The fact that the specular component does not follow this trend might suggest that VUV light is being absorbed by oxygen molecules trapped in the pores of the material, underneath the surface Huang (2001).
It can be concluded from these results that the reflectance of polished-molded-PTFE is about 74% (table 2), whereas the corresponding unpolished sample has a reflectance of only 49% (see Fig. 8). Polishing the surface enhances the total reflectance of PTFE. This might be due to air trapped in the porous PTFE that is released by the polishing, but further studies are necessary to fully understand this effect.
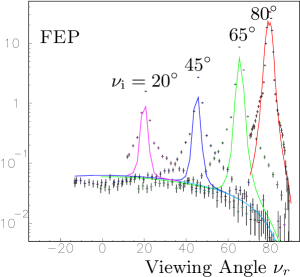
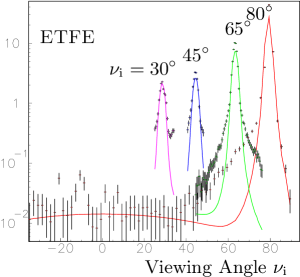
The observed reflectance of fluoropolymers: ETFE, FEP and PFA is shown in Fig. 6. Samples of thickness 0.5 mm (ETFE), 1.1 mm (FEP) and 1.5 mm (PFA) were measured. All of them are transparent to visible light, but proved to be opaque at 175 nm, as concluded from the fact that no light was detected by the PMT on the other side of the samples illuminated with VUV light.
As shown in Fig. 6, PFA and FEP have both diffuse and specular reflection components which are similar to those of PTFE, for light of 175 nm wavelength. The values of the fitted parameters are included in table 1. However, ETFE shows only a specular lobe, the diffuse component being much suppressed, compared to the former.
The model considered above fails to fully describe the tails of the samples with narrow lobes, notably the fluoropolymers ETFE, FEP and PFA, which might be indicating that the contribution from coherent reflection should also be considered in these cases. Hence, the indices of refraction of these fluoropolymers are possibly under-estimated (table 1).
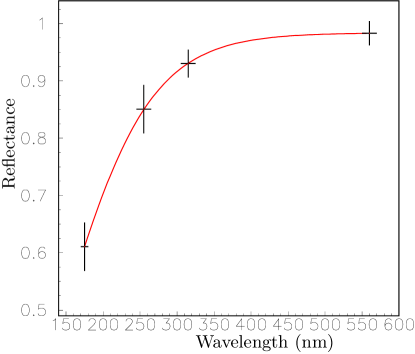
The reflectance of molded-PTFE was also studied as a function of wavelength using light emitting diodes (LED), emitting at nm, respectively. These results are shown in Fig. 8 and in table 3 for light at normal incidence. The index of refraction of PTFE obtained at 550 nm (1.361) agrees with published values (between 1.3 and 1.4 Ferry et al. (1998)). The reflectance increases with the wavelength, reaching a value about for light of nm, in line with previous observations of PTFE at the near ultraviolet Weidner et al. (1981). This is due to the increase of the diffuse component due to internal scattering with increasing wavelength, while the specular lobe remains fairly constant above 250 nm. Thus, PTFE is a good diffuser for visible light, the specular reflection being only about at normal incidence for a wavelength of the order of nm. However, these results show that the specular reflection cannot be ignored for VUV light, owing to the decrease of the diffuse component.
| Wavelength | |||
|---|---|---|---|
| (nm) | |||
| 175 | |||
| 250 | |||
| 310 | |||
| 550 |

V Conclusions
The reflectance distribution of PTFE at 175 nm clearly shows specular and diffuse lobes. At these wavelengths PTFE cannot be considered a ”perfect” diffuser. The amount of specularly reflected light can be significant in scintillation detectors using this material. The experimental observations were interpreted using a function distribution which models the diffuse and specular reflections by rough surfaces. The data are well described by a generic BRIDF function, , with only three free parameters. The fitted can be used to obtain the reflectance of the considered surfaces of PTFE, by integration over all viewing angles.
The PTFE samples that were polished show a more narrow specular lobe and a more intense diffuse lobe compared to the unpolished surfaces. Moreover, the reflectance distribution is similar for the various PTFE samples observed, with the notable exception of expanded-PTFE. The reflectance obtained, at normal incidence varies between 44% and 66% (is about 15% for expanded-PTFE), at nm.
In all cases the diffuse lobe is the dominant reflection component of PTFE. It accounts more than 90% of the total reflectance at (70% for expanded-PTFE). It was also found that the reflectance of the PTFE increases with increasing wavelength, due to the growth of the diffuse reflection. Thus, the contribution of the specular lobe to the total reflectance increases at lower wavelengths.
The reflectances of PFA and FEP resemble that of PTFE, even if FEP has a less intense diffuse component compared to PTFE. By contrast, the ETFE surface is mostly specular for VUV light of 175 nm.
The reflection is reasonably described by the distribution function discussed above. Having only three parameters this function is suitable to parameterize the reflection by PTFE surfaces illuminated with VUV light, especially in the context of simulating the light collection in particle physics scintillation detectors.
Finally it would be interesting to investigate if the reflectance distribution of PTFE in contact with gas is dramatically altered if the surface is immersed in liquid xenon, more than would be expected from changing the refraction index. The results depend on whether the liquid enters into the any superficial pores.
Acknowledgment
The samples of FEP, ETFE and PFA were kindly offered by DuPont de Nemours. This work is supported by the FCT projects POCI/FP/81928/2007 and CERN/FP/83501/2008, C. Silva was supported by the FCT fellowships SFRH/BD/19036/2004.
References
- Alner et al. (2007) G. J. Alner et al., Phys. Rev. 28, 287 (2007).
- Danilov et al. (2000) M. Danilov et al., Phys. Lett. B 480, 12 (2000).
- Ritt et al. (2006) S. Ritt et al., Nucl. Phys. B 162, 279 (2006).
- Doke et al. (1999) T. Doke et al., Nucl. Instr. and Meth. A 420, 62 (1999).
- Weidner et al. (1981) V. R. Weidner et al., J. Opt. Soc. Am. 71, 856 (1981).
- Bricola et al. (2007) S. Bricola et al., Nucl. Phys. B 172, 260 (2007).
- Bendler et al. (1998) J. T. Bendler et al., J. Appl. Phys 83, 998 (1998).
- Weidner et al. (1985) V. R. Weidner, J. Hsia, and B. Adams, Appl. Optics 24, 2225 (1985).
- Rytger (2004) H. Rytger, Handbook of Polymer Synthesis (Taylor & Francis, 2004), 2nd ed.
- Silva et al. (2007) C. P. Silva et al., Nucl. Instr. Meth. A 580, 322 (2007).
- Wolff et al. (1994) L. B. Wolff et al., J. Opt. Soc. Am. 11, 2956 (1994).
- Zhu et al. (2009) Q. Zhu et al., Front. Energy Power Eng. China 3, 60 (2009).
- Oren and Nayar (1994) M. Oren and S. K. Nayar, Proc. SIGGRAPH pp. 239–246 (1994).
- Wolff et al. (1998) L. Wolff et al., Int. Journ. Comp. Vision 30, 55 (1998).
- Nicodemus et al. (1977) F. Nicodemus et al., Considerations and Nomenclature for Reflectance (National Bureau of Standards, Department of Commerce, Washington, D.C. 20234, 1977).
- Smith (1967) B. Smith, IEEE Trans. on Antennas and Propagation 15, 788 (1967).
- Nayar et al. (1991) S. K. Nayar et al., IEEE Trans. on Pattern Analysis and Machine Intell. 13, 511 (1991).
- Walter (2007) B. Walter, Microfacet Models for Refraction through Rough Surfaces (Eurograph. Symp. on Rendering, Springer-Verlag, 2007).
- Torrance and Sparrow (1967) K. Torrance and E. Sparrow, J. Opt. Soc. Am. 57, 1105 (1967).
- Trowbridge and Reitz (1975) T. Trowbridge and K. Reitz, J. Opt. Soc. Am. 5, 531 (1975).
- Huang (2001) J. Huang, Materials Chemistry and Physics 68, 180 (2001).
- Ferry et al. (1998) L. Ferry et al., Journal of Polymer Science Part B: Polymer Physics 36, 2057 (1998).