Spectacular X-ray tails, intracluster star formation and ULXs in A3627
Abstract
We present the discovery of spectacular double X-ray tails associated with ESO 137-001 and a possibly heated X-ray tail associated with ESO 137-002, both late-type galaxies in the closest rich cluster Abell 3627. A deep Chandra observation of ESO 137-001 allows us for the first time to examine the spatial and spectral properties of such X-ray tails in detail. Besides the known bright tail that extends to 80 kpc from ESO 137-001, a fainter and narrower secondary tail with a similar length was surprisingly revealed, as well as some intriguing substructures in the main tail. There is little temperature variation along both tails. The widths of the secondary tail and the greater part of the main tail also remain nearly constant with the distance from the galaxy. All these results challenge the current simulations. The Chandra data also reveal 19 X-ray point sources around the X-ray tails. We identified six X-ray point sources as candidates of intracluster ULXs with of up to 2.5 erg s-1. Gemini spectra of intracluster HII regions downstream of ESO 137-001 are also presented, as well as the velocity map of these HII regions that shows the imprint of ESO 137-001’s disk rotation. For the first time, we unambiguously know that active star formation can happen in the cold ISM stripped by ICM ram pressure and it may contribute a significant amount of the intracluster light. We also report the discovery of a 40 kpc X-ray tail of another late-type galaxy in A3627, ESO 137-002. Its X-ray tail seems hot, 2 keV (compared to 0.8 keV for ESO 137-001’s tails). The H data for ESO 137-002 are also presented. We conclude that the high pressure environment around these two galaxies is important for their bright X-ray tails and the intracluster star formation. The soft X-ray tails can reveal a great deal of the thermal history of the stripped cold ISM in mixing with the hot ICM, which is discussed along with intracluster star formation.
1 Introduction
The intracluster medium (ICM) has long been proposed to play a vital role in galaxy evolution in clusters, through ram pressure and turbulent/viscous stripping of the galactic cold gas (e.g., Gunn & Gott 1972; Nulsen 1982; Quilis et al. 2000). As the halo gas and the cold interstellar medium (ISM) is depleted in the stripping process, the galactic star formation will eventually be shut down and blue disk galaxies may turn into red galaxies (e.g., Quilis et al. 2000). The removal of the cold ISM also affects the accretion history of the central SMBH. Stripping of the ISM of the disk galaxies in clusters has been extensively studied in simulations recently, with better resolution and more physics included (e.g., Abadi et al. 1999; Stevens et al. 1999; Quilis et al. 2000; Schulz & Struck 2001; Bekki & Couch 2003; Roediger & Hensler 2005; Kapferer et al. 2009). These simulations show that stripping has a significant impact on galaxy evolution (e.g., disk truncation, formation of flocculent arms, build-up of a central bulge and enhanced star formation in the inner disk at the early stage of the interaction).
Besides the impact on galaxy evolution, another significant question related to stripping is the evolution of the stripped ISM. After the cold ISM is removed from the galaxy, the general wisdom is that the stripped gas is mixed with the ICM through evaporation eventually. However, it is now known that a fraction of the stripped ISM turns into new stars in the galactic halo or the intracluster space, as revealed from observations (e.g., Sun et al. 2007b, S07 hereafter) and simulations (e.g., Vollmer et al. 2001b; Schulz & Struck 2001; Kronberger et al. 2008; Kapferer et al. 2009). The stripped cold ISM, if it can survive long enough to reach the cluster center, can effectively heat the cluster core via ram-pressure drag, which makes gravitational heating by accretion a possible way to offset cooling (Dekel & Birnboim 2008 argued for 105 - 108 M⊙ clumps). Current HI observations of cluster spiral galaxies still fail to detect most of the HI gas missing from HI-deficient spiral galaxies in the intracluster space (e.g., Vollmer & Huchtmeier 2007), which implies that the bulk of the stripped HI gas has been heated out of the cold phase. However, little is known about the details of mixing, as the actual strength of heat conductivity and viscosity is poorly known. How quickly is the stripped cold ISM heated and mixed with the ICM? What observational signature will evaporation and mixing produce? What fraction of the stripped cold ISM turns into new stars? The mixing of the stripped cold ISM with the hot ICM will produce multi-phase gas. Depending on the poorly known details of mixing, prominent soft X-ray emission may be produced, as well as H emission. In this “unified model” for tails of cluster late-type galaxies, X-ray and H tails are simply manifestations of the cold ISM tail in the mixing process. Therefore, one can better understand mixing and the relevant micro-physics from multi-wavelength data, e.g., the amount of missing HI gas and the amount of the stripped gas in hotter phases. Obviously, a central problem is the energy transfer in the multi-phase gas, which is also a significant question for large cool cores in clusters. Moreover, the wake behind the galaxy produced by stripping provides a way to constrain the ICM viscosity (e.g., Sun et al. 2006, S06 hereafter; Roediger & Brggen 2008a).
Various dynamic features, e.g., bow shocks, tails and vortices, can be produced in stripping (e.g., Stevens et al. 1999; Schulz & Struck 2001; Roediger et al. 2006; Roediger & Brggen 2008b, RB08 hereafter; Tonnesen & Bryan 2009). Observational evidence of stripping of cluster late-type galaxies is present in HI and H observations, either through HI deficiency or tails (e.g., Giovanelli & Haynes 1985; Gavazzi et al. 2001b; Kenney et al. 2004; Oosterloo & van Gorkom 2005; Chung et al. 2007; Yagi et al. 2007; S07). X-ray tails of late-type cluster galaxies have only been detected recently: C153 in A2125 at =0.253 (Wang et al. 2004), and UGC 6697 in A1367 at =0.022 (Sun & Vikhlinin 2005). However, there are only 60 counts from C153 so the X-ray extension is not unambiguous (Wang et al. 2004). The XMM-Newton data show that the X-ray tail of UGC 6697 may extend to 90 kpc from the nucleus but most of the X-ray emission is within the galaxy. Moreover, the galaxy has a peculiar morphology and a tidal tail. Its complex kinematic behavior, revealed from the velocity map, implies the existence of a second galaxy hidden behind the main galaxy (Gavazzi et al. 2001a). Thus, UGC 6697 is a very complicated system where tidal interaction is important. There is also a wide tail (67 kpc90 kpc) of the spiral NGC 6872 in the 0.5 keV Pavo group (Machacek et al. 2005), but it is uncertain how it was formed as the tail terminates on the dominant early-type galaxy of the group. The brightest known X-ray tail behind a cluster late-type galaxy is ESO 137-001 in the closest rich cluster A3627 (S06), with 80% of the X-ray emission beyond the galactic halo. One should be aware that strong X-ray tails of late-type galaxies are rare (e.g., none in Virgo, see Section 7.1). We have done a blind search of strong X-ray tails in nearby clusters () by extending our previous Chandra work (Sun et al. 2007a) to the current XMM-Newton and Chandra archives. Despite extensive cluster data in the archives, e.g., mosaic fields of 2 deg2 around the Perseus and Coma clusters with XMM-Newton, only two more X-ray tails of cluster late-type galaxies were found. One is also in A3627 (ESO 137-002) and will be discussed in this paper. The other one is NGC 4848 in the Coma cluster (Finoguenov et al. 2004) that was recently observed for 29 ks by Chandra. However, both X-ray tails are shorter (40 - 50 kpc) and 2.4 - 5.5 times fainter than ESO 137-001’s tail. Thus, the proximity of ESO 137-001, the high flux and the large length of its X-ray tail makes it the best target for detailed analysis and comparison with simulations. One should not confuse X-ray tails of early-type galaxies with those of late-type galaxies. Early-type galaxies in clusters have abundant X-ray ISM but little or no cold ISM. There are some X-ray tails of early-type galaxies reported (e.g., Machacek et al. 2006; Sun et al. 2007; Randall et al. 2009). Their X-ray tails are composed of the stripped hot ISM and do not co-exist with cold gas.
A3627 is the closest massive cluster (=0.0163, = 925 km/s and =6 keV) rivaling Coma and Perseus in mass and galaxy content (Kraan-Korteweg et al. 1996; Woudt et al. 2008). It is also the sixth brightest cluster in RASS and the second brightest non-cool-core cluster after Coma (Bhringer et al. 1996). ESO 137-001 is a blue emission-line galaxy (Woudt et al. 2004) that is only 180 kpc from the cluster’s X-ray peak in projection. Its radial velocity (468071 km s-1, Woudt et al. 2004) is close to the average velocity in A3627 (487154 km s-1, Woudt et al. 2008) so most of its motion is probably in the plane of sky. If ESO 137-001 is on a radial orbit, its real distance to the cluster center should be close to the projected distance. There is no sign of a galaxy merger and no strong tidal features around ESO 137-001. S06 found a long X-ray tail behind ESO 137-001, in both Chandra (14 ks) and XMM-Newton data (MOS: 18 ks, PN: 12 ks). The tail extends to at least 70 kpc from the galaxy with a length-to-width ratio of 10. The X-ray tail is luminous ( 1041 erg s-1), with an X-ray gas mass of M⊙. S06 interpreted the tail as the stripped ISM of ESO 137-001 mixed with the hot ICM. The Chandra data also reveal three hard X-ray point sources ( erg s-1) along the tail, and the possibility of all of them being background active galactic nuclei (AGNs) is very small. S06 suggested that some of them may be ultra-luminous X-ray sources (ULXs) born from active star formation in the tail. S07 further discovered a 40 kpc H tail and over 30 emission-line regions downstream of ESO 137-001, up to 40 kpc from the galaxy. S07 concluded that they are giant HII regions in the halo downstream or in intracluster space. Sivanandam et al. (2010) observed ESO 137-001 with IRAC and IRS on Spitzer. A warm ( 160 K) molecular hydrogen tail was detected to at least 20 kpc from the galaxy from the IRS data, at the same position as the bright X-ray and H tail. The total mass of the warm H2 gas is M⊙. As the IRS fields only cover the front part of the X-ray tail, the above warm H2 gas mass is only a lower limit. 8 m PAH emission is also detected from the bright HII regions identified by S07. The Spitzer results may imply a large reservoir of colder gas than the observed warm gas downstream of ESO 137-001, coexisting with the hot ICM ( K) and the H emitting gas ( K).
Obvious follow-ups include deep Chandra exposures and optical spectroscopic observations of the candidate HII regions. In this paper, we present the results from our deep Chandra observation of ESO 137-001 and Gemini GMOS spectroscopic observations. The plan of this paper is as follows: The Chandra and Gemini observations and the data analyses are presented in Section 2. In Section 3, we discuss the X-ray tails of ESO 137-001. Section 4 is on the properties of the surrounding ICM. Section 5 discusses the Chandra point sources and the intracluster HII regions. We also found another 40 kpc X-ray tail in A3627, associated with ESO 137-002, which is discussed in Section 6. The results are discussed in Section 7 and Section 8 contains the summary. We adopt a cluster redshift of 0.0163 for A3627 (Woudt et al. 2008). Assuming H0 = 71 km s-1 Mpc-1, M=0.27, and =0.73, the luminosity distance is 69.6 Mpc, and 1′′=0.327 kpc.
2 New Observations of ESO 137-001
2.1 The Deep Chandra Data
The observation of ESO 137-001 was performed with the Advanced CCD Imaging Spectrometer (ACIS) on June 13 - 15, 2008 (obsID: 9518). Standard Chandra data analysis was performed which includes the corrections for the slow gain change and charge transfer inefficiency (for both the FI and BI chips). We examined the light curve from the part of the S3 chip with weaker ICM emission. No flares of particle background were found. There are also no flares in the light curve of the I2+I3 chips. The effective exposures are 138.2 ks for the BI chips and 140.0 ks for the FI chips. This new Chandra exposure is 18 times deeper than the old one. About 4100 net counts from the thermal gas were collected in the 0.5 - 3 keV band. We corrected for the ACIS low-energy quantum efficiency (QE) degradation due to the contamination on ACIS’s optical blocking filter, which increases with time and varies with position. The dead area effect on the FI chips, caused by cosmic rays, has also been corrected. We used CIAO3.4 for the data analysis. The calibration files used correspond to Chandra calibration database (CALDB) 3.5.3 from the Chandra X-ray Center. We used the new HRMA on-axis Effective Area file, “hrmaD1996-12-20axeffaN0008.fits”, which improves the accuracy of the temperature measurement at 4 keV. The remaining uncertainty in the source flux (up to 10%) would not much affect our conclusions in this work. In the spectral analysis, a lower energy cutoff of 0.4 keV (for the BI data) and 0.5 keV (for the FI data) is used to minimize the effects of calibration uncertainties at low energy. The solar photospheric abundance table by Anders & Grevesse (1989) is used in the spectral fits. Uncertainties quoted in this paper are 1 . We used Cash statistics in this work. We adopted an absorption column density of 1.73 cm-2 from the Leiden/Argentine/Bonn HI survey (Kalberla et al. 2005). If we choose to fit the absorption column from the Chandra spectra (with the PHABS model in XSPEC), the best fits are always consistent with the above value. This absorption column is lower than the previous value from Dickey & Lockman (1990), 2.0 cm-2, which had been used in previous work (e.g., Bhringer et al. 1996; S06).
2.2 The Gemini Data
We obtained optical spectra of the emission-line objects identified by S07 with GMOS on the Gemini south (program ID: 2008A-Q50). Because the field is crowded with interesting sources, three masks had to be used with some sources covered in more than one mask. Observations with the first mask were done on May 3, 2008 (airmass: 1.18 - 1.22, seeing: ). Two exposures (20 minutes each) were taken, with a central wavelength difference of 60 Å in order to cover the inter-chip gaps. Observations with the second mask and the third mask were taken on June 26 and June 27, 2008 respectively (airmass: 1.17, seeing: for June 26; airmass: 1.18, seeing: for June 27). Two exposures (10 minutes each) were taken on each night. All three nights were photometric. The R400 grating + GG455 filter were used, which gives a free wavelength range of 4500 - 8000 Å. We used 1′′ slits for all sources. As queued observations, we used the calibration data of LTT4364 taken on the photometric night of May 27, 2008 for the relative flux calibration.
The GMOS data were reduced with the Gemini IRAF Package (version 1.9.1). We generally followed the standard procedures. Besides the accompanying CuAr arc data, we also used the night sky lines for the wavelength calibration. The latter procedure is the key to derive consistent velocities for the same source from different exposures. In this paper, we present only the velocity information and briefly discuss the nature of these sources (HII regions). The detailed properties of these HII regions will be discussed in a future paper.
3 X-ray Tails of ESO 137-001
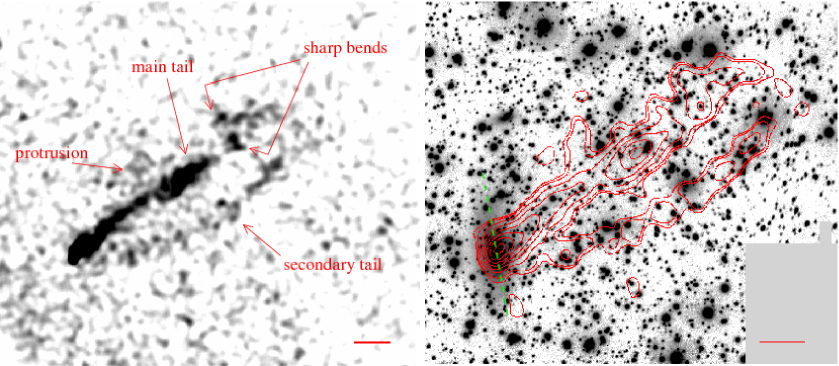
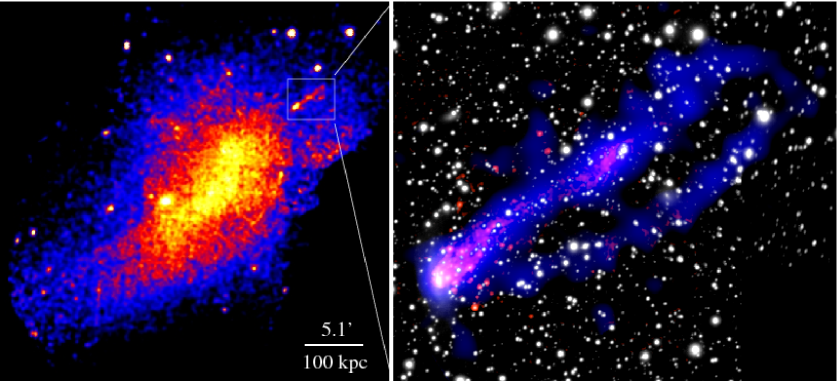
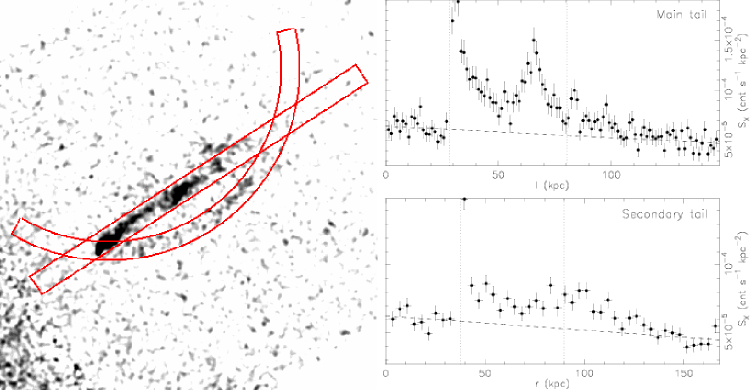
The 0.6 - 2.0 keV Chandra count image is shown in Figure 1, with point sources removed. The image was smoothed to enhance extended low surface brightness features. Compared with images from short Chandra and XMM-Newton exposures, a secondary tail is clearly visible to the south of the main tail. Some substructures are also revealed, including a “protrusion” from the main tail and two sharp bends in the main tail. Also in Figure 1, the X-ray contours from the adaptively smoothed image (exposure corrected, not the one in the left panel) are overlaid on the H+continuum image from the Southern Observatory for Astrophysical Research (SOAR). We also show the XMM-Newton image of the cluster and a composite color image of ESO 137-001’s tails (Figure 2). In the following sections, we discuss the spatial and spectral properties of ESO 137-001’s tails.
3.1 Spatial Structure
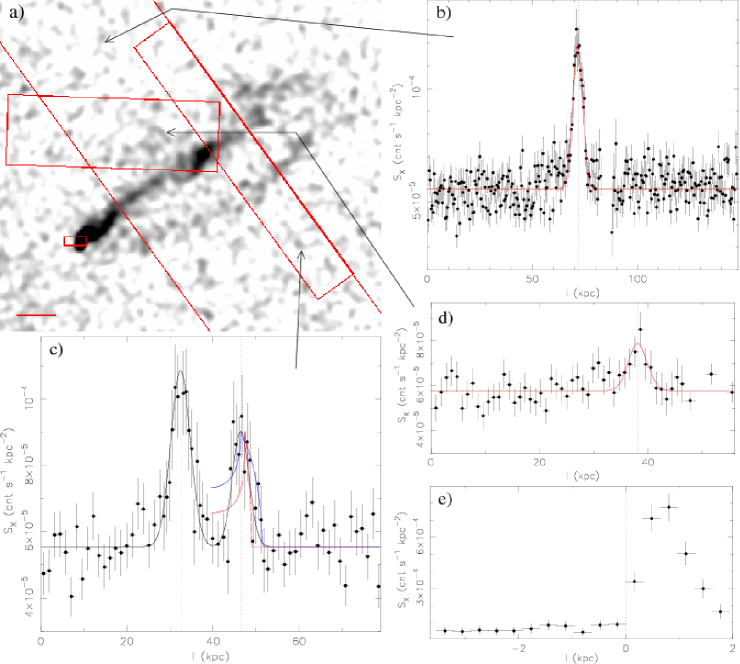
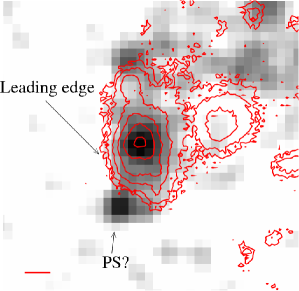
The observed soft X-ray emission of the tails most likely comes from the interfaces between the hot ICM and the cold stripped ISM. Although there are no data for the cold atomic and molecular gas (note the Spitzer data on the PAH emission and the warm molecular H2, Sivanandam et al. 2010), the X-ray surface brightness of the tails reveals a great deal about the stripped ISM. The surface brightness of the tails is quantitatively examined. We first derived the 0.6 - 2 keV surface brightness profiles across some parts of the tails and the leading edge. As shown in Figure 3, both tails are narrow but highly significant features above the local background. Even the “protrusion” is a 4.1 feature. The leading edge (or the contact discontinuity) is very sharp, corresponding to the H edge (Figure 4). The gap between two tails has a similar surface brightness as the local background (Fig. 3b and 3c). For the front part of the gap, the surface brightness is (6.260.30) cnts s-1 kpc-2, while the local background is (5.880.27) cnts s-1 kpc-2. The low surface brightness of the gap has implications for the 3D structure of the stripped ISM tail. One possibility for the observed double tails is the projection effect of one broad cold ISM tail. According to this interpretation, the 3D structure of the soft X-ray emission might be a cylindrical shell that produces double tails in the projected surface brightness. As shown in Figure 3, such a configuration fails to simultaneously account for both the low surface brightness of the gap and the observed widths of two tails. The observed emission level between tails is similar to that outside tails. Basically, the width of the cylindrical shell required to make the central emission dim also makes each peak unacceptably narrow in relation to the observed profiles. Thus, the two X-ray tails are most likely detached. This is also supported by the Spitzer data (Sivanandam et al. 2010). The 8 m PAH emission only appears in the first 20 kpc of the main tail. The IRS data only cover a small field downstream but no enhanced warm H2 emission is present at the front part of the gap. Eventually we need HI and CO data to better reveal the distribution of the cold ISM downstream of ESO 137-001.
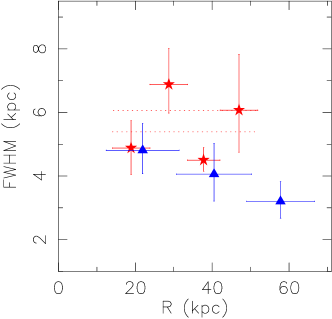
In principle, the surface brightness profiles along the tails reflect the stripping history. As shown in Figure 5, both tails have wiggles and substructures along the (time) axis. However, the unknown conversion from the X-ray emission to the mass of the stripped ISM (filling factor, detail of the emission spectra, etc.) makes this difficult with only the X-ray data. A more complete picture can be obtained with the HI and CO data. From Figure 5, the total linear length of the whole tail system is at least 4.2′ or 80 kpc. We also measured the widths of the main tail in four segments (before sharp bends) and the widths of the secondary tail in two segments. The model is composed of a Gaussian and a flat local background. As shown in Figure 6, the widths of both tails do not increase with the distance from the galaxy. This conflicts with simulations (e.g., RB08; Kapferer et al. 2009), as further discussed in Section 7.2. If ESO 137-001 is moving supersonically, a bow shock may form. The local sound speed is 1263 ( / 6 keV)1/2 km/s. For a Mach number of 1.1 - 3, the predicted position of the bow shock is 20 from the leading edge (or the contact discontinuity). No such shock front is detected in the Chandra exposure. The enhanced surface brightness would be much weaker in projection on the sky, especially if ESO 137-001 is farther from the cluster center than the projected position.
3.2 Spectral Properties
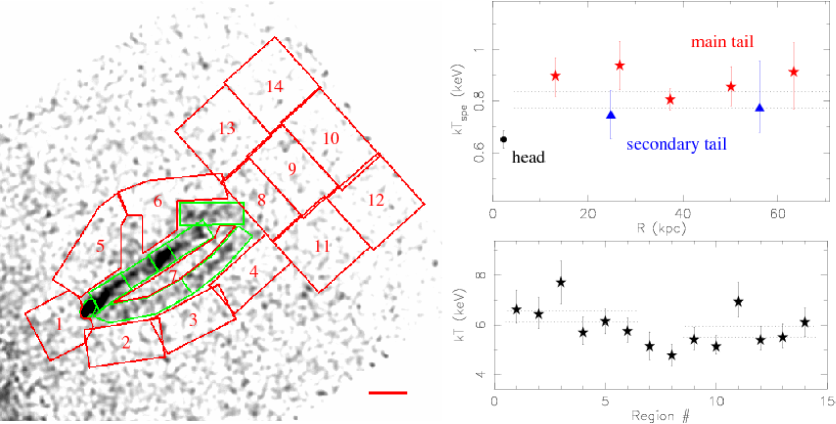
With this deep Chandra exposure, for the first time spatially-resolved spectroscopy can be done for X-ray stripping tails of a cluster late-type galaxy. We measured gas temperatures in five regions of the main tail and two regions of the secondary tail (Figure 7). The background is from the local source-free regions. A single APEC model with Galactic absorption was used. We emphasize that the measured temperatures are only spectroscopic temperatures as the intrinsically multi-phase gas is fitted with a single- model. In fact, a hard X-ray excess generally exists in the spectral fits, which implies the existence of hotter components. However with limited statistics, we elected to keep the spectral model simple. As shown in Figure 7, the variations of spectroscopic temperatures along both tails are small. In fact, both tails have consistent temperatures.
Since temperatures derived from individual regions are similar, the total spectrum of two tails (still excluding the “head” region) was also examined with several models (Figure 8 and Table 1). This observation collects 3444 net counts from the thermal gas of the two tails in the 0.5 - 3 keV band. While the fit with a single- model is acceptable, the addition of a second component (either another thermal component or a power-law component) produces better fits. We also tried the XSPEC model CEMEKL, which allows a power-law distribution of the emission measure for multi- gas. We consider the spectral results shown in Table 1 as evidence for multi-phase gas, especially as the single- model produces a very low abundance. Adding another or more thermal components can increase the abundance to the solar value. Nevertheless, the double APEC or the CEMEKL models are no more than a phenomenological way to describe the data. It is still unclear what emergent spectrum mixing will produce. There are more complications, like the non-equilibrium ionization effect and the intrinsic absorption. Generally, ionization equilibrium requires the collisional ionization parameter cm-3 s. For cm-3, 3 - 32 Myr, which is comparable to the age of the X-ray tails.
The X-ray gas mass of the tails can be estimated. The main uncertainties are the geometry (or the filling factor) of the X-ray emitting gas and the abundance of the gas. The filling factor of the soft X-ray emitting gas depends on the mass and configuration of the stripped cold ISM gas in the tails. The soft X-rays may originate from the interfaces between the ambient hot ICM and the stripped cold ISM. A fragmented cold ISM tail has larger surface area so the filling factor of the soft X-ray emitting gas would be larger. Both uncertainties can be constrained by the assumed pressure equilibrium with the ambient ICM. In the following, we present the estimates from the one- fit, the two- fit and the CEMEKL fit. We assume both the main tail and the secondary tail are cylinders with a length of 80 kpc and radii of 3.9 kpc and 3.4 kpc respectively. The “head” and “protrusion” regions are not included. With the result from the one- fit (the first row of Table 1), the total X-ray gas mass is 2.0 M⊙, where is the filling factor of the soft X-ray emitting gas. If the estimate is done on the same individual regions as the spectral analysis (Figure 7), the total gas mass only decreases by 3%. The electron density ranges from 0.0080 cm-3 to 0.017 cm-3 along the tails. However, the abundance of the X-ray gas is too low for the one- fit, which results in gas densities that are too high. The ambient ICM electron density and temperature in the projected position of ESO 137-001’s tails is cm-3 and 6.3 keV respectively. This puts an upper limit of 0.010 cm-3 on the electron density of the tail gas (for a temperature of 0.8 keV) if pressure equilibrium is assumed. Thus, the one- model is not sufficient.
Do the two- fit and the CEMEKL fit produce more reasonable results? We first used the result in the fourth row of Table 1, where the abundance of the lower temperature component is fixed at the solar value and the abundance of the higher temperature component is fixed at the value of the surrounding ICM. Assuming pressure equilibrium between these two components, it is found that the hotter component occupies 97% of the volume of the soft X-ray emitting gas. The electron density of the cool and hot components is 0.018 cm-3 and 0.0071 cm-3 respectively. The total X-ray gas mass is 1.4 M⊙. However, the gas pressure in the tail is 50% higher than the maximum ICM pressure of the surroundings. This problem cannot be solved by increasing the abundance of the hotter component in the spectral fit, which will further increase the ISM pressure. We then tried the CEMEKL fit (the eighth row of Table 1). However, the X-ray tail is at least 3.2 times over-pressured to the surrounding ICM, under an isobaric condition. The total X-ray gas mass is 1.1 M⊙. Therefore, either these models are not adequate, or there is dynamic pressure (e.g., turbulence) besides the thermal pressure. Without better understanding of the tail spectrum and the contribution of the cold ISM in the tails, it is difficult to much improve the above estimates. We summarize ESO 137-001’s properties from the current data in Table 2, along with those of ESO 137-002 (Section 6).
4 Properties of the Surrounding ICM
We also examined the spectral properties of the ICM around ESO 137-001’s tails. We followed the same approach as used in Sun (2009) for ESO 137-006 to determine the local soft X-ray background that is dominated by the Galactic emission (note the Galactic latitude of -7 deg). With the soft X-ray background determined, ICM temperatures were determined in 12 regions around ESO 137-001’s X-ray tails (Figure 7). The projected ICM temperature is about 6 keV around ESO 137-001’s tails. Region #8 has the lowest temperature, which implies the presence of a faint ISM component in that region. Indeed, the 0.6 - 2 keV surface brightness at region #8 is a bit higher than that in regions #11 and #13, (5.530.13) cnts s-1 kpc-2 vs. (5.230.10) cnts s-1 kpc-2. Region #7 may include some small “protrusions” from both tails (Figure 1), which can explain its relatively lower temperature than regions #2 - #6. The ICM abundance can also be determined from a simultaneous fit to the spectra of all regions, 0.200.06 solar. The electron density of the surrounding ICM is 0.0010 cm-3 - 0.0014 cm-3 in the projected positions of the tails (Bhringer et al. 1996). The total ICM thermal pressure is 1.8 dyn cm-2 for = 10-3 cm-3 and =6 keV. The ram pressure is 4.4 (/1500 km/s)2 dyn cm-2 for = 10-3 cm-3. Both are high enough to strip most part of disk gas, except for the very core (e.g., Roediger & Brggen 2005).
5 Intracluster HII Regions and Ultraluminous X-ray Sources
5.1 Intracluster HII Regions and the Gemini Spectra
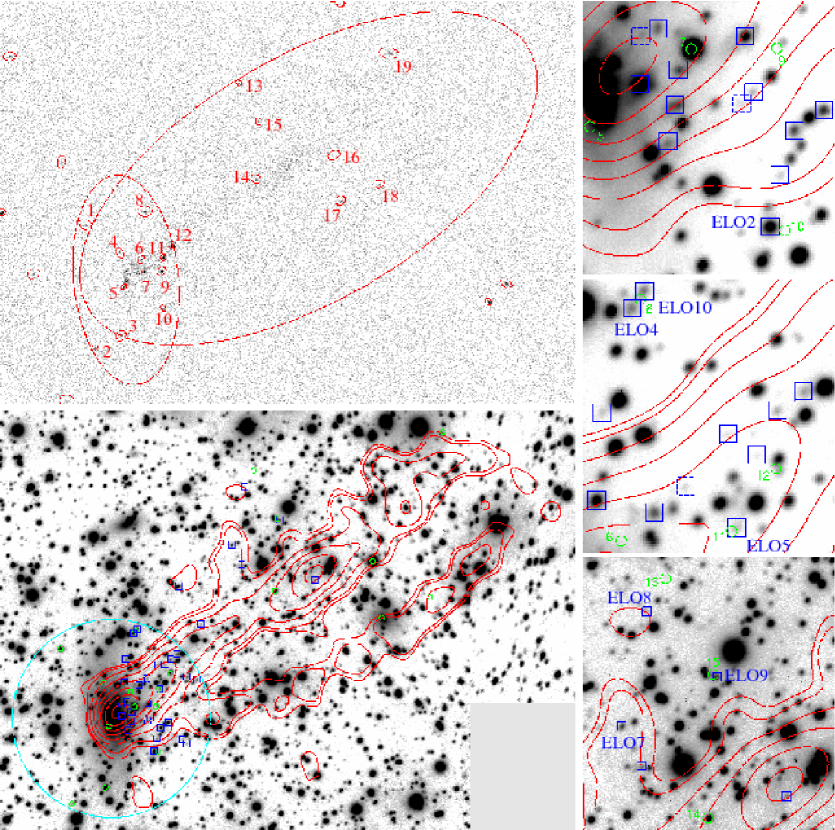
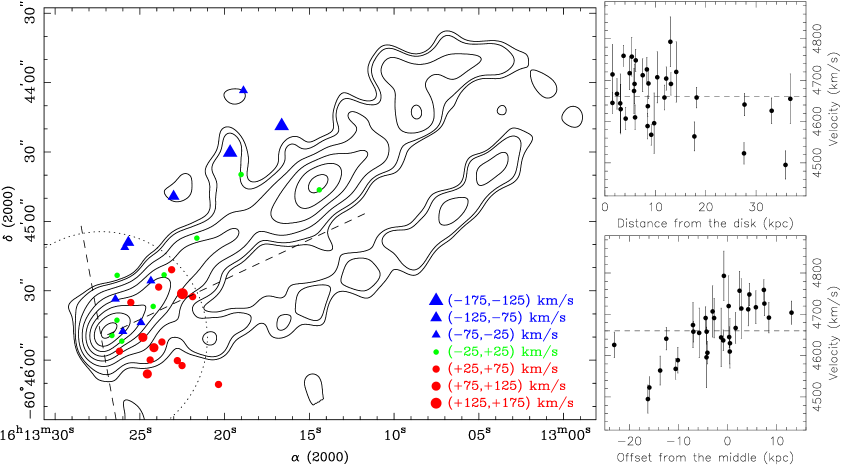
S07 identified 29 strong candidate HII regions. Six more sources were also identified as possible HII regions. The Gemini GMOS observations were able to cover thirty-three of them (solid blue squares in Figure 9). Only two sources (dashed blue squares in Figure 9) were not observed. Both of them are strong candidates but are faint and close to ESO 137-001. The GMOS spectra unambiguously confirm the association of these 33 sources (27 strong candidates + 6 weaker candidates in S07) with ESO 137-001 as their velocities are all within 200 km/s of ESO 137-001’s. The heliocentric velocity map of these 33 HII regions is shown in Figure 10. In Figure 10, we also plot their velocities vs. their distances to the major axis of the galaxy or the middle line of the bow-like front of HII regions. We used a system velocity of 4660 km/s for ESO 137-001, which is the weighted average from the velocities derived by Woudt et al. (2004) and S07. The velocities of these HII regions span a small range ( 300 km/s) with a dispersion of 54 km/s. In fact, this small velocity range is comparable to the radial rotation velocity of the residual H nebula at the center of ESO 137-001, 80 km/s from our SOAR GOODMAN spectra that will be presented in a future paper. After ISM is removed from the galactic disk, it is subject to turbulence in the wake. Combined with the residual rotational motion, the range of the radial velocities of stripped ISM clouds should become substantially larger than the range of the rotation velocity (e.g., RB08). However, that is not what we observed with the velocities of HII regions as tracers. In fact as shown in Figure 10, the imprint of the rotation velocity pattern is still present in the velocity map of these HII regions.
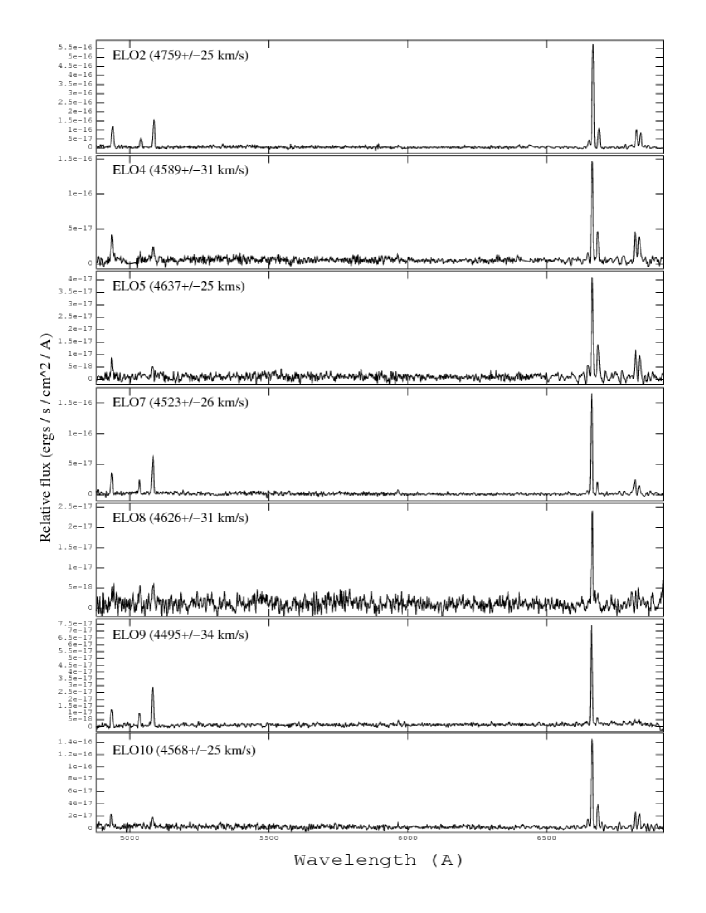
Some example spectra of these HII regions are shown in Figure 11, including several sources that are most distant from ESO 137-001. The low [OI] 6300 / H and [NII] 6584 / H ratios are typical of giant HII regions. The detailed properties of these HII regions (e.g., line equivalent width, line ratios, star-formation rate, age, metallicity and total mass) will be presented in a future paper with the results from our HST data.
5.2 Chandra Point Sources
The deep Chandra exposure also reveals many point sources, as shown in Figure 9. We focus on X-ray point sources in ESO 137-001 or around its X-ray tails (within the two elliptical regions in Figure 9). Nineteen point sources are detected. Their positions and fluxes are listed in Table 3. The 0.5 - 2 keV limiting flux is erg s-1 in the region of interest (with eight counts in the 0.5-2 keV band). The expected X-ray source density above this limiting flux is per deg2 (Kim et al. 2007). For the two elliptical regions (9.66 arcmin2), the expected number of background sources is four, while 19 point sources are detected. The contribution of Galactic sources should not be neglected as ESO 137-001 is located at a low Galactic latitude (-7 deg). Indeed, six Chandra point sources are positionally coincident with bright star-like objects. However, an excess of X-ray point sources still exists, especially in the immediate downstream region of ESO 137-001 where most HII regions are. We can divide these point sources into three groups, sources 1-3 that are upstream of the galaxy, sources 4-12 that are around the disk plane or downstream of the galaxy (but still within the 15 kpc radius halo in projection) and sources 13-19 that are unbound and near the X-ray tails. The latter two groups are of most interest here. The region immediately downstream of the galaxy (but still within the galactic halo) has nine X-ray sources, while only 0.5 are predicted from the Log N - Log S relation ( 1.1 arcmin2). The unbound tail region has seven X-ray sources, while 3.3 sources are expected from the Log N - Log S relation ( 7.9 arcmin2). Three sources are likely of stellar origin (14, 16 and 17), while source 15 is close to a confirmed HII region. If we take 3 stars in the unbound tail region as the number density of stars, only 0.4 stars are expected in the immediate downstream region. In fact, only source 7 coincides with a bright star. Thus, the excess of X-ray point sources in the immediate downstream region is significant.
We examined the optical counterparts of these X-ray point sources and list the results in Table 3. The SOAR images (, and H bands) that are presented in S07 are used. With seven sources (across the S3 chip) detected in both the X-rays and the optical images, the astrometry can be determined to . There are four Chandra sources (8, 10, 11 and 15) that are within 2′′ (or 0.65 kpc) of the confirmed HII regions and have no other optical counterparts in the SOAR images. We consider them strong candidates for intracluster X-ray binaries, while a 0.5 kpc offset can be produced by a 100 km/s kick velocity in 5 Myr. Sources 9 and 12 are 0.85 - 1.3 kpc from confirmed HII regions and do not fall on any optical sources. They are also candidates for intracluster X-ray binaries. If associated with ESO 137-001, their 0.3 - 10 keV luminosities are erg s-1 (Table 3), which makes them intracluster ULXs. The X-ray spectra of the bright point sources were also examined (Table 3). It is true that the chance match between HII regions and X-ray point sources is high in the immediate downstream region. There is a 52% chance that an X-ray source will be within 2′′ of an HII region there. However, the excess of X-ray sources is also significant there.
As ULXs are often found around young massive star clusters, it may not be a surprise to have intracluster ULXs around intracluster massive star clusters. We can further examine the relation between the X-ray luminosities of these putative ULXs and the total star-formation rate of the HII regions. The total 2-10 keV luminosity of sources 8, 10, 11 and 15 is 6.5 erg s-1. If sources 9 and 12 are added, the total luminosity is 2.7 erg s-1. From S07, the total SFR of these 33 HII regions is 0.7 M⊙/yr, assuming an intrinsic extinction of 1 mag for the H emission. This SFR and the lower value of the X-ray luminosity fall well on the relation derived by Grimm et al. (2003). Even for the higher value of the X-ray luminosity (when sources 9 and 12 are included), agreement can be achieved if the intrinsic extinction is higher in these HII regions and the SFR in the past was higher.
6 ESO 137-002
Another X-ray tail of a late-type galaxy was serendipitously found in our ACIS-S observation of ESO 137-006 (the BCG of A3627, Sun 2009). It is associated with ESO 137-002, a redder and more massive disk galaxy than ESO 137-001 (Table 2). ESO 137-002 is only 110 kpc from the cluster’s X-ray peak in projection but its radial velocity is 900 km/s larger than A3627’s. The tail is near the corner of the I3 chip that is 10.8′ from the optical axis of the observation (Figure 12 and 13). ESO 137-002 was also covered by one of our previous Chandra ACIS-I observations of A3627 (obsID: 4958, PI: Jones) but the exposure is too short (14 ks) to reveal the X-ray tail. We summarize the properties of ESO 137-002’s tail in this paper, mainly for the purpose of comparison with ESO 137-001’s tails.
6.1 The Chandra and SOAR Data
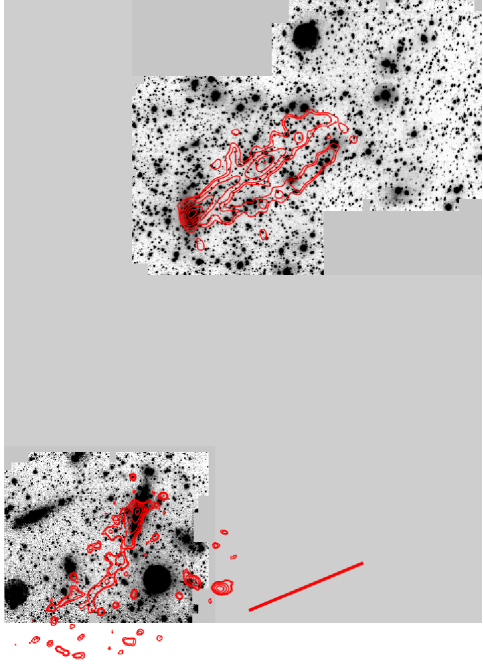
The details of the Chandra observation of ESO 137-006 (obsID 8178) and of the data analysis were presented in Section 5 of Sun (2009). The effective exposure was 57.3 ks for the I2 chip. A significant X-ray tail behind ESO 137-002 is revealed, which in fact can also be seen in the XMM-Newton data (Figure 2).
Being aware of its X-ray tail, we observed ESO 137-002 (=0.0191) with the 4.1-m SOAR telescope on Cerro Pachon on Apr. 18, 2008 (UT). The observations were made with the SOAR Optical Imager (SOI), which covers a 5.2 field of view. The night was photometric and seeing was very good, 0.45′′-0.65′′. The airmass was 1.16 - 1.20. We took three 800-sec exposures with the CTIO 6693/76 filter (H band) and two 600-sec exposures with the CTIO 6606/75 filter (H band) 111http://www.ctio.noao.edu/instruments/filters/index.html. Both narrow-band filters are 2 inches 2 inches, so the non-vignetted field is only . Dithers of 15 were made between exposures. Each image was reduced using the standard procedures with the IRAF MSCRED package. The pixels were binned 2, for a scale of 0.154′′ per pixel. Dome flats were used. The US Naval Observatory (USNO) A2.0 catalog was used for the WCS alignment, which was done with WCSTools. The spectrophotometric standards were LTT 4364 and EG 274 (Hamuy et al. 1994).
6.2 ESO 137-002’s Properties and Its X-ray Tail
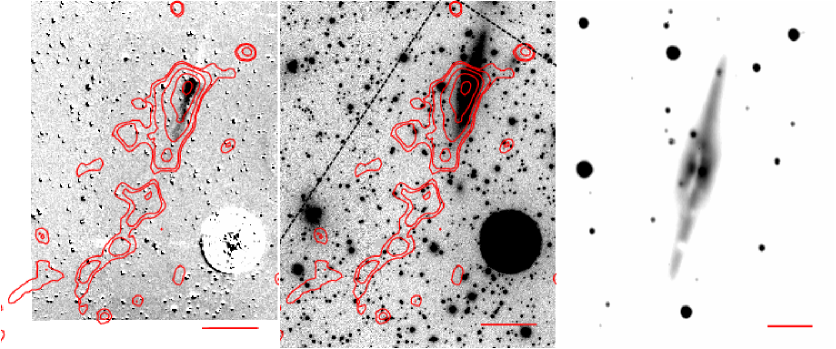
ESO 137-002 is a disk galaxy with a dust lane across its bulge (Figure 13). It is a more massive galaxy than ESO 137-001 and has a larger radial velocity component than ESO 137-001 (Table 2). ESO 137-002 is 120 kpc (or 6.15′) from ESO 137-001 in the plane of sky. Assuming the same ratios of the halo mass to the stellar mass, the tidal radius [] is 0.32 -0.41 , where is the distance between the two galaxies. This value is much larger than the tidal truncation radius of ESO 137-001 ( 15 kpc, truncated by the cluster potential) estimated by S07. Even if the two galaxies are only separated by their projected distance, ESO 137-001’s gravity is over 6 times ESO 137-002’s within 15 kpc radius of ESO 137-001’s nucleus. Given the large difference of their radial velocities ( 1080 km/s), their actual spatial separation should be larger than the projected distance, especially at the time when stripping began. Thus, the tidal interaction between two galaxies should be small. There are indeed no tidal features upstream of ESO 137-001 and around ESO 137-002. Their X-ray tails are also pointing away from each other.
ESO 137-002’s X-ray tail can be traced to at least 40 kpc from the nucleus. Since it is 10.6′ off-axis and the galaxy has a large radial velocity component, the actual length of the X-ray tail may be larger. The 3 - 8 keV image clearly reveals a bright nuclear source. We examined ESO 137-002’s X-ray spectral properties in two regions, one within 17.4′′ of the nucleus (note the 90% encircled energy radius of the point-spread function (PSF) at 1.49 keV is 14′′ there) and the other one excluding the nuclear region. The first region has 46030 net counts in the 0.5 - 10 keV band, while the second region (the tail region) has 25329 net counts in the 0.5 - 2 keV band. The spectra are shown in Figure 14 and the spectral fits are shown in Table 4. ESO 137-002 hosts a Seyfert2-like nucleus. The limited statistics on the soft X-rays, combined with the poor angular resolution in the source position, prevent any definite conclusion on the gas properties. A single- fit implies a surprisingly hot tail with 2 keV. The gas temperature can be reduced to 1.1 keV if a power-law component is included. However, the power-law component has to be very strong (Table 4), given the small area of the tail region (0.81 arcmin2, compared with the case of ESO 137-001). Like ESO 137-001’s tail, the abundance of ESO 137-002’s gas cannot be reliably constrained. The X-ray gas mass of the tail can also be estimated. We assume the tail as a cylinder with a length of 40 kpc and a radius of 2.5 kpc. Using the result from the one- fit (the first row of Table 4), the total gas mass is 4.2 M⊙, where is the filling factor of the soft X-ray emitting gas. This may be an over-estimate as the gas abundance is too low. In fact, the average electron density is 0.0188 cm-3. The surrounding ICM has a temperature of 6.3 keV, similar to that around ESO 137-001. The ICM electron density at the projected position is cm-3 (Bhringer et al. 1996). Thus, the X-ray tail would be 3 times over-pressured. With the addition of a power-law component and a fixed abundance at 1 solar (the third fit in Table 4), the ISM electron density and the total gas mass reduce to 0.0055 cm-3 and 1.2 M⊙ respectively. The last spectral fit may largely under-estimate the contribution from the gas (see the difference of luminosities in Table 4). Thus, we take an average mass estimate of M⊙.
The net H image of ESO 137-002 also shows an H tail at the same position as the X-ray tail, extending to at least 20 kpc from the nucleus (Figure 13). A sharp H edge is located only 1.1 kpc from the nucleus. H absorption is found upstream of the edge in the disk plane. We also searched for emission-line objects in the field from the narrow-band data, hoping to find similar intracluster HII regions as those downstream of ESO 137-001. However, no such emission-line regions have been found in the sources detected in the H band. The upper limit on the H luminosity (no intrinsic extinction) is 1038 erg s-1 and the upper limit on the equivalent width of the H line is 60 Å. Assuming a metallicity of 0.4 solar and applying the Starburst99 model (Leitherer et al. 1999), this upper limit gives a lower limit of 7 Myr for the age of any faded intracluster HII regions. This may imply that ESO 137-002 is in a more advanced stage of stripping and evolution than ESO 137-001, which is consistent with the likely hotter X-ray tail of ESO 137-002 and ESO 137-002’s redder optical color. ESO 137-002 is a more massive galaxy than ESO 137-001 and may be undergoing edge-on stripping, which indeed takes longer than the face-on stripping (e.g., RB08).
7 Discussion
7.1 X-ray Tails of Late-type Galaxies and Mixing
While the paucity of luminous X-ray tails of late-type galaxies in nearby clusters has been known (e.g., Sun et al. 2007a), the discovery of ESO 137-001’s double X-ray tails is a surprise. M86 also has double X-ray tails and Randall et al. (2008) interpreted it as the consequence of the aspherical potential of M86 and M86’s orbit. M86 is an early-type galaxy so its potential structure is different from ESO 137-001’s and its tail is only composed of the stripped hot ISM. M86’s tails are in fact connected to the “plume” on the north of the galaxy and are located at larger distance from the galaxy, instead of coming from the galaxy directly like ESO 137-001’s. Moreover, a spectacular H complex connecting M86 and the nearby disturbed spiral NGC 4438 was recently discovered by Kenney et al. (2008). Some H emission also extends to the position of M86’s tail. Thus, tidal interaction may also be important for M86’s X-ray tail. There also appears to be a split feature that resembles a double tail in NGC 4438’s Chandra image (Machacek et al. 2004; Randall et al. 2008). However, one part of the split feature is almost along the distorted disk plane and tidal interaction should be important in this case (Machacek et al. 2004; Kenney et al. 2008). NGC 4438 is 3 times more luminous than ESO 137-001 in the band. Its truncated halo should be larger than ESO 137-001’s ( 15 kpc in radius, S07), also because the Virgo cluster is less massive than A3627. The features in NGC 4438 only extend to 11 kpc from the nucleus, clearly within its halo. The other late-type galaxy in the proximity, NGC 4388, has many H filaments and a spectacular HI tail (Yoshida et al. 2002; Oosterloo & van Gorkom 2005). A faint X-ray extension can be traced to 14 kpc from the nucleus in the direction of the HI tail, from the Chandra and XMM-Newton data. There is also an X-ray extension to east in the disk plane, which creates the appearance of double tails (Randall et al. 2008). NGC 4388 is 1.5 times more luminous than ESO 137-001 in the band so similar to NGC 4438, its X-ray tail is still within its halo. Thus, we do not consider the one-sided X-ray features in NGC 4438 and NGC 4388 to be X-ray double tails based upon the current data. They are clearly much fainter than ESO 137-001’s tails, especially given ESO 137-001’s much larger distance ( 4.3 times) and the much higher absorption to the direction of ESO 137-001. We can also define strong X-ray tails as one-sided features outside of the tidal truncation radius of the galactic halo (like the tails of ESO 137-001 and ESO 137-002), in order to distinguish them from the weak X-ray tails of NGC 4438 and NGC 4388.
The observed X-ray emission of the tails is likely from the interfaces of the hot ICM and the cold stripped ISM, reflecting the multi-phase nature of mixing. Although the detailed mixing process that determines the emergent X-ray spectra is poorly understood, the observed tail temperature may be related to the mass-weighted temperature that is usually adopted in simulations, , where and we assume that . For the X-ray tails of ESO 137-001 and ESO 137-002, if we assume is the observed spectroscopic temperature. However, it is easy to find out that the mass-weighted temperature is always larger than the spectroscopic temperature derived by fitting the observed spectra with a single- model (). We examined this with the CEMEKL and APEC models. For the CEMEKL model, . Assuming an isobaric condition and for -1,
| (1) |
For -0.5, 1/3 . It is also reasonable to assume that . However, with a series of XSPEC simulations, we found that . For example, = 0.5 - 1 keV when -0.5 0.5, while = 2 - 3.6 keV for = 6 keV. This is not surprising as is mainly determined by the centroid of the iron-L hump at low temperatures, which biases low. As long as there are significant emission components at = 0.4 - 2 keV, the iron-L hump will be strong to make deviated from . On the other hand, the parameter in the CEMEKL model may reflect the age of the X-ray tail. Our simulations indeed show that increases monotonously with . From the CEMEKL fits to the spectra of ESO 137-001 and ESO 137-002, ESO 137-002’s stripping event may indeed be older. The above simple estimate implies that is a certain fraction of the ICM temperature. The luminosity of the X-ray tail should also increase with the magnitude of the ambient ICM pressure, under an isobaric condition. Thus, the X-ray tails of late-type galaxies in groups and the outskirts of poor clusters may have temperatures (e.g., 0.4 keV) and densities too low to be bright in the Chandra and XMM-Newton energy bands. This helps to explain the paucity of strong X-ray tails of late-type galaxies in nearby clusters (e.g., Sun et al. 2007a). Other factors include the generally high cluster background and the small number of late-type galaxies in the Chandra field of nearby clusters as the covered cluster volume is small.
With the above scenario, the X-ray tail of a late-type galaxy is simply the manifestation of its cold ISM tail embedded in the hot ICM. Optical line emission is also expected and is indeed detected, e.g., the H tails of ESO 137-001 and ESO 137-002 (S07 and Section 6). HI observations of A3627 were made with Australia Telescope Compact Array (ATCA) in 1996 and no HI emission was detected from ESO 137-001 or ESO 137-002 (Vollmer et al. 2001a). The 3 detection limit is 3 mJy/beam in one velocity channel with a beamsize of 30′′ (Vollmer et al. 2001a). Adjusting to the cluster distance used in this work and assuming a linewidth of 150 km/s (Vollmer et al. 2001a), the corresponding HI gas mass limit is M⊙ per beam. While this limit is not weak for the remaining HI gas in the disks of ESO 137-001 and ESO 137-002 (roughly within one beam), the X-ray tails of ESO 137-001 and ESO 137-002 span over 7 - 15 times the beam size so a lot of diffuse HI gas can remain undetected downstream of the galaxy. In fact, with the sensitivity of the available ATCA data (an HI column density limit of 2 cm-2), four of the seven HI tails in the Virgo cluster found by Chung et al. (2007) and the long HI tail of NGC 4388 (Oosterloo & van Gorkom 2005) would not be detected. Clearly deeper HI observations are required, although the nearby bright radio source PKS 1610-60 (43 Jy at the 1.4 GHz) makes the task difficult (8′ - 14′ from ESO 137-001 and ESO 137-002). Both ESO 137-001 and ESO 137-002 are expected to host a significant amount of atomic and molecular gas initially. From Blanton & Moustakas (2009), the total neutral plus molecular gas fraction (relative to the stellar mass) is 70% for ESO 137-001 and 30% for ESO 137-002. Assuming a type of Sc and a blue-band diameter of 20 kpc, the expected HI mass of ESO 137-001 is M⊙, from the empirical relation derived by Gavazzi et al. (2005). Similarly for ESO 137-002 (a type of Sa and a blue-band diameter of 30 kpc), the expected HI mass is M⊙. Thus, ESO 137-001 is expected to have M⊙ of cold ISM initially, while ESO 137-002 is expected to have M⊙ initially. These numbers can be compared with the X-ray gas mass in their X-ray tails (Table 2). Sivanandam et al. (2010) detected the mid-IR emission from warm H2 gas ( 150 K) in the galaxy and the first 20 kpc of the main tail, with a total mass of M⊙. The H2 lines that IRS detects are rotationally excited lines that are generated very efficiently. The warm gas they probe is likely a small fraction of the total H2 gas, if the bulk of the molecular gas is still cold. Deep HI and CO observations are required to recover the bulk of the cold gas in ESO 137-001, ESO 137-002 and their wakes.
The same question can also be asked to other cluster late-type galaxies with signs of stripping. Does a stripped ISM tail show up in HI, H and X-rays simultaneously? We attempt to summarize the known examples of stripped tails for cluster late-type galaxies. A Venn diagram is plotted in Figure 15. While a lot of stripped tails are known for cluster late-type galaxies, there is currently little known overlap between different bands, especially between X-ray tails and HI tails. This may be due to the lack of sufficient data, either in X-rays (e.g., for the Virgo galaxies with HI tails, Chung et al. 2007) or in HI (e.g., the two galaxies in this paper). We are pursuing XMM-Newton data for the Chung et al. (2007) galaxies and deeper ATCA data for the A3627 galaxies to better address this question. On the other hand, there are various reasons that A one-to-one correlation may not exist in every case, even with better data. Depending on its age and the surrounding ICM, an ISM tail may emit predominantly in the HI band or the X-ray band. Soft X-ray emission of the tail may only be bright in high-pressure environment. We also understand little about the details of mixing. It may be related to the mean free path of particles and the coherence length of the magnetic field, which would introduce a radial dependence on the efficiency of mixing. Nevertheless, we first need better data to update the Venn diagram shown in Figure 15.
Deep X-ray data alone, like ESO 137-001’s, can reveal some thermal history of the stripped ISM. One surprise from ESO 137-001’s X-ray data is the constancy of the spectroscopic temperatures along both tails (Figure 7). Indeed extra care is required to interpret this spectroscopic temperature as it is mainly determined by the centroid of the combined iron-L humps from multi- gas. Nevertheless, the possible spectral difference between ESO 137-001’s tails and ESO 137-002’s tail is intriguing. This difference, if confirmed, combined with the temperature constancy of ESO 137-001’s tails, puts a constraint on the heating timescale of the stripped cold ISM. Clearly the knowledge of the HI/CO gas distribution in these two galaxies will help to tighten the constraint, although it is certain that this timescale depends on the ICM temperature.
7.2 Comparison with Simulations
After the initial analytic work by Gunn & Gott (1972), many simulations have been run on the ram-pressure stripping of late-type galaxies in clusters (e.g., Abadi et al. 1999; Schulz & Struck 2001; Vollmer et al. 2001b; RB08; Kapferer et al. 2009; Tonnesen & Bryan 2009 and references in those papers). Recent efforts surpass the early ones in many respects, e.g., resolution, time steps, realistic treatment of the galaxy orbit and some important baryon physics (e.g., cooling and star formation). We mainly compare our results with recent simulations of three groups, the Innsbruck group with the GADGET-2/SPH code (Kronberger et al. 2008; Kapferer et al. 2009), the Bremen group with the FLASH/AMR code (Roediger et al. 2006; RB08) and the Columbia group with the Enzo/AMR code (Tonnesen & Bryan 2009). The GADGET-2 simulations include recipes for cooling, star formation and stellar feedback. The model galaxies run through a wind tunnel with a constant pressure. The FLASH simulations are non-radiative and model the flight of a disk galaxy through a galaxy cluster with realistic ICM and potential distributions. The Enzo simulations include cooling but not feedback (Tonnesen & Bryan 2009). To mimic effects of some heating processes not in simulations, they impose a minimum temperature floor. The model galaxy is also subject to a constant ram pressure. The inclusion of cooling is important, as it indeed happens as revealed from our data (the intracluster HII regions and star clusters) and it has profound effects in simulations (Kapferer et al. 2009; Tonnesen & Bryan 2009). Cooling also naturally adjusts the ISM distribution on the disk plane, creating multi-phase ISM with enhancement and holes (Kapferer et al. 2009; Tonnesen & Bryan 2009), which is not present in the non-radiative runs. However, cooling needs to be offsetted by stellar feedback. Unknown efficiencies of transport processes (viscosity and heat conduction) because of unclear strength and configuration of magnetic field, plus the other uncertainties in the prescriptions of star formation and stellar feedback, make the tasks difficult (e.g., Tonnesen & Bryan 2009). We emphasize that comparison at the current stage is not straightforward as galaxies in these simulations are always more massive than ESO 137-001 and high pressure environment was not explored in all simulations. We also caution that it is best to compare the observational data with the mock data generated from simulations. Kapferer et al. (2009) and Tonnesen & Bryan (2009) attempted to create X-ray mock data but more work is required, e.g., folding with the actual Chandra response, projection on the ICM background and the use of spectroscopic temperature rather than mass-weighted temperature (Section 7.1).
Tails generally appear longer and wider in simulations than in observations. The simulations by Kapferer et al. (2009) show that the X-ray tails can be traced to 300 kpc from a galaxy that is about 4 times more massive than ESO 137-001, with an ambient pressure similar to ESO 137-001’s. The simulated X-ray tails are also very clumpy, with widths generally increasing with the distance from the galaxy. The FLASH simulations also produce longer tails than observed in this work, but are difficult to compare with the X-ray data directly. As RB08 pointed out, the observed tail length depends on the mass-loss per orbital length, which is the highest in poor clusters as galaxies in rich clusters move too fast and the ram pressure in groups is not high enough. The FLASH simulations also show tail flaring (i.e. increasing width with distance from the galaxy downstream) in all cases. The velocity perpendicular to the direction of the ram pressure comes from the random motion of the ICM, the disk rotation and turbulence in the wake. For a rotation velocity of 100 km/s over 50 Myr, the offset is 5 kpc, which is not small in ESO 137-001’s case as its tails are narrow. The Tonnesen & Bryan (2009) simulations produce long but narrower tails. The tails are also very clumpy. None of these simulations can reproduce the double tails of ESO 137-001. The simulated tails are generally too clumpy with strong turbulence. This simple comparison may point to a higher ICM viscosity than present in the simulations. The Reynold number is , where is the Mach number, is the size of the remaining galactic gas disk and is the mean free path of particles in the ICM. For unmagnetized gas, 10 kpc around ESO 137-001. The radius of the remaining H disk and the galactic X-ray emission is only 1.7 kpc (S07). Thus, the Reynold number is on the order of unity which implies a laminar flow. Of course the presence of magnetic field would increase the Reynold number. In the simulations by Kapferer et al. (2009), a bright spot in the X-ray images is always found at distances of a few tens of kpc from the galaxy, caused by compressional heating. This feature can be compared with the bright spot in the main tail (Figure 1 and 5). However, the location of this feature is generally too far from the galaxy in simulations with high ambient pressure. Such a bright spot is also not observed in the secondary tail.
The most obvious question about ESO 137-001’s X-ray tails is why are there double tails. The simplest explanation is to involve another dwarf galaxy forming a pair with ESO 137-001. This was in fact simulated by Kapferer et al. (2008), showing double gaseous tails, stellar tidal tails and a stellar bridge between two galaxies. The X-ray gas mass of the secondary tail is 40% - 50% of the mass of the main tail, assuming the same filling factors of the X-ray gas. If we simply take the ratio of their X-ray gas masses as the ratio of their ISM gas masses, the stellar mass of this assumed dwarf that is responsible for the secondary tail should be 30% of ESO 137-001’s stellar mass, from the ISM mass - stellar mass relation summarized by Blanton & Moustakas (2009). Such a galaxy should be easily detected, at least through the tidal tails and bridge it causes even if it hides behind ESO 137-001. However, the SOAR images do not show the presence of another galaxy near ESO 137-001. There are also no tidal features upstream of the galaxy. There are some continuum features downstream of the galaxy as shown in S07. However, all of them are around confirmed HII regions and have blue colors. Our new HST data only reinforce the conclusion from the SOAR images. The central region of the galaxy is very dusty but the galaxy appears regular without significant tidal features in the HST band (Paper IV, in preparation). Thus, we conclude that both X-ray tails originate from ESO 137-001.
The discovery of two separated stripping tails from one galaxy presents a challenge to our understanding of stripping. In simulations (e.g., RB08; Kapferer et al. 2009; Tonnesen & Bryan 2009), cold ISM is removed from the sides of the disk or through holes and is quickly mixed to form one clumpy tail because of disk rotation, momentum transferred from the ICM and turbulence in the wake, especially if projected on the plane of sky. Perhaps we should begin to consider more realistic ISM distributions in the galaxy. Optical images clearly show the presence of two thick spiral arms, one to the north and the other one to the south (S07; better shown in the HST images). Maybe the two X-ray tails correspond to stripping of molecular gas concentrated around these two spiral arms. CO images of nearby face-on spiral galaxies indeed show that molecular gas distribution follows major spiral arms in many cases (e.g., Kuno et al. 2007). This is also generally true for HI gas (e.g., Adler & Westpfahl 1996). For ESO 137-001, we present a simple cartoon in Figure 16. The north arm is apparently the trailing arm where stripping is easier so a brighter X-ray tail is produced. The south arm is the leading arm so gas removal there is more difficult as most gas would be pushed inwards to deeper galactic potential first. This also explains the fact that more intracluster HII regions (at 15 kpc from the nucleus) are found around the main tail while the numbers of HII regions in the halo are similar at two sides. The curvature of the secondary tail may come from the galactic rotation, which is high enough to cause the observed offset. The main tail may also be curved in 3D but appears straight in projection. The rather regular wake structure may imply significant viscosity. On the other hand, draping of the ICM magnetic field (e.g., Dursi & Pfrommer 2008) can also inhibit the motion of the stripped ISM perpendicular to the direction of ram pressure.
In summary, it remains to be seen whether simulations can reproduce the double X-ray tails of ESO 137-001 as observed, and the gas properties in other bands (H and H2 at least). We also emphasize that the comparison between data and simulations is not trivial and straightforward. Observationally we need deeper data at multiple wavelengths. For simulations, mock data need to be produced with sensitivities matching the actual observations. Uncertainties in the viscosity, heat conduction, cooling and stellar feedback should be explored with different runs. Eventually we need to compare the multi-wavelength data (HI, CO, IR, optical and X-rays) with the mock data in the same band. Besides the simple comparison of morphology, a lot of details of the tail properties (e.g., temperature distribution, filling factors of the gas in different phases and energy transfer between gas in different phases) can be better examined.
7.3 Formation of Young Stars and X-ray Binaries in the Stripped ISM
The new observations of ESO 137-001, for the first time, unambiguously confirm the active star formation in the cold ISM stripped by the ICM ram pressure. As emphasized in S07, ESO 137-001’s immediate surroundings are devoid of bright galaxies. There are only two galaxies that are within 4 mag of ESO 137-001 in the band, within 100 kpc from the end of ESO 137-001’s X-ray tail (G1 and G2 in Figure 1 of S07). Their redshifts are unknown and they are 1.9 - 2.7 mag fainter than ESO 137-001 in the band. There is also no such galaxy within 70 kpc from the nucleus of ESO 137-001. Both G1 and G2 are undisturbed and there are no tidal features between ESO 137-001 and G1 (or G2). Our HST data do not reveal another dwarf galaxy near ESO 137-001 (Paper IV, in preparation). The velocity map of the HII regions also shows no extra component, besides ESO 137-001’s rotation pattern. It is also known that the cluster potential is not the main factor for stripping (S07; Sivanandam et al. 2010), although it indeed affects the size of ESO 137-001’s dark matter halo. Thus, we conclude that ICM ram pressure is responsible for the stripping of the ISM. In our case, the ambient pressure is even high enough to remove some molecular gas from the galaxy. The HI gas has typical pressures of K cm-3, while the pressure in the core of a starless giant molecular cloud can be higher than K cm-3. The ambient total thermal pressure (electron + ions) is 1.3 K cm-3 for = 10-3 cm-3 and =6 keV, while the ram pressure is 3.2 K cm-3 for = 10-3 cm-3 and = 1500 km/s.
After removing the cold ISM from the galaxy, the key for the intracluster star formation is that the stripped ISM must be able to cool, likely aided by shocks and the absence of the UV radiation field that is strong on the disk plane. Intracluster star formation in the stripped ISM was first suggested in simulations (Schulz & Struck 2001; Vollmer et al. 2001b). Schulz & Struck (2001) even suggested formation of dwarf galaxies in this mode. In the new GADGET-2/SPH simulations by Kronberger et al. (2008) and Kapferer et al. (2009), new stars are formed in the stripped ISM, forming 1 kpc structures with masses of up to 107 M⊙ individually to hundreds of kpc downstream of the galaxy. However, all simulations suffer from uncertainties in transport processes like viscosity and heat conduction, which are important for determining the heating rate.
More evidence of intracluster star formation, either HII regions or blue star clusters, has been revealed recently (e.g., Lee et al. 2000; Gerhard et al. 2002; Cortese et al. 2004; Cortese et al. 2007; Yoshida et al. 2008). They are only at one side of the galaxy. In some cases, tidal interaction may be important (e.g., Lee et al. 2000). But they all lack unambiguous associations with gaseous tails. We especially highlight the growing number of examples of one-sided blue stellar filaments and star clusters behind cluster galaxies, which includes two galaxies in A2667 and A1689 at 0.2 (Cortese et al. 2007) and a dwarf galaxy RB 199 in the Coma cluster (Yoshida et al. 2008). The connection between the first two galaxies at with ESO 137-001 was discussed in S07. In the case of RB 199, Yoshida et al. (2008) found narrow blue filaments, knots, H filaments and clouds extending to 80 kpc from the galaxy in one side. It is a rather remarkable case as the galaxy is much fainter than all previous galaxies, with a stellar mass of M⊙. The stellar mass of the downstream structures is M⊙, which is 10% of the galactic mass. Yoshida et al. (2008) also favored a mechanism similar to what we suggested for ESO 137-001 in S07. These three examples may imply a rather common evolution stage for cluster late-type galaxies. As the stage with bright blue stellar trails is short ( 200 Myr), more similar examples are expected only in large surveys.
If we assume that intracluster star formation happens in the stripped ISM of every cluster spiral, can this mode contribute a significant fraction of the intracluster light? The answer depends on the mass fraction of intracluster stars formed out of the stripped ISM (or the star formation efficiency). S07 gave a rough estimate of 1%, which may only be a lower estimate as blue stellar filaments and clusters (not shining in H) are not counted. While a detailed account of the total stellar mass downstream of ESO 137-001 is the aim of Paper IV, here we take 1% as a lower limit. If the efficiency of the intracluster star formation is only 1%, the intracluster light contributed from star formation in stripped ISM is small, given the mass fraction of the intracluster light to the total stellar light in clusters ( 20%, likely depending on the halo mass, e.g., Krick & Bernstein 2007). However, the case of RB 199 implies a fraction of 10%, if the original ISM in RB 199 had a mass comparable to its stellar mass (e.g., Blanton & Moustakas 2009). In the simulations by Kronberger et al. (2008) and Kapferer et al. (2009), 7% - 12% of the initial ISM turns into new stars in the wake. If an efficiency of 10% is adopted, the intracluster light contributed by ram pressure stripping is a significant fraction of the total intracluster light. However, this efficiency may not be too high given the star formation efficiency in galaxies. In galactic disks, 1% of gas is converted to stars per free-fall time (e.g., Leroy et al. 2008). In 100 Myr (a typical orbital time in the disks), 6% of gas is converted to stars (e.g., Kennicutt 1998; Leroy et al. 2008). We note that 100 Myr is also about the orbital time of the residual H disk ( 1.7 kpc radius with an orbital velocity of 100 km/s) and close to the age of the X-ray tails. Clearly, a lot of work is required to constrain the intracluster star formation efficiency. The efficiency may also change with the mass of the host galaxy as more stars are formed inside the halo of more massive galaxies. In principle, the ratio of the intracluster SNIa to the other types can also inform us the significance of intracluster star formation.
As active star formation is confirmed downstream of the galaxy, the discovery of ULXs is not a surprise. As we estimated in Section 5.2, the total luminosity of ULXs can be consistent with the expectation from the intracluster star formation rate. The space density of X-ray point sources also traces the strength of the star formation, stronger in the halo and weaker around the unbound tail. A similar system may be the high-velocity system of NGC 1275. Gonzalez-Martin et al. (2006) found a concentration of eight ULXs ( erg s-1) around the high-velocity system. They may be associated with the active star formation in and downstream of the high-velocity system, similar to what is happening in ESO 137-001.
8 Summary and Future Work
We present the discovery of spectacular X-ray double tails behind ESO 137-001 in the closest rich cluster A3627 from our 140 ks Chandra observation. Gemini spectroscopic data of HII regions downstream of ESO 137-001 are also discussed. We also present the discovery of a likely heated X-ray tail associated with ESO 137-002, also in A3627. The main results of this paper are:
1) Besides the known main X-ray tail of ESO 137-001, a fainter secondary tail is revealed with the deep Chandra observation, as well as some substructures (Section 3 and Figure 1 and 2). The double tails of ESO 137-001 make it morphologically resemble radio head-tail galaxies. The whole tail system exhibits intriguing regularity (almost constant tail widths, constant spectroscopic temperatures and well separated tails not twisted together) and some complexity (substructures). We consider that the soft X-ray emission of the tails come from the mixing of the stripped cold ISM with the hot ICM. We also conclude that the two tails are detached and both of them originate from ESO 137-001, stripped by the ICM ram pressure. One possible scenario (Section 7.2) involves the two major spiral arms of ESO 137-001 that is visible from the optical data, dense ISM (especially molecular gas) concentration around two arms, the orientation of the arms to the ram pressure and a weak level of turbulence downstream of the galaxy (or a higher viscosity than that in the current simulations).
2) The Chandra spectra reveal the multi-phase nature of the X-ray tails, requiring more than one thermal component to obtain good fits and reasonable abundance (e.g., 1 solar). However, the X-ray tails are always over-pressured to the ICM with the current simple models (Section 3.2). We also examined the spectroscopic temperature distribution in the tails with a single- model. ESO 137-001’s double tails are surprisingly isothermal ( 0.8 keV), embedded in 6 keV ICM (Figure 7).
3) ESO 137-001’s X-ray tails also present a challenge to the current simulations of stripping of cluster spirals (Section 7.2). Nevertheless, we emphasize that the comparison is not trivial and straightforward. Mock data from simulations need to be generated with sensitivities matching the actual observations. Eventually we need multi-wavelength data (e.g., HI, CO, IR, optical and X-rays) in order to examine the interplay and energy transfer between gas in different phases (Section 7.1 and Figure 15).
4) Gemini spectra were obtained for 33 emission-line regions identified by S07 (Section 5.1). All of them are confirmed as HII regions downstream of ESO 137-001 (Section 5.1 and Figure 9-11). Their velocity map shows the imprint of ESO 137-001’s rotation pattern (Figure 10). For the first time, we unambiguously know that active star formation can happen in the cold ISM stripped by ICM ram pressure. We also summarized the current known cases of intracluster star formation, especially ones with one-sided blue star clusters and stellar trails (Section 7.2). The intracluster star-formation efficiency is expected to be higher than 1%. The contribution to the intracluster light from this mode can be high if the star-formation efficiency is as high as 10% (Section 7.3).
5) This deep observation also reveals many X-ray point sources (Section 5.2). A significant source excess is observed immediately downstream of ESO 137-001. Four of the X-ray point sources are within 0.65 kpc from spectroscopically confirmed HII regions. We consider them strong candidates for intracluster ULXs with erg s-1. Other candidates (at least two) have up to 2.5 erg s-1. We also conclude that the observed total X-ray luminosity of the intracluster ULXs is consistent with the expectation from the observed total star formation rate of HII regions.
6) A 40 kpc X-ray tail was detected behind another late-type galaxy in A3627, ESO 137-002 (Section 6). Signatures of stripping were also found in the H data, with a sharp H edge and an H tail extending to at least 20 kpc from the nucleus. No HII regions are found downstream of ESO 137-002. Its X-ray tail is also surprisingly hot ( 2 keV) but the uncertainty is big. We suggest that ESO 137-002’s stripping event is at a more advanced stage than ESO 137-001’s.
Why are there two bright X-ray tails of late-type galaxies in A3627? Besides coincidence, the high ambient pressure (ram pressure + thermal pressure) in A3627 should also play a role, making soft X-ray tails denser and more luminous. This would explain the absence of bright X-ray tails of late-type galaxies in the Virgo cluster (see Section 7.1). A high-pressure environment also help intracluster star formation, by moving high-density molecular gas into the intracluster space.
This paper mainly focuses on the Chandra data of ESO 137-001. In a future paper, we will examine the intracluster star formation downstream of ESO 137-001 in more detail, from the HST and Gemini data. HI and CO data will also be pursued. With a more complete set of multi-wavelength data, the nature of the X-ray tails and the intracluster star-formation could be better understood. ESO 137-001 provides the best opportunity to simultaneously study stripping and the related important questions across the electromagnetic spectrum.
References
- (1)
- (2) Abadi, M. G., Moore, B., Bower, R. G. 1999, MNRAS, 308, 947
- (3) Adler, D. S., & Westpfahl, D. J. 1996, AJ, 111, 735
- (4) Anders, E., & Grevesse N. 1989, Geochimica et Cosmochimica Acta, 53, 197
- (5) Bekki, K., & Couch, W. J. 2003, ApJ, 596, L13
- (6) Bhringer, H. et al. 1996, ApJ, 467, 168
- (7) Blanton, M. R. & Moustakas, J. 2009, ARA&A, 47, 159
- (8) Chung, A. et al. 2007, ApJ, 659, L115
- (9) Cortese, L. et al. 2004, A&A, 416, 119
- (10) Cortese, L. et al. 2007, MNRAS, 376, 157
- (11) Dekel, A., & Birnboim, Y. 2008, MNRAS, 383, 119
- (12) Dickey, J. M., & Lockman, F. J. 1990, ARA&A, 28, 215
- (13) Dursi, L. J., & Pfrommer, C. 2008, ApJ, 677, 993
- (14) Finoguenov, A. et al. 2004, A&A, 419, 47
- (15) Gavazzi, G. et al. 2001a, A&A, 377, 745
- (16) Gavazzi, G. et al. 2001b, ApJ, 563, L23
- (17) Gavazzi, G. et al. 2005, A&A, 429, 439
- (18) Gerhard, O. et al. 2002, ApJ, 580, L121
- (19) Giovanelli, R., Haynes, M. P. 1985, ApJ, 292, 404
- (20) Grimm, H. J., Gilfanov, M., Sunyaev, R. 2003, MNRAS, 339, 793
- (21) Gonzalez-Martin, O., Fabian, A. C., Sanders, J. S. 2006, MNRAS, 367, 1132
- (22) Gunn, J. E., & Gott, J. R., III 1972, ApJ, 176, 1
- (23) Hamuy, M. et al. 1994, PASP, 106, 566
- (24) Kalberla, P. M. W. et al. 2005, A&A, 440, 775
- (25) Kapferer, W. et al. 2008, MNRAS, 389, 1405
- (26) Kapferer, W. et al. 2009, A&A, 499, 87
- (27) Kenney, J. D. P., van Gorkom, J. H., Vollmer, B. 2004, AJ, 127, 3361
- (28) Kenney, J. D. P. et al. 2008, ApJ, 687, L69
- (29) Kennicutt, R. C., Jr. 1998, ApJ, 498, 541
- (30) Kim, Minsun et al. 2007, ApJ, 659, 29
- (31) Kraan-Korteweg, R. C. et al. 1996, Nature, 379, 519
- (32) Krick, J. E., & Bernstein, R. A. 2007, AJ, 134, 466
- (33) Kronberger, T. et al. 2008, A&A, 481, 337
- (34) Kuno, N. et al. 2007, PASJ, 59, 117
- (35) Lee, H., Richer, M. G., McCall, M. L. 2000, ApJ, 530, L17
- (36) Leitherer, C. et al. 1999, ApJS, 123, 3
- (37) Leroy, A. K. et al. 2008, AJ, 136, 2782
- (38) Machacek, M. E. et al. 2004, ApJ, 610, 183
- (39) Machacek, M. E. et al. 2005, ApJ, 630, 280
- (40) Machacek, M. E., Jones, C., Forman, W., Nulsen, P. 2006, ApJ, 644, 155
- (41) Nulsen, P. E. J. 1982, MNRAS, 198, 1007
- (42) Oosterloo, T., van Gorkom, J. 2005, A&A, 437, 19L
- (43) Quilis, V., Moore, B., & Bower, R. G. 2000, Science, 288, 1617
- (44) Randall, S. et al. 2008, ApJ, 688, 208
- (45) Roediger, E., & Hensler, G. 2005, A&A, 433, 875 (RH05)
- (46) Roediger, E. et al. 2006, MNRAS, 371, 609
- (47) Roediger, E., & Brggen, M. 2008a, MNRAS, 388, L89
- (48) Roediger, E., & Brggen, M. 2008b, MNRAS, 388, 465 (RB08)
- (49) Schulz, S., & Struck, C. 2001, MNRAS, 328, 185
- (50) Sivanandam, S., Rieke, M., Rieke, G. 2010, ApJ, in press, arXiv:0912.0075
- (51) Skelton, R. E., Woudt, P. A., Kraan-Korteweg, R. C. 2009, MNRAS, 396, 2367
- (52) Stevens, I. R., Acreman, D. M., Ponman, T. J. 1999, MNRAS, 310, 663
- (53) Sun, M., & Vikhlinin, A. 2005, ApJ, 621, 718
- (54) Sun, M. et al. 2006, ApJ, 637, L81 (S06) (paper I)
- (55) Sun, M. et al. 2007a, ApJ, 657, 197
- (56) Sun, M., Donahue, M., Voit, G. M. 2007b, ApJ, 671, 190 (S07) (paper II)
- (57) Sun, M. 2009, ApJ, in press, arXiv:0904.2006
- (58) Tonnesen, S., & Bryan, G. L. 2009, ApJ, submitted, arXiv:0909.3097
- (59) Vollmer, B. et al. 2001a, A&A, 369, 432
- (60) Vollmer, B., Cayatte, V., Balkowski, C., Duschl, W. J. 2001b, ApJ, 561, 708
- (61) Vollmer, B., Huchtmeier, W. 2007, A&A, 462, 93
- (62) Wang, Q. D., Owen, F., Ledlow, M. 2004, ApJ, 611, 821
- (63) Woudt, P. A. et al. 2004, A&A, 415, 9
- (64) Woudt, P. A. et al. 2008, MNRAS, 383, 445
- (65) Yagi, M. et al. 2007, ApJ, 660, 1209
- (66) Yoshida, M. et al. 2002, ApJ, 567, 118
- (67) Yoshida, M. et al. 2008, ApJ, 688, 918
- (68)
| Modelb | Parametersc | C-statisticd (d.o.f) |
|---|---|---|
| APEC | =0.8050.033, =0.060.02 | 40.3 (46) |
| APEC | =0.7800.020, =(0.5) | 105.1 (47) |
| APEC+APEC | =0.719, =0.20, =2.0, =(0.20), NORM1/NORM | 30.1 (44) |
| APEC+APEC | =0.668, =(1.0), =1.7, =(0.20), NORM1/NORM | 31.0 (45) |
| APEC+PL | =0.761, =0.10, =(1.7), | 32.5 (45) |
| APEC+PL | =0.754, =(1.0), =2.360.16, | 33.5 (46) |
| CEMEKL | =0.47, =2.8, =0.35 | 34.7 (45) |
| CEMEKL | =0.370.15, =6.0, =(1.0) | 37.0 (46) |
| Property | ESO 137-001 | ESO 137-002 |
|---|---|---|
| Heliocentric velocity (km/s)a | 4660 (-211) | 5743 (+872) |
| log(LKs/L⊙)b | 10.42 (10.18) | 11.11 (11.20) |
| (mag)c | 2.76 (2.15) | 3.18 (3.40) |
| (109 M⊙)d | 5 - 8 | 32 - 39 |
| (kpc kpc)e | 8, 80 7 | 5 |
| (keV)f | 0.800.04 | 1.98 |
| (erg cm-2 s-1) (tail)f | (8.30.4) | (3.40.5) |
| (erg s-1) (tail)f | (8.30.4) | (3.20.5) |
| (erg s-1) (tail)f | (1.80.1) | (7.81.2) |
| (erg s-1) (total)f | (1.100.05) | (5.50.9) |
| (erg s-1)g | (1.40.2) | |
| ( cm-3)h | 0.0073 - 0.019 | 0.0055 - 0.019 |
| ( M⊙)h |
| Source #a | RAb | Decb | 0.5 - 7 keV countsc | note | ||
|---|---|---|---|---|---|---|
| (J2000) | (J2000) | (10-15 erg s-1 cm-2) | ||||
| 1 | 16:13:30.43 | -60:45:18.2 | 17.35.1 | 1.60.5 | (1.7) | a bright stellar object |
| 2 | 16:13:29.76 | -60:46:30.0 | 47.37.6 | 12.42.0 | 0.020.31 | a faint optical source |
| 3 | 16:13:27.66 | -60:46:22.7 | 35.46.6 | 3.20.6 | (1.7) | a bright stellar object |
| 4 | 16:13:27.75 | -60:45:34.4 | 17.55.0 | 1.60.5 | (1.7) | no optical counterpart |
| 5 | 16:13:27.44 | -60:45:54.4 | 41.47.3 | 3.70.7 | (1.7) | no optical counterpart |
| 6 | 16:13:26.03 | -60:45:38.3 | 13.94.6 | 1.30.4 | (1.7) | no optical counterpart |
| 7 | 16:13:25.80 | -60:45:45.3 | 64.69.1 | 6.61.0 | 3.450.44 | a bright stellar object |
| 8* | 16:13:25.76 | -60:45:10.3 | 33.36.7 | 3.00.6 | (1.7) | between two HII regions, 1.3′′ from them |
| 9 | 16:13:24.43 | -60:45:45.2 | 115.111.6 | 9.81.0 | 1.870.17 | 4.0′′ from an HII region |
| 10* | 16:13:24.30 | -60:46:06.6 | 42.07.2 | 3.50.6 | 2.170.33 | 2.0′′ from an HII region |
| 11* | 16:13:24.29 | -60:45:37.2 | 116.511.7 | 11.41.2 | 1.540.19 | 0.8′′ from an HII region |
| 12 | 16:13:23.57 | -60:45:29.8 | 414.321.0 | 42.62.2 | 1.380.09 | 2.6′′ from an HII region |
| 13 | 16:13:18.28 | -60:43:55.8 | 32.66.6 | 3.00.6 | (1.7) | no optical counterpart |
| 14 | 16:13:16.94 | -60:44:51.5 | 23.05.7 | 2.10.5 | (1.7) | a bright stellar object |
| 15* | 16:13:16.76 | -60:44:18.1 | 16.84.8 | 1.60.5 | (1.7) | 1.0′′ from an HII region |
| 16 | 16:13:10.74 | -60:44:37.6 | 16.54.9 | 1.50.5 | (1.7) | a bright stellar object |
| 17 | 16:13:10.19 | -60:45:04.0 | 32.76.5 | 3.00.6 | (1.7) | a bright stellar object |
| 18 | 16:13:07.12 | -60:44:54.3 | 17.04.9 | 1.60.5 | (1.7) | no optical counterpart |
| 19 | 16:13:06.34 | -60:43:38.0 | 48.47.9 | 4.90.8 | 1.380.32 | a faint optical source |
| Regiona | Modelb | Parametersc | C-statisticd (d.o.f) |
|---|---|---|---|
| Tail | APEC | =1.98, =0.03, (gas)=(3.2 | 7.6 (10) |
| APEC+POW | =1.08, =0, =(1.7) | 6.4 (9) | |
| (gas)=(2.1, (PL)=(3.8 | |||
| APEC+POW | =1.11, =(1.0), =(1.7) | 8.6 (10) | |
| (gas)=(9.5, (PL)=(5.9 | |||
| CEMEKL | =1.5, =(6.0), =(1.0) | 9.2 (11) | |
| Nucleus | APEC+PHABS(POW) | =1.04, =0, , =(1.7) | 5.1 (11) |
| APEC+POW+PHABS(POW) | =0.36, =0.01, =(1.7), , =(1.7) | 2.3 (10) | |
| (gas)=(1.9, (nuc.)=(1.7 |